Liquidity Sweep Sniper AP StyleAP Capital – Liquidity Sweep Sniper (Fab-Style)
📌 Overview
This indicator is a precision scalping tool inspired by professional liquidity-based trading concepts often demonstrated by elite intraday scalpers.
The script focuses on liquidity sweeps followed by strong displacement, aiming to capture short, high-probability momentum moves — particularly effective on lower timeframes (1–5 min) during active market sessions.
It is not a signal spam tool. Signals appear only when multiple objective conditions align.
🧠 Core Concept
Markets do not move randomly — they seek liquidity before expanding.
This indicator identifies:
Buy-side / Sell-side liquidity
Liquidity sweeps (stop-hunts)
Strong displacement candles reclaiming price
Optional higher-timeframe trend alignment
Only when all conditions are met does a signal print.
🔍 What the Indicator Detects
1️⃣ Liquidity Pools
Equal highs or equal lows detected within a configurable lookback
Minimum number of touches required
ATR-based tolerance to adapt to volatility
These levels represent areas where stop orders are likely resting.
2️⃣ Liquidity Sweep
A valid sweep requires:
Price to wick beyond the liquidity level
Candle to close back inside the range
This indicates failed breakout / stop-hunt behaviour.
3️⃣ Displacement Confirmation
After the sweep, the candle must show:
Strong body (default >60% of candle range)
Candle range large relative to ATR
Clear directional intent (momentum)
This filters out weak reactions and chop.
4️⃣ Optional Trend Filter
EMA-based higher-timeframe bias
Helps align scalps with dominant direction
Can be enabled or disabled
📈 Signals
BUY: Sell-side liquidity sweep → bullish displacement
SELL: Buy-side liquidity sweep → bearish displacement
Signals are plotted directly on the chart and can be used with alerts.
⚙️ Recommended Usage
Markets: XAUUSD, indices, liquid FX pairs
Timeframes: 1m–5m
Sessions: London & New York (best performance)
Risk Management: Always required — this tool does not place trades
Best used as a confirmation tool, not standalone.
⚠️ Important Notes
This indicator is inspired by liquidity-based scalping concepts, not an exact replication of any individual trader’s private strategy.
No indicator predicts the future — this tool highlights high-probability scenarios, not guarantees.
Past performance is not indicative of future results.
Sniper

Kalman Trend Sniper# KALMAN TREND SNIPER
## ORIGINALITY STATEMENT
The Kalman Trend Sniper combines adaptive trend detection with precision entry validation to identify high-probability trading opportunities. Unlike static moving averages that use fixed parameters, this indicator adapts to changing market volatility through ATR-based gain adjustment and distinguishes trending from ranging markets using ADX regime detection.
The indicator's unique contribution is its three-phase entry validation system: signals must hold for three bars, undergo a pullback test to the signal level, and receive confirmation through price action before generating an entry. This structured approach helps traders enter established trends at favorable retracement levels rather than chasing momentum.
---
## TECHNICAL METHODOLOGY
### Kalman Filter Implementation
This indicator implements an Alpha-Beta variant of the Kalman filter, a recursive algorithm that estimates trend from noisy price data:
1. Prediction: kf = kf + velocity
2. Error calculation: error = price - kf
3. Correction: kf = kf + gain * error
4. Velocity update: velocity = velocity + (gain * error) / 2
The gain parameter determines filter responsiveness. Higher gain values track price more closely but increase noise sensitivity, while lower values provide smoother output but lag price changes.
### Adaptive Gain Mechanism
The indicator adjusts gain dynamically based on volatility:
Volatility Factor = Current ATR / Long-term ATR
Adaptive Gain = Base Gain * (0.7 + 0.6 * Volatility Factor)
This ATR ratio increases responsiveness during high-volatility periods and reduces sensitivity during consolidations, addressing the fixed-parameter limitation of traditional moving averages. The volatility factor is bounded between configurable minimum and maximum values to prevent extreme adjustments.
### Regime Detection
The indicator uses the Average Directional Index (ADX) to distinguish market conditions:
- Trending markets (ADX above threshold): Full gain applied, signals generated
- Ranging markets (ADX below threshold): Gain reduced 25%, fewer signals
This regime awareness helps reduce whipsaw signals during sideways consolidation periods.
### Signal Line Validation System
When the Kalman line changes direction in trending conditions, the indicator draws a horizontal signal line at the low (for long signals) or high (for short signals) of the signal candle. This line represents a potential support or resistance level.
The validation system then monitors three phases:
Phase 1 - Hold Period: Price must remain above (long) or below (short) the signal line for three consecutive bars. This requirement filters weak signals where price immediately violates the signal level.
Phase 2 - Test: After the hold period, the system waits for price to pull back and touch the signal line, with configurable tolerance for volatile instruments.
Phase 3 - Confirmation: Within eight bars of the test, a confirmation candle must close above (long) or below (short) the test candle's body, demonstrating renewed momentum. If confirmation does not occur within eight bars, the validation attempt expires.
Successful validation generates an R label at the entry point. This three-phase structure helps identify entries where trend direction and support/resistance validation align.
---
## USAGE INSTRUCTIONS
### Signal Interpretation
Triangle Signals:
- Upward triangle (teal): Kalman line turns bullish in trending market (ADX above threshold)
- Downward triangle (red): Kalman line turns bearish in trending market
Signal Lines (horizontal):
- Teal line: Potential long support level at signal candle low
- Red line: Potential short resistance level at signal candle high
- Gray line: First opposite-color candle after signal (initial reversal pressure)
R Labels (optional, disabled by default):
- Green R below price: Validation complete for long entry
- Red R above price: Validation complete for short entry
Stop Levels:
- Red dots: Long stop level (Kalman line minus ATR multiplier)
- Teal dots: Short stop level (Kalman line plus ATR multiplier)
### Dashboard Information
The dashboard displays real-time indicator state:
- Trend: Current Kalman direction (BULL/BEAR)
- Regime: Market classification (Trending when ADX exceeds threshold, Ranging otherwise)
- Gain: Current adaptive gain value
- Vol Factor: Volatility ratio (current ATR / long-term ATR)
- ADX: Trend strength (higher values indicate stronger trends)
- Z-Score: Standard deviation distance from Kalman line (when enabled)
- Stop Dist: Current ATR-based stop distance
- Lines: Number of active signal lines displayed
- R-Status: Validation system state (Idle / Waiting / Testing)
### Trading Applications
Trend Following Approach:
1. Wait for triangle signal in trending market (ADX above threshold)
2. Enter immediately at signal candle close or wait for pullback
3. Place stop at displayed stop level
4. Trail stop using Kalman line as dynamic support/resistance
Validation Entry Approach (conservative):
1. After triangle signal, observe three-bar hold period
2. Wait for pullback to signal line (test phase)
3. Enter on R label confirmation
4. Place stop below/above signal line
5. Provides higher probability entries but reduces trade frequency
Z-Score Mean Reversion (when enabled):
1. Watch for Z-Score exceeding entry threshold (default +/-2.0)
2. Consider counter-trend entries when price touches Kalman line
3. Target return to Kalman line (Z-Score near zero)
4. Use Z-Score threshold as stop level for extreme continuation
### Optimal Conditions
The indicator performs optimally in clearly trending markets where ADX consistently exceeds the threshold. Performance degrades in sideways, choppy conditions.
Recommended timeframes:
- 1-5 minute charts: Use Crypto_1M preset (faster adaptation)
- 15-60 minute charts: Use Crypto_15M preset (balanced)
- Hourly charts: Use Forex preset (smoother)
- Daily charts: Use Stocks_Daily preset (long-term trends)
Market conditions:
- High volatility (Vol Factor above 1.5): Expect faster adaptation, wider stops needed
- Normal volatility (Vol Factor 0.7-1.5): Standard behavior
- Low volatility (Vol Factor below 0.7): Expect slower adaptation, tighter stops possible
---
## PARAMETER DOCUMENTATION
### Kalman Filter Settings
Preset Mode: Select optimized configuration for specific markets
- Custom: Manual parameter control
- Crypto_1M: Base Gain 0.05, ATR 7 (fast response for 1-5 minute crypto charts)
- Crypto_15M: Base Gain 0.03, ATR 14 (balanced for 15-60 minute crypto charts)
- Forex: Base Gain 0.02, ATR 14 (standard for forex pairs)
- Stocks_Daily: Base Gain 0.01, ATR 20 (smooth for daily stock charts)
Base Gain (0.001-0.2): Core Kalman filter responsiveness parameter. Higher values increase sensitivity to price changes. Low values (0.01-0.02) provide smooth output with fewer whipsaws but slower trend changes. High values (0.06-0.08) offer fast response with more signals but increased whipsaw risk.
Adaptive (checkbox): When enabled, automatically adjusts gain based on ATR ratio. Recommended to keep enabled for dynamic volatility adaptation.
ATR (5-50): Short-term Average True Range period for current volatility measurement. Default 14 is industry standard. Lower values respond faster to volatility changes.
Long ATR (20-200): Long-term ATR period for baseline volatility comparison. Default 50 provides stable reference. The ratio between ATR and Long ATR determines adaptive adjustment magnitude.
Regime Filter (checkbox): Enables ADX-based trending/ranging detection. When enabled, reduces gain by 25 percent during ranging markets to minimize false signals.
ADX Period (7-30): Period for ADX calculation. Default 14 is standard. Lower values respond faster to trend strength changes.
Threshold (15-40): ADX level distinguishing trending from ranging markets. Default 25. Above threshold: trending (generate signals normally). Below threshold: ranging (reduce sensitivity).
Min Vol / Max Vol (0.3-3.0): Bounds for volatility factor adjustment. Prevents extreme gain changes during unusual volatility spikes or quiet periods. Default minimum 0.5, maximum 2.0.
Stop ATR x (1.0-3.0): Multiplier for ATR-based stop loss distance. Default 2.0 places stops two ATRs from Kalman line. Use 1.5 for tight stops (intraday), 2.5-3.0 for wide stops (swing trading).
Show Signals (checkbox): Displays triangle signals when Kalman changes direction in trending markets. Disable to use indicator purely as dynamic support/resistance without signals.
Z-Score (checkbox): Enables mean-reversion signal generation based on statistical deviation from Kalman line.
Period (10-100): Lookback period for Z-Score standard deviation calculation. Default 20 bars. Longer periods produce smoother, less sensitive readings.
Entry (1.5-3.5): Standard deviation threshold for Z-Score signals. Default 2.0 generates signals at plus/minus two standard deviations (approximately 95th percentile moves).
Bull / Bear Colors: Customize Kalman line colors for uptrend (default teal) and downtrend (default red).
Fill (checkbox): Shows semi-transparent fill between price and Kalman line for visual trend emphasis.
### Signal Line System Settings
Signal Lines (checkbox): Displays horizontal signal lines at low (long) or high (short) of signal candles. These function as dynamic support/resistance levels.
Reverse Lines (checkbox): Shows gray horizontal lines at first opposite-colored candle after signal. Helps identify initial resistance points in new trends.
Max Lines (0-20): Maximum number of signal lines to display simultaneously. Older lines are removed as new signals appear. Use 1-2 for clean charts, 3-5 for recent support/resistance history.
Style (Solid/Dotted/Dashed): Visual style for signal and reverse lines. Dotted provides subtle appearance, solid is most prominent.
Line % / Label % (0-100): Transparency percentage for lines and labels. Zero is fully opaque, 100 is invisible.
R Labels (checkbox): Shows R labels when validation confirmation occurs. Default disabled. Enable if you want visual confirmation of successful pullback entries.
Tolerance % (0-1.0): Price deviation tolerance for test candle detection. Zero requires exact touch. 0.5 allows 0.5 percent deviation for volatile instruments.
### Dashboard Settings
Show Dashboard (checkbox): Toggles visibility of information panel. Disable for clean chart presentation.
Position: Choose dashboard location from nine positions (Top/Middle/Bottom combined with Left/Center/Right).
---
## LIMITATIONS AND WARNINGS
This indicator is a technical analysis tool that processes historical price data. It does not predict future price movements.
Inherent limitations:
1. Lagging nature: Like all trend indicators, the Kalman filter lags price. Signals occur after trend changes begin, not before.
2. Ranging markets: Generates fewer signals and reduced performance when ADX falls below threshold. Not optimized for sideways consolidation.
3. Whipsaw risk: In choppy, indecisive markets near ADX threshold, signals may reverse quickly despite regime filtering.
4. Parameter sensitivity: Inappropriate Base Gain settings can cause over-trading (too high) or missed trends (too low).
5. Validation requirement: The three-phase confirmation system provides higher accuracy but significantly reduces trade frequency. Not all trends produce valid pullback entries.
Not suitable for:
- Scalping strategies requiring instant signals (Kalman filter has intentional smoothing)
- Ultra-high frequency trading (indicator updates once per bar close)
- Markets with extreme overnight gaps (stops may be exceeded)
- Strategies requiring signals on Heikin Ashi, Renko, Kagi, Point and Figure, or Range charts
Risk management requirements:
This indicator provides trend direction and signal levels but does not incorporate position sizing, risk management, or account balance considerations. Users must implement appropriate position sizing, maximum daily loss limits, and portfolio diversification. Past performance does not indicate future results.
Optimal usage:
- Works optimally in clearly trending markets where ADX consistently exceeds threshold
- Performance degrades in sideways, choppy conditions
- Designed for swing trading and position trading timeframes (15-minute and above)
- Requires confirmation from price action or additional technical analysis
---
## NO REPAINT GUARANTEE
This indicator operates on bar close confirmation only. All signals, signal lines, and validation labels appear exclusively when candles close. Historical signals remain exactly where they appeared. This makes the indicator suitable for automated trading and reliable backtesting. What you see in historical data matches what appeared in real-time.
---
## ALERTS
The indicator provides eight alert conditions:
1. Kalman Buy Signal: Fires when upward triangle appears (bullish trend change in trending market)
2. Kalman Sell Signal: Fires when downward triangle appears (bearish trend change in trending market)
3. Trend Change to Bullish: Fires whenever Kalman line changes to bullish (regardless of ADX)
4. Trend Change to Bearish: Fires whenever Kalman line changes to bearish (regardless of ADX)
5. SCT-R Long Retest Confirmed: Fires when green R label appears for long validation
6. SCT-R Short Retest Confirmed: Fires when red R label appears for short validation
7. SCT Test Long Detected: Fires when test candle appears for long signal (before confirmation)
8. SCT Test Short Detected: Fires when test candle appears for short signal (before confirmation)
Alert messages include context about bar close confirmation and current price levels.
---
## CALCULATION TRANSPARENCY
While complete proprietary optimization methodology is not disclosed, the core technical approach is fully explained: Alpha-Beta Kalman filter with ATR-based adaptive gain adjustment and ADX regime detection. The signal line validation system uses a three-phase structure (hold, test, confirmation) with configurable parameters. Users can understand indicator functionality and make informed decisions about application.
---
## DISCLAIMER
This indicator is provided as a technical analysis tool. It does not constitute financial advice, trading recommendations, or performance guarantees. All trading decisions carry risk. Users are responsible for their own trading decisions and risk management. Past results do not indicate future performance.

WJ STS Session SniperA precision-built indicator designed to support the STS (Session Trading System) framework taught by Jay and customized by Willy.
This tool acts as a decision engine, risk module, and session filter, helping you execute session-based scalps with strict discipline and clean rules.
The STS Companion does not replace TV Blast — it enhances it.
This indicator helps you follow the strategy exactly as intended:
• Only trade key session opens
• Only take trades where multi-timeframe momentum aligns
• Only take trades where volume delta confirms direction
• Only take trades when the session is producing a clean impulse
• Use swing-based stop-loss logic
• Automatically calculate the correct micro contract size
• Only take setups when all conditions match your trading plan
⸻
🎯 The Core Principles Behind the Indicator
The STS strategy is built around a simple philosophy:
“Trade only when the market is moving with force, and avoid 99% of chop.”
This companion implements that philosophy with:
⸻
🕒 High-Volume Session Targeting
The indicator highlights and focuses on the first minutes of major global opens:
• Shanghai / Asia Open
• Frankfurt Open
• London Open
• New York (08:20 futures open)
Each session has a defined “trade window” (default 20 minutes) where institutional liquidity and momentum typically enter the market.
This is where the STS edge lives.
⸻
📊 Multi-Timeframe Sentiment Engine (MTF Bias)
The indicator monitors up to four custom timeframes simultaneously and categorizes momentum as:
• Strong Buy
• Strong Sell
• Buy
• Sell
• Mixed
When ALL selected timeframes agree, bars are highlighted for instant direction clarity:
• Blue bars = all bullish
• White bars = all bearish
⸻
🔥 Volume Delta Engine (Aggression Detection)
Tracks real-time buying/selling pressure using:
• Delta EMA
• Volume filters
• High-volume expansion events
High-volume spikes aligned with trend are marked:
• White dot = bullish high-volume impulse
• Gold dot = bearish high-volume impulse
This identifies when large players are stepping in.
⸻
⚡ Breakout-Based Impulse Filter (“Pseudo Blast”)
Uses a breakout and momentum model to identify:
• The first expansion move after a session open
• Directional commitment
• Low-risk, high-RR scalping opportunities
This is the core trigger that aligns with STS-style entries.
⸻
🧮 Structural Stop-Loss + Position Sizing
The indicator automatically calculates:
• Nearest 1-minute swing high/low
• Stop distance in ticks
• Micro contract size based on your dollar risk input
This ensures high consistency and discipline, perfect for:
• TopStep
• Apex
• FundedNext
• Any account with a daily loss limit or tight risk rules
Setup signals only print when risk, stop, and volatility conditions are all safe.
⸻
🟢 When a Valid Setup Appears
The indicator will show:
• A triangle (long/short candidate)
• A label with:
• Stop-loss in ticks
• Recommended micro contract size
This means the system has aligned:
1. Session window
2. MTF bias
3. Volume delta
4. Breakout impulse
5. Proper stop
6. Safe position size
Only then does the STS Companion mark a bar.
⸻
📌 How to Use This Indicator
1. Wait for a major session open
Focus especially on Shanghai, Frankfurt, London, and NY.
2. Check the MTF bias
Blue = all bullish
White = all bearish
Avoid mixed conditions.
3. Confirm volume delta
Look for white/gold high-volume dots aligned with direction.
4. Wait for an impulse breakout
A triangle marks the potential STS entry bar.
5. Use the provided micro size
Position sizing is based on swing stop + your risk per trade.
6. Execute your plan
The indicator supports discipline — it does not override your rules.
⸻
⭐ Designed For
• Gold futures traders (XAUUSD / GC / MGC)
• Session scalpers
• Prop firm traders
• Momentum + breakout scalpers
• Anyone wanting mechanical, rule-based setups
⸻
🔒 Important
This indicator does not auto-trade.
It does not duplicate TV Blast.
It provides a clean, rules-based system to support the STS session methodology with precision and consistency.

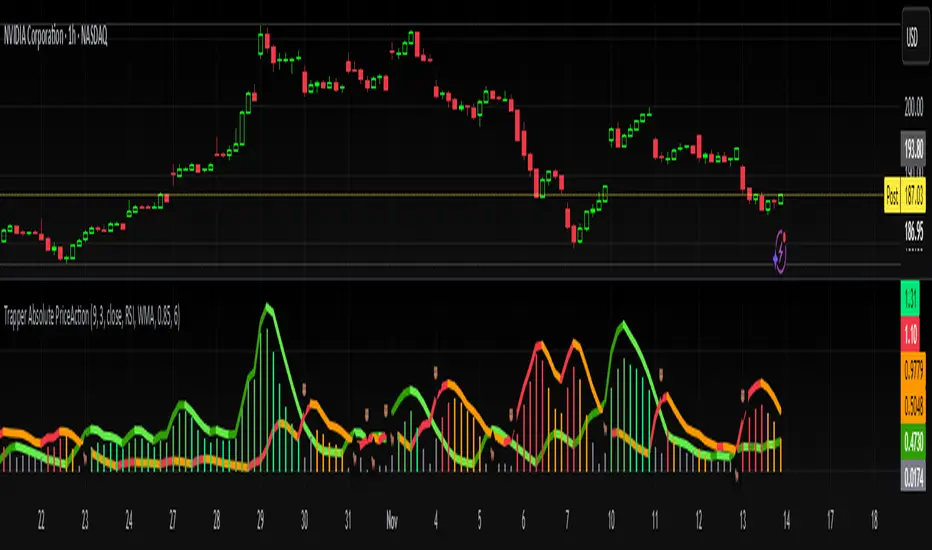
Trapper Absolute PriceActionThe Trapper Absolute PriceAction (TAPA) indicator is a custom, momentum-based oscillator designed to help traders visually read shifts in bullish and bearish price strength — with no reliance on volume or external data.
TAPA calculates and smooths both bullish and bearish momentum using multiple methods (RSI, Stochastic, or ADX) and compares their relative strength in real time. The result is a clean dual-line oscillator with color-coded histograms that highlight which side of the market currently has control.
It was built to give traders a sniper-level precision tool for detecting early momentum shifts before they appear clearly on price charts, allowing confirmation or invalidation of setups faster than with lagging indicators.
How It Works
Momentum Strength Calculation
The script measures directional price movement across the chosen mode (RSI, Stochastic, or ADX).
These values are smoothed twice using a selectable moving average type (WMA, EMA, SMA, ALMA, HMA, etc.).
Bullish & Bearish Curves
The green line represents smoothed bullish momentum (SmthBulls).
The orange/red line represents smoothed bearish momentum (SmthBears).
Histogram Strength Visualization
The distance between the two curves forms a color-coded histogram.
Green/Lime bars indicate growing bullish control, while Orange/Red bars show bearish dominance.
A gray neutral zone reflects indecision or range-bound conditions.
Signal Triggers
BUY 🐂 appears when the green line crosses up through the orange — signaling a bullish momentum flip.
SELL 🐻 appears when the green line crosses down through the orange — signaling bearish control.
Alerts can be enabled directly in TradingView through the BUY (🐂) or SELL (🐻) alert conditions for automated notifications or integrations.
How to Use
1. Confirm Early Momentum Shifts
When a crossover appears, check that the histogram color supports the move (green shades for bullish, red/orange for bearish).
Avoid signals when both lines are tangled and the histogram alternates gray, that usually indicates consolidation or low volatility.
2. Validate with Higher-Timeframe Structure
TAPA is most powerful when aligned with trend structure from higher timeframes.
Example: A bullish crossover on the 1-hour timeframe, while the daily TAPA shows the green line already rising, can confirm momentum alignment before entry.
3. Combine with Support/Resistance
Mark your key support and resistance zones (manual or using your “Trapper S&R PRO” indicator).
Look for a TAPA bullish crossover occurring at a major support zone, that’s often the start of a reversal move.
4. Multi-Mode Analysis
Experiment with “Indicator Method” in the inputs:
RSI Mode - smoother and responsive for swing trading.
Stochastic Mode - better for short-term entries and exits.
ADX Mode - captures trending momentum on strong breakouts.
Examples
Bullish Example:
Price forms a higher low on the chart while TAPA’s green line crosses up through orange with a lime/green histogram. That’s a strong early signal that momentum is reversing before price confirms on structure.
Bearish Example:
Price rallies into resistance, then TAPA shows a red histogram and a bearish cross (green dropping under orange). That’s typically a high-probability short signal once structure breaks.
What Makes TAPA Different
No Volume Dependency: Focuses purely on price behavior, not volume spikes or anomalies.
Multi-Mode Engine: Switch between RSI, Stochastic, or ADX-style momentum math instantly.
Customizable Visuals: Editable histogram color layers (weak/strong bull/bear, neutral) and line color control.
Sniper Labeling System: Clean, minimal BUY/SELL cues at each verified crossover.
Alert-Ready: Built-in conditions allow for TradingView alerts, webhooks, or bot automation.
Modernized Core: Rebuilt in Pine v6 with optimized performance and compliance to TradingView standards.
TAPA is designed to filter out the noise and show what truly drives a move — the shift in control between buyers and sellers.
Best Pairing Indicators
To get maximum clarity and confluence:
Trapper Support & Resistance PRO
Helps identify key zones where momentum flips from TAPA have the most impact. A bullish crossover at a defined support level often marks an early trend reversal.
Trapper Volume Trigger
While TAPA doesn’t use volume internally, pairing it with a volume-based trigger confirms that momentum shifts have institutional participation.
Simple Moving Averages (5, 20, or 50)
Overlay short and mid-term SMAs on your chart to confirm directional bias. A bullish TAPA cross that aligns with SMA-5 crossing above SMA-20 increases reliability.
Disclaimer
This indicator is provided for educational and analytical purposes only.
It does not constitute financial advice or a recommendation to buy or sell any security.
Always conduct your own due diligence and practice proper risk management before trading any strategy.
© 2025 RAMS-offthecharts | “Read • Analyze • Mark • Snipe.”
TAPA is part of the RAMS ecosystem of tactical market tools, designed for traders who focus on precision, discipline, and momentum awareness.
Sniper Swing — Short TF (Clean Signals) [v6]📘 How to Use the Sniper Swing Indicator
1. What It Does
It looks for short-term swing breaks in price.
It uses an oscillator (RSI/Stoch) and swing pivots to confirm moves.
It gives you 3 clear signals only:
BUY → Enter long (expecting price to go up).
Gay bear → Enter short (expecting price to go down).
EXIT → Close your trade (long or short).
Candles also change color:
Green = in a BUY trade.
Red = in a Gay bear trade.
Neutral (gray/none) = no trade.
2. When to Use
Works best on short timeframes (1m–5m) for scalping/intraday.
Use on liquid markets (MES/ES, NQ, SPY, BTC, ETH).
Avoid dead hours with no volume (like overnight futures lull or midday chop).
3. How to Trade With It
A. BUY trade
Wait for a BUY triangle below the candle.
Confirm:
Candle turned green.
Price broke a recent swing high.
Oscillator shows strength (indicator does this for you).
Enter long at the close of that candle.
Place your stop-loss:
At the yellow stop line (auto trailing stop), or
Just below the last swing low.
Stay in while candles are green.
Exit when:
An orange X appears, or
Price hits your stop.
B. Gay bear (short) trade
Wait for a Gay bear triangle above the candle.
Confirm:
Candle turned red.
Price broke a recent swing low.
Oscillator shows weakness.
Enter short at the close of that candle.
Place stop-loss:
At the yellow stop line, or
Just above the last swing high.
Stay in while candles are red.
Exit on an orange X or stop hit.
4. Pro Tips for New Traders
Only take one signal at a time → don’t double dip.
Quality > Quantity: ignore weak, sideways markets. Best signals happen during trends.
Start small: trade micros (MES) or small position sizes.
Use alerts: set TradingView alerts for BUY/Gay bear/EXIT so you don’t miss setups.
Think of the indicator like a navigator: it tells you the likely path, but you’re the driver → always manage risk.
5. Quick Mental Checklist
Signal? (BUY or Gay bear triangle)
Confirmed? (candle color + swing break)
Enter? (on close)
Stop? (yellow line or swing)
Exit? (orange X or stop)
BK AK-Scope🔭 Introducing BK AK-Scope — Target Locked. Signal Acquired. 🔭
After building five precision weapons for traders, I’m proud to unveil the sixth.
BK AK-Scope — the eye of the arsenal.
This is not just an indicator. It’s an intelligence system for volatility, signal clarity, and rate-of-change dynamics — forged for elite vision in any market terrain.
🧠 Why “Scope”? And Why “AK”?
Every shooter knows: you can’t hit what you can’t see.
The Scope brings range, clarity, and target distinction. It filters motion from noise. Purpose from panic.
“AK” continues to honor the man who trained my sight — my mentor, A.K.
His discipline taught me to wait for alignment. To move with reason, not emotion.
His vision lives in every code line here.
🔬 What Is BK AK-Scope?
A Triple-Tier TSI Correlation Engine, fused with adaptive opacity logic, a volatility scoring system, and real-time signal clarity. It’s momentum dissected — by speed, depth, and rate of change.
Built to serve traders who:
Need visual hierarchy between fast, mid, and slow TSI responses.
Want adaptive fills that pulse with volatility — not static zones.
Require a volatility scoring overlay that reads the battlefield in real time.
⚙️ Core Systems: How BK AK-Scope Works
✅ Fast/Mid/Slow TSI →
Three layers of correlation: like scopes with zoom levels.
You track micro moves, mid swings, and macro flow simultaneously.
✅ Rate-of-Change Adaptive Opacity →
Momentum fills fade or flash based on speed — giving you movement density at a glance.
Bull vs. Bear zones adapt to strength. You feel the market’s pulse.
✅ Volatility Score Intelligence →
Custom algorithm measuring:
Range expansion
Rate-of-change differentials
ATR dynamics
Standard deviation pressure
All combined into a score from 0–100 with live icons:
🔥 = Extreme Heat (70+)
🧊 = Cold Zone (<30)
⚠️ = ROC Warning
• = Neutral drift
✅ Auto-Detect Volatility Modes →
Scalp = <15min
Swing = intraday/hourly
Macro = daily/weekly
Or override manually with total control.
🎯 How To Use BK AK-Scope
🔹 Trend Continuation → When all three TSI layers align in direction + volatility score climbs, ride with the trend.
🔹 Early Reversals → Opposing TSI + rapid opacity change + volatility shift = sniper reversal zone.
🔹 Consolidation Filter → Neutral fills + score < 30 = stay out, wait for signal surge.
🔹 Signal Confluence → Pair with:
• Gann fans or angles
• Fib time/price clusters
• Elliott Wave structure
• Harmonics or divergence
To isolate entry perfection.
🛡️ Why This Indicator Changes the Game
It's not just momentum. It’s TSI with depth hierarchy.
It’s not just color. It’s real-time strength visualization.
It’s not just volatility. It’s rate-weighted market intelligence.
This is market optics for the advanced trader — built for vision, clarity, and discipline.
🙏 Final Thoughts
🔹 In honor of A.K., my mentor. The man who taught me to see what others miss.
🔹 Inspired by the power of vision — because execution without clarity is chaos.
🔹 Powered by faith — because Gd alone gives sight beyond the visible.
“He gives sight to the blind and wisdom to the humble.” — Psalms 146
Every tool I build is a prayer in code — that it helps someone trade with clarity, integrity, and precision.
⚡ Zoom In. Focus Deep. Trade Clean.
BK AK-Scope — Lock on the target. See what others don’t.
🔫 Clarity is power. 🔫
Gd bless. 🙏

Enigma Sniper 369The "Enigma Sniper 369" is a custom-built Pine Script indicator designed for TradingView, tailored specifically for forex traders seeking high-probability entries during high-volatility market sessions.
Unlike generic trend-following or scalping tools, this indicator uniquely combines session-based "kill zones" (London and US sessions), momentum-based candle analysis, and an optional EMA trend filter to pinpoint liquidity grabs and reversal opportunities.
Its originality lies in its focus on liquidity hunting—identifying levels where stop losses are likely clustered (around swing highs/lows and wick midpoints)—and providing visual entry zones that are dynamically removed once price breaches them, reducing clutter and focusing on actionable signals.
The name "369" reflects the structured approach of three key components (session timing, candle logic, and trend filter) working in harmony to snipe precise entries.
What It Does
"Enigma Sniper 369" identifies potential buy and sell opportunities by drawing two types of horizontal lines on the chart during user-defined London and US
session kill zones:
Solid Lines: Mark the swing low (for buys) or swing high (for sells) of a trigger candle, indicating a potential entry point where stop losses might be clustered.
Dotted Lines: Mark the 50% level of the candle’s wick (lower wick for buys, upper wick for sells), serving as a secondary confirmation zone for entries or tighter stop-loss placement.
These lines are plotted only when specific candle conditions are met within the kill zones, and they are automatically deleted once the price crosses them, signaling that the liquidity at that level has likely been grabbed. The indicator also includes an optional EMA filter to ensure trades align with the broader trend, reducing false signals in choppy markets.
How It Works
The indicator’s logic is built on a multi-layered approach:
Kill Zone Timing: Trades are only considered during user-defined London and US session hours (e.g., London from 02:00 to 12:00 UTC, as seen in the screenshots). These sessions are known for high volatility and liquidity, making them ideal for capturing institutional moves.
Candle-Based Momentum Logic:
Buy Signal: A candle must close above its midpoint (indicating bullish momentum) and have a lower low than the previous candle (suggesting a potential liquidity grab below the previous swing low). This is expressed as close > (high + low) / 2 and low < low .
Sell Signal: A candle must close below its midpoint (bearish momentum) and have a higher high than the previous candle (indicating a potential liquidity grab above the previous swing high), expressed as close < (high + low) / 2 and high > high .
These conditions ensure the indicator targets candles that break recent structure to hunt stop losses while showing directional momentum.
Optional EMA Filter: A 50-period EMA (customizable) can be enabled to filter signals based on trend direction.
Buy signals are only generated if the EMA is trending upward (ema_value > ema_value ), and sell signals require a downward EMA trend (ema_value < ema_value ). This reduces noise by aligning entries with the broader market trend.
Liquidity Levels and Deletion Logic:
For a buy signal, a solid green line is drawn at the candle’s low, and a dotted green line at the 50% level of the lower wick (from the candle body’s bottom to the low).
For a sell signal, a solid red line is drawn at the candle’s high, and a dotted red line at the 50% level of the upper wick (from the body’s top to the high).
These lines extend to the right until the price crosses them, at which point they are deleted, indicating the liquidity at that level has been taken (e.g., stop losses triggered).
Alerts: The indicator includes alert conditions for buy and sell signals, notifying traders when a new setup is identified.
Underlying Concepts
The indicator is grounded in the concept of liquidity hunting, a strategy often employed by institutional traders. Markets frequently move to levels where stop losses are clustered—typically just beyond swing highs or lows—before reversing in the opposite direction. The "Enigma Sniper 369" targets these moves by identifying candles that break structure (e.g., a lower low or higher high) during high-volatility sessions, suggesting a potential sweep of stop losses. The 50% wick level acts as a secondary confirmation, as this midpoint often represents a zone where tighter stop losses are placed by retail traders. The optional EMA filter adds a trend-following element, ensuring entries are taken in the direction of the broader market momentum, which is particularly useful on lower timeframes like the 15-minute chart shown in the screenshots.
How to Use It
Here’s a step-by-step guide based on the provided usage example on the GBP/USD 15-minute chart:
Setup the Indicator: Add "Enigma Sniper 369" to your TradingView chart. Adjust the London and US session hours to match your timezone (e.g., London from 02:00 to 12:00 UTC, US from 13:00 to 22:00 UTC). Customize the EMA period (default 50) and line styles/colors if desired.
Identify Kill Zones: The indicator highlights the London session in light green and the US session in light purple, as seen in the screenshots. Focus on these periods for signals, as they are the most volatile and likely to produce liquidity grabs.
Wait for a Signal: Look for solid and dotted lines to appear during the kill zones:
Buy Setup: A solid green line at the swing low and a dotted green line at the 50% lower wick level indicate a potential buy. This suggests the market may have grabbed liquidity below the swing low and is now poised to move higher.
Sell Setup: A solid red line at the swing high and a dotted red line at the 50% upper wick level indicate a potential sell, suggesting liquidity was taken above the swing high.
Place Your Trade:
For a buy, set a buy limit order at the dotted green line (50% wick level), as this is a more conservative entry point. Place your stop loss just below the solid green line (swing low) to cover the full swing. For example, in the screenshots, the market retraces to the dotted line at 1.32980 after a liquidity grab below the swing low, triggering a buy limit order.
For a sell, set a sell limit order at the dotted red line, with a stop loss just above the solid red line.
Monitor Price Action: Once the price crosses a line, it is deleted, indicating the liquidity at that level has been taken. In the screenshots, after the buy limit is triggered, the market moves higher, confirming the setup. The caption notes, “The market returns and tags us in long with a buy limit,” highlighting this retracement strategy.
Additional Context: Use the indicator to identify liquidity levels that may be targeted later. For example, the screenshot notes, “If a new session is about to open I will wait for the grab liquidity to go long,” showing how the indicator can be used to anticipate future moves at session opens (e.g., London open at 1.32980).
Risk Management: Always set a stop loss below the swing low (for buys) or above the swing high (for sells) to protect against adverse moves. The 50% wick level helps tighten entries, improving the risk-reward ratio.
Practical Example
On the GBP/USD 15-minute chart, during the London session (02:00 UTC), the indicator identifies a buy setup with a solid green line at 1.32901 (swing low) and a dotted green line at 1.32980 (50% wick level). The market initially dips below the swing low, grabbing liquidity, then retraces to the dotted line, triggering a buy limit order. The price subsequently rises to 1.33404, yielding a profitable trade. The user notes, “The logic is in the last candle it provides new level to go long,” emphasizing the indicator’s ability to identify fresh levels after a liquidity sweep.
Customization Tips
Adjust the EMA period to suit your timeframe (e.g., a shorter period like 20 for faster signals on lower timeframes).
Modify the session hours to align with your broker’s timezone or specific market conditions.
Use the alert feature to get notified of new setups without constantly monitoring the chart.
Why It’s Useful for Traders
The "Enigma Sniper 369" stands out by combining session timing, momentum-based candle analysis, and liquidity hunting into a single tool. It provides clear, actionable levels for entries and stop losses, removes invalid signals dynamically, and aligns trades with high-probability market conditions. Whether you’re a scalper looking for quick moves during London open or a swing trader targeting session-based reversals, this indicator offers a structured, data-driven approach to trading.

FU Candle Indicator V3.2What the FU Candle Indicator does:
First we need to understand what FU candles are. There's bullish and bearish FU candles.
Bullish FU candles are candles that have a long wick that takes out the previous candles low, then turns around and closes above the high of the previous candle.
Bearish FU candles are candles that have a long wick that takes out the previous candles high, then turns around and closes below the low of the previous candle.
Then there's so called attempted FU candles (ATT FU)
The difference between normal FU candles and ATT FU candles is, that the ATT FU candle doesn't close above/below the high/low of the previous candle but only above the previous candle's body close.
Bullish ATT FU Candle:
Bearish ATT FU Candle:
Detection of Bullish FU Candles:
Bullish FU Candles are detected by measuring the distance between the low of the previous candle and the low of the current candle.
Then the distance between the previous candles high and the current candles close price are measured.
If current candle low < previous candle low and current candle close > previous candle high = Bullish FU Candle.
Detection of Bullish ATT FU Candles:
Bullish ATT FU Candles are detected by measuring the distance between the low of the previous candle and the low of the current candle.
Then the distance between the previous candles close or open price and the current candles close price are measured. If the previous candle closed bearish, the open price is used for comparison, if the previous candle closed bullish, the close price is used for comparison.
If current candle low < previous candle low and current candle close > previous candle open or close = Bullish ATT FU Candle.
Detection of Bearish FU Candles:
Bearish FU Candles are detected by measuring the distance between the high of the previous candle and the high of the current candle.
Then the distance between the previous candles low, AND the current candles close price are measured.
If current candle high > previous candle high, AND current candle close < previous candle low = Bearish FU Candle.
Detection of Bearish ATT FU Candles:
Bearish ATT FU Candles are detected by measuring the distance between the high of the previous candle and the high of the current candle.
Then the distance between the previous candles close or open price and the current candles close price are measured. If the previous candle closed bearish, the open price is used for comparison, if the previous candle closed bullish, the close price is used for comparison.
If current candle high > previous candle high and current candle close < previous candle open or close = Bearish ATT FU Candle.
What makes this script unique?
It shows and liquidity grab and a break of structure on a lower timeframe in one candle.
It allows to adjust the settings for the asset and timeframe you're using
The built in filters (Fractal Filter and EMA Filter) are both optional but allow to filter out certain candles and most importantly it leaves room for experimentation and optimisation to your trading style.
Input Settings and how to use them:
Bullish FU Candle Color --> This setting is to set the color for bullish FU candles.
Bearish FU Candle Color --> This setting is to set the color for bearish FU candles.
Chart --> This setting enables you to display FU's on different timeframes instead of only the current time. It's set to current timeframe by default.
Liq. Grab in Points --> This is the strength of the liquidity grab. By how many points has the current candle taken out the low/ high of the previous candle. It's set to 20 by default but it has to be adjusted to the timeframe and asset you're using.
Engulfing in Points --> This the strength of the engulfing of the previous candle. It measures the distance of the current close price to the open, close, high or low of the previous candle. It depends if the current candle is bullish or bearish and if the previous candle was bullish or bearish and if ATT FUs are enabled but this setting applies to all methods. It's set to 20 by default but you have to adjust it to the asset and timeframe you're using.
Min. Size in Points --> This setting is to filter out tiny candles. It measures the overall size of the FU candle from low to high. It's set to 20 by default but you have to adjust it to the asset and timeframe you are using.
Min. Body Size in Points --> This setting is to filter out FU candles that have a tiny body. It measures the size of the body from open to close. It's set to 20 by default but you have to adjust it to the asset and timeframe you are using.
Max. Body Size in Points --> This setting is to filter out FU candles that have a huge body. It measures the size of the body from open to close. It's set to 10000 by default but you have to adjust it to the asset and timeframe you are using.
Show ATT FU Candles --> ATT FU Candles are FU's where the body only engulfs the previous candles body but not the wick. This type of FU candles is just as valid as the strong FU's where the Body and the wick of the previous Candle is engulfed. The setting is enabled by default.
Rejection Filter --> This setting is used filter out FU candles where the opposite side rejection is stronger than the body direction of the FU. This filters out a lot of traps. It's disabled by default.
Fractal Filter --> FU's are only valid if they broke a fractal of the past x candles. This filters out some of the FU candles that are inside a range and therefore invalid. This is an optional filter and disabled by default.
EMA Filter --> FU's are only if they are above/ below the EMA. This is to filter out most of the FU candles that are inside ranges. The EMA period can be set too. This is an optional filter and enabled and EMA length set to 7 by default. You can enable it and/ or change the length of the EMA to fit your trading style.
Show Entry Lines --> The entry line setting has been changed in terms of styling. The upper and lower line has been removed. Now only the 50% retracement line of the candle body is displayed and the line type, color, strength and length can be set to keep charts as clean as possible.
Alert Timeframes --> You can select the timeframes for which you want to receive an alert if you set and alert for the FU Candle indicator. If you set an alert for the FU Candle Indicator it will send an alert for every FU candle on every selected timeframe.
TF1-TF8 --> This setting is to enable or disable alerts for timeframe 1 - timeframe 8. By default all alerts are disabled, I recommend only enabling the ones that you actually use.
Recommended use:
A bullish FU candle doesn't necessarily mean it's a long and vice versa a bearish FU candle doesn't necessarily mean it's a short. In fact, most FU candles are traps. Often times you'll see a bullish FU candle starting a bearish reversal.
Whenever you see an FU Candle check the following:
Did the FU candle take relevant liquidity?
Is the FU Candle in line with the overall bias or does it go against the bias?
Where did the FU react? Example: A bearish FU candle that reacts in a bullish FVG is a perfect long entry and vice versa.
A bullish FU candle that takes out a relevant swing high can often be a fake-out and price can immediately reverse as the next candle opens.
Timing is also very important. Usually the valid FU candles happen after a strong move to one direction during high volume times and right before or right after a new candle opens on a higher timeframe.
Examples of valid setups:
Nr. 1) Mitigation Setup
Overall bullish on the higher time frame, liquidity grab to the downside, shift in momentum, strong move to the upside left a FVG. later price comes back into the FVG and forms a FU candle --> perfect long trade targeting the opposite side of the range.
Entry either at close of the FU or at the 50% retracement.
Nr. 2) Trap Setup
Clear bullish trend respecting the trend line, bearish FU candle forms but it didn't take any relevant liquidity to the upside. Only internal range liquidity. Perfect long entry using a buy limit below the lower wick of the FU candle with the SL below the nearest low.
Nr. 3) Liquidity Grab Setup
Bearish trend, price comes up aggressively and takes out a high and forms an FU Candle. Market entry short at close of the FU candle or at the 50% retracement of the FU candle or by putting a limit order right above the wick of the candle that follows the FU candle, targeting the opposite side of the range.
Nr. 4) Fake Breakout Setup
Price takes out a significant HTF low, then makes at least 2 BOS on the LTF and forms an Order Block or leaves an FVG. Price forms a bearish U that fails to close below the FVG or Orderblock.
Market entry long at the close of the bearish FU targeting the opposite side of the range. Vice versa for shorts. In simple terms: Bullish FUs at the top of the range and bearish FUs at the bottom of the range are usually always traps.
Sometimes price takes out the high/low of a trap FU before reversing aggressively so you can also have a limit order below the low of the bearish FU or above the high of a bullish FU in this case. But you risk missing the trade.
Entry Methods:
Entry Type 1) Market Entry at the close of the FU candle. --> Never miss a trade, not the best RRR.
Entry Type 2 Limit Entry at the 50% retracement of the body of the FU candle. --> Miss some of the trades but better RRR.
Entry Type 3 Limit order below the wick of the candle that follows the FU candle. --> Miss quite a lot of trades but by far best RRR.
Why this is a closed source script:
The source code of this script is not open because I have spent several years of my life developing it and I use it in all my trading bots.
Also I'm open for feedback and will modify/ update the script for free if I get input that can make it better.
For questions, please reach out via DM or check out my youtube channel. I have several videos explaining in detail how I use these candles, which are valid and which aren't.

EMA Crossover Strategy with RSI Filter BIGTIME 5mThis script essentially creates a trading strategy that goes long when there is an EMA crossover, but only if the RSI is below a certain overbought level. It goes short when there is an EMA crossunder, but only if the RSI is above a certain oversold level. The moving averages are plotted on the chart for visual reference.
SCALPING 5m
Pairs: BIGTIME/USDT--- API3/USDT---BAKE/USDT--- ZIL/USDT
Moving Average Trend Sniper [ChartPrime]Today we introducing the Moving Average Trend Sniper (MATS), a unique and powerful multi faceted tool. This moving average is designed to adapt to the ever-changing market conditions. MATS provides the ideal solution for traders looking to capitalize on market trends while accurately identifying support and resistance levels.
Why MATS?
MATS was developed with the trader in mind, focusing on the key factors crucial for a successful trading strategy - trend following, support, and resistance. Its unique moving average calculation not only accounts for market volatility and momentum but also provides a stable yet adaptable foundation for your trading decisions.
MATS employs a range of mathematical techniques to provide a precise and adaptive moving average, offering traders a more effective tool for analyzing market trends and identifying support and resistance levels. One of the primary distinctions of MATS is its use of delta, the change in market conditions, to update the moving average based on the trend's strength. This delta-based updating allows the moving average to adapt to market fluctuations and helps traders make more informed decisions when entering or exiting positions. MATS also focuses on the highs in a downtrend and the lows in an uptrend to provide more reliable support and resistance. By taking these crucial market points into consideration, the moving average delivers a comprehensive and accurate insight into the market's behavior and allows traders to make more precise predictions.
MATS leverages trigonometry to determine the trend angle for the moving average. By calculating this angle, MATS can efficiently pick the correct source (either the high or the low) to provide the best support and resistance analysis. This innovative use of trigonometry ensures that the moving average is better suited to the current market conditions and provides traders with a dynamic yet stable tool to support their trading decisions.
Settings:
Length: The length input for MATS plays a crucial role in determining how responsive the moving average will be to changes in market conditions. A shorter length setting results in a more reactive moving average that closely follows price movements, whereas a longer length setting generates a smoother, less volatile average. By adjusting the length setting, traders can fine-tune the sensitivity of MATS to align with their specific trading strategies and needs.
Glow: MATS offers a customizable and visually engaging display that helps traders effectively identify market trends. The "glow" effect surrounding support and resistance levels, available as an optional feature, enables users to assess these crucial areas more easily.
Example use cases:
In the screenshot below you can see the MATS acting as both a classical support and resistance while the glow and coloring is helped to provide a more classical trend following visualization to a trader. This duel functionality can help in re-entering during market retracements.

Intraday rejection levels3 supports, 3 resistances and an equilibrium price per day displayed at 9am (GMT+2), calculated on the dynamic study of the market at its opening over a certain period that we could qualify as "first opening interventions"
Method: We are interested in the first reaction of the market when it discovers one of the levels.
The red and green zones (from levels R2 to R3) are the zones of rejections/daily overextensions with large RRs of which we will appreciate a rejection for the US opening (where the zones are more opaque, the Killzone!), because the session US is known to either accompany the London session or completely break the trend.
Equilibrium, on the other hand, is a retest zone that can be traded in several directions, ideal for capturing the first retracement / retest of a recently broken structure:
Activate "EL" to display an ideally early morning rejection area so levels can be scalped! They correspond to opportunistic areas above the high and below the low of a custom Asian session ignoring part of the London open - which I consider to be liquidity :):
FIRST SETUP: Confluence R1/R2 with the EL!
SECOND SETUP: The price does not frequent the R2/R3 zone during London but only during the killzone:
Anticipate rejection zones, put them in confluence to find the best opportunity!
Tips:
I'm only interested in the first reaction on these levels
You can measure the difference between R1 and EQ: on average on the EURUSD it must be 20 to 30 pips! Apart from these values, I deduce that the market is unbalanced: I lower my risk on my scalps and I am more cautious.
It is possible to use the previous day's levels to look for correlations
Ideally, the Asia range Custom should not take the high/low of the day before (see "LIquidity maps" indicator on our profile for optimal use)
As an option you can display the standard pivot, and activate the "crypto" mode to be able to use it on your favorite crypto :)

Market SniperWelcome to Market Sniper!
This indicator attempts to catch market tops and bottoms based on the market being extremely extended in its respectful direction. It combines a Triple Stochastic RSI as well as MACD convergences to strengthen the signal. A standard RSI can also be shown if needed.
Highlighted green means that you are moving towards a potential bottom.
Highlighted red means that you are moving towards a potential top.
An arrow will signify that the direction of momentum has changed.
If you see the same colored bar below the highlighted area, price is converging; strengthening the original signal.
This indicator is extremely user-configurable. Just take a look at the settings as they are self explanatory.

EMA+RSI Pump & Drop Swing Sniper (SL+TP) - StrategyThis is the strategy version of the 'EMA-RSI-Pump-Drop-Swing-Sniper-With-Alerts':
Some additions with this strategy:
~Added Stop loss & Take profit control. In Settings > Inputs if the Stop Loss is at .051 that means it's 5.1% and the Take Profit at .096 is 9.6%. If you wish to remove the TP and SL just change the value to 1.00 and it would be the same as it being 100% TP and SL which is likely to never be hit.
~Added Backtesting by changing the month/date/year in Settings > Inputs
~Added a 2nd EMA line to assist with the long entry signals. I only use this for long entry & exits, though you could use the long exits as Short entries too. I just personally don't do short trading on Bitcoin.
This is using an EMA and RSI with slightly modified settings to give good entry and exit points while looking at Bitcoin. I use this on a 1-hour and 4-hour chart and with other indicators to find good positions to enter a trade or exit if things are turning red.
It's important to know this strategy was made as a request by another user that was using the indicator version. I don't use this as a trading strategy by itself, I use the visuals it gives as a confirmation with other indicators to find the best possible entry and exit positions.
If you click on the EMA line it will color the bars of the chart based on if they are above or below the EMA - This is just visually helpful for me to see the active trend.
Make sure you hover over or click on the EMA line to see the colors of the candles change - it's not visible by default or without doing this.

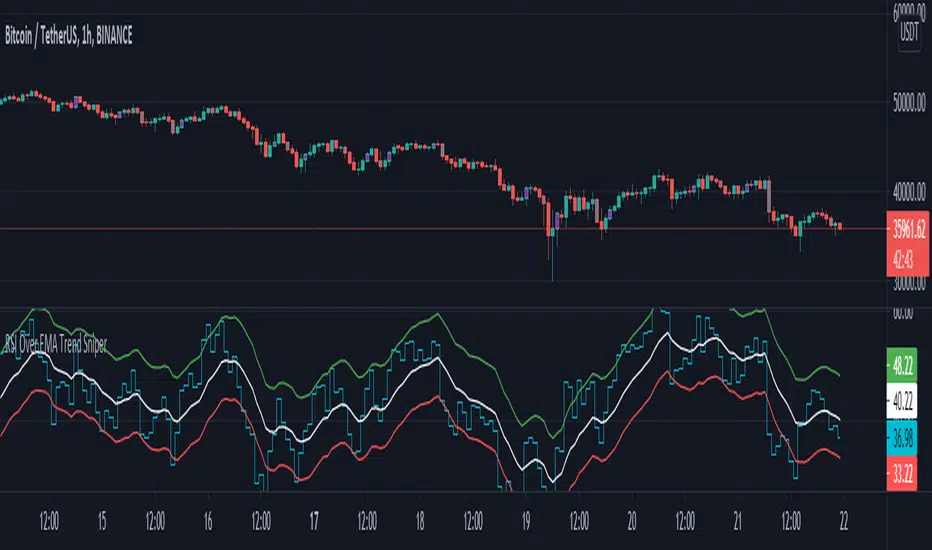
RSI Over EMA Trend SniperThis is an indicator that uses horizontal EMA lines with a RSI line on top of it to provide optimal entry and exit positions for trading crypto.
How to use:
If the Aqua(RSI) line passes upwards on the red heading to the white - it's heading towards a good BUY signal. To be safe you wait until it passes above the white line, then BUY LONG. Another signal to buy long is when the Aqua line passes above the white and green lines.
Selling is essentially the opposite, if the Aqua line is passing down from the green or white lines, then it's time to sell and exit your trade.
This indicator works well as a confirmation, and it's nice to have multiple confirmations, so it's suggested you use this with other indicators that can provide entry and exit confirmations.
EMA+RSI Pump & Drop Swing Sniper (With Alerts)This is using an EMA and RSI with slightly modified settings to give good entry and exit points while looking at Bitcoin. I use this on a 4-hour chart and with other indicators to find good positions to enter a trade or exit if things are turning red.
If you click on the EMA line it will color the bars of the chart based on if they are above or below the EMA - This is just visually helpful for me to see the active trend.
Make sure you hover over or click on the EMA line to see the colors of the candles change - it's not visible by default or without doing this.

Fish Sniper - TrendicatorThis is a modified version of the Fisher Indicator.
How to use:
If you see the white stream crossing up or down on the dotted/dashed hlines then you are seeing the price and trend heading that direction. The green bars indicate an optimal long position, and the red bars indicate a short or an exit position. The green and red bars show when the white stream passes just above or below the ZERO line (dashed Aqua line).
While entering/exiting on the green/red bars generally a good strategy, it's good to look at the bigger picture and see how far the white stream has traveled to reach the ZERO line. You can often avoid trading on a sideways market if you notice smaller movements on the white stream.
This indicator will also draw a grey candle on your chart to signal it's time to exit a long trade and it will draw a purple candle when it's time to enter a long.
I mostly use this indicator as an additional confirmation to enter or exit an open position, it's worked well for me in avoiding some big drops in my crypto trading and entering early on some nice uptrends.

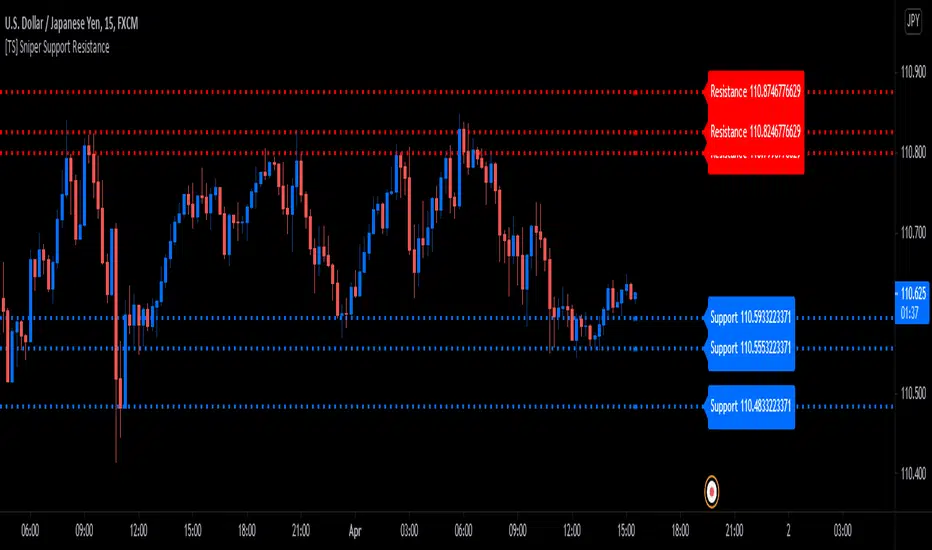
[TS] Sniper Support ResistanceThis script is our Pivot Points and ATR based Support and Resistance indicator
-A Support is a price level where a downtrend can be expected to pause due to a concentration of demand or buying interest. As the price of assets or securities drops, demand for the shares increases, thus forming the support line. Meanwhile, A resistance zone arises due to selling interest when prices have increased.
- By increasing the "S/R Multiplier" input, the user can change the distance from the S/R swing points
- By increasing the "S/R Length" input, the user can adjust the S/R Swing Points lookback length (pivot detection range)
Uncle Eagle Indicator Suite - Eagle Sniper** Uncle Eagle Indicator Suite - Eagle Sniper **
An elite sniper is trained to both focus on the moment as well as see the big picture. Their selective approach gives them the edge, as they can see through the visual noise to hit their target. Uncle Eagle has designed the Eagle Sniper to do just that! Simplify your TA and remove the need for LOTS of cluttering Indicators that tell you different things. Receive a simple "Long/Short" signal when multiple indicators start showing a clear direction that an individual might be able to see through all the visual indicators needed.
Successful traders are patient and select their trades in a careful and calculated manner. Our Eagle Sniper allows you to take that patience and utilize it to your advantage!
The Eagle Sniper will help any new, or experienced trader determine their entry and exit points concisely, and it marries perfectly with our Suite of products!
Adjustable controls for Oscillators
Adjustable ATR for long term or short-term snipes
Highlight the trend with Green/Red lines
Filter Overbought/Oversold snipes to avoid certain movements
Combines perfectly with all other Uncle Eagle Indicators
Know when to get in or get out, no matter the Bull or Bear nature!
TREND SNIPER (Final Version)/ This script calculates the daily resistance and support levels. The entry is when the close breaks these levels.
// Then it sets 4 exit lines, if the backtraces these lines you've got your normal exit.
// If the close crosses the TP you've got your TP exit. And if the close crosses the SL you've got your SL exit.
// This is the good part --> If the close crosses the first line the SL get's raised to the entry level.
// This way you cut down on the SL losses and turn a lot of SL trades into (almost) break even trades.
// You can adjust the resistance and support levels to remove the 'little wick entries', this raises the profitability.
// You can also choose the security resolution. I recommend using a higher timeframe than the chart resolution.
// The exit source is also changeable. The HLC3 works best for me, but you can try others if you want.
I could really use some feedback. I want the resistance and support levels to remain on the same position when in trade. But it sometimes changes mid trade.
If you know how to fix this I will be forever grateful. If you have any feedback don't hesitate to give it to me straight. Thanks in advance and have a wonderful day :)

Sniper RSniper entry can be used on any time frame and is a continuous process of possible trend changing signals based on pure price action.
This script is a depiction of a change in trend and not a recommendation from the publisher. Do consult your financial advisor if you need to get into a trade. It is not a recommendation to trade and needs to be used as a reference along with other analysis that you may already be doing currently.
Sniper entry is a graphical expression in terms of a trend change based on price action only. You may want to combine this with other indicators to bring out best results as per need.
Sniper entry can be used on a multi time frame and is not limited to one trading day and can continue into the next day to depict a change in trend.
Note: This is not a recommendation of a buy or a sell but a study of most recent trends depending on time frame selected. Please do contact your financial advisor before placing the trade.
Trade smart, trade right.
Combo Backtest 123 Reversal & FX Sniper: T3-CCI This is combo strategies for get a cumulative signal.
First strategy
This System was created from the Book "How I Tripled My Money In The
Futures Market" by Ulf Jensen, Page 183. This is reverse type of strategies.
The strategy buys at market, if close price is higher than the previous close
during 2 days and the meaning of 9-days Stochastic Slow Oscillator is lower than 50.
The strategy sells at market, if close price is lower than the previous close price
during 2 days and the meaning of 9-days Stochastic Fast Oscillator is higher than 50.
Second strategy
This simple indicator gives you a lot of useful information - when to enter, when to exit
and how to reduce risks by entering a trade on a double confirmed signal.
You can use in the xPrice any series: Open, High, Low, Close, HL2, HLC3, OHLC4 and ect...
WARNING:
- For purpose educate only
- This script to change bars colors.

Combo Strategy 123 Reversal & FX Sniper: T3-CCI This is combo strategies for get a cumulative signal.
First strategy
This System was created from the Book "How I Tripled My Money In The
Futures Market" by Ulf Jensen, Page 183. This is reverse type of strategies.
The strategy buys at market, if close price is higher than the previous close
during 2 days and the meaning of 9-days Stochastic Slow Oscillator is lower than 50.
The strategy sells at market, if close price is lower than the previous close price
during 2 days and the meaning of 9-days Stochastic Fast Oscillator is higher than 50.
Second strategy
This simple indicator gives you a lot of useful information - when to enter, when to exit
and how to reduce risks by entering a trade on a double confirmed signal.
You can use in the xPrice any series: Open, High, Low, Close, HL2, HLC3, OHLC4 and ect...
WARNING:
- For purpose educate only
- This script to change bars colors.

PS ATR VariantProfit Sniper ATR Variant v0.1 is completely new but based off of the Profit Sniper 3.0 you know and love :
The original SNIPER operates off two timeframes in parallel, your Trend Timeframe (Higher Timeframe concerned with identifying market up & down trends), and your Trade Timeframe (Lower Timeframe to actually trade Longs & Shorts in).
Within each timeframe, you can tailor your preference for waiting for either Stochastic Ribbon cross only, or Ribbon Cross followed by Chande Confirmation for that additional market structure confidence. Flags & Alerts will then provide you with numerous trading Long & Short trading opportunities per day.
You also have the option to trade with trend so the indicator will automatically flag & alert only Shorts in a Short trend, and Longs in a Long Trend.
This version has the ATR (Average True Range) Indicator incorporated, to give trend direction (only tke longs in long trend and vice versa) and some additional safety features using ATR values.
For access please send a DM
With some extra features. such as ATR ( Average True Range ) trade entry which measures market volatility by analysing the range of asset price during a specified period.
