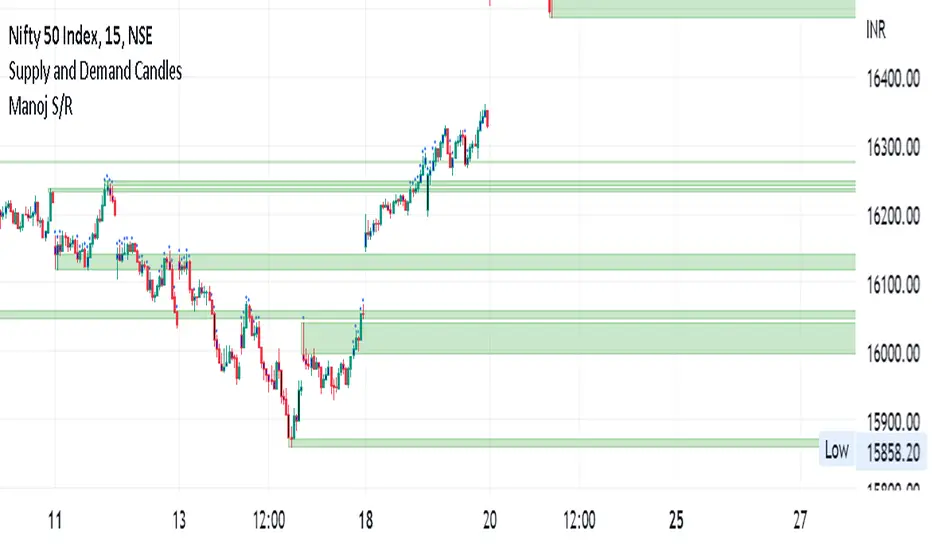
Manoj S/Rsupply and demand zone
supply and demand zone
supply and demand zone
supply and demand zone
Support and Resistance
+ Multi-timeframe Multiple Moving Average LinesThis is a pretty simple script that plots lines for various moving averages (what I think are the most commonly used across all markets) of varying lengths of timeframes of the user's choosing. Timeframes range from 5 minutes up to one month, so regardless if you're a scalper or a swing trader there should be something here for you.
There are 8 lines (that can be turned on/off individually), which may seem like a lot, but if you use two averages and want to display four different timeframes for each, you can do that. The nice thing is that because the lines start plotting from the current bar they won't clutter up the screen. And obviously having moving averages from different timeframes on your chart makes price action more difficult to read (I mean sure, you can make them invisible, but who wants to do that all the time).
For each line there are two labels. One with the moving average type, and the other with its specific timeframe. I can't include the moving average length because it's not a string input. If anyone has a workaround for this, let me know, otherwise I would simply recommend setting different colors depending on the length, or if you only use one or two lengths and one or two moving averages this shouldn't be an issue. I had to use two labels because for the label text I couldn't include more than one string input, this is why there is an input for the 'moving average type label distance.'' You will want to adjust this depending on if you are trading crypto, futures, or forex because in some cases there may still be label overlap.
Pretty much everything else is self-explanatory.
I've added alerts. I might need to modify them if I can, because it would be nice for them to state the name and timeframe of the moving average. But I think this will do for now.
Enjoy!


nifty gann & 100 levelsnifty gannlevels with 100 points defference
gann levels with manual entry of cuurent gann level
manual entry of diffeence between two gann levels

Visible Range Mean Deviation Histogram [LuxAlgo]This script displays a histogram from the mean and standard deviation of the visible price values on the chart. Bin counting is done relative to high/low prices instead of counting the price values within each bin, returning a smoother histogram as a result.
Settings
Bins Per Side: Number of bins computed above and below the price mean
Deviation Multiplier: Standard deviation multiplier
Style
Relative: Determines whether the bins length is relative to the maximum bin count, with a length controlled with the width settings to the left.
Bin Colors: Bin/POC Lines colors
Show POCs: Shows point of controls
Usage
Histograms are generally used to estimate the underlying distribution of a series of observations, their construction is generally done taking into account the overall price range.
The proposed histogram construct N intervals above*below the mean of the visible price, with each interval having a size of: σ × Mult / N , where σ is the standard deviation and N the number of Bins per side and is determined by the user. The standard deviation multipliers are highlighted at the left side of each bin.
A high bin count reflects a higher series of observations laying within that specific interval, this can be useful to highlight ranging price areas.
POCs highlight the most significant bins and can be used as potential support/resistances.

VWAP + EMA Analysis [Joshlo]Overview and Use Case
VWAP Analysis gives the possibility to combine multiple time frames of VWAP along with a triplet of exponential moving averages. This can provide insight into potential scalp, swing and longer term trades, depending on your time frame. The use of this indicator with it's setup is based off the the Scalp Setup Alerts provided by Roensch Capital.
The primary use for this script is to help with intraday scalp set ups. Using the Daily VWAP, turned on by default, we can look for price to respect and bounce from one of the VWAP lines (support or resistance) back toward equilibrium, we can also look for price to bounce off of equilibrium and move back toward VWAP support or resistance.
The chart attached shows AMD bouncing off of the Daily time frame VWAP Resistance level multiple times (see yellow boxes), often with confirmation given by an increase in volume which is often far higher than the average volume. In many of these cases a short position could've been opened or put option could have been placed with a profitable outcome.
Every line projected onto the chart via this indicator has the potential to create support or resistance as well as causing 'hang ups', meaning price loses it's momentum, slows down and hangs out in the particular area. This is shown on the chart within the green box.
Chart walkthrough - See attached chart
After a rejection off of the Daily VWAP Resistance line (depicted by the white circle), price starts to move back toward Daily VWAP Equilibrium. In order to reach this line, price needs to move through the 20EMA (white) and 50EMA (purple), the Weekly VWAP Resistance (red circles) and the 200EMA (orange). All of these lines are a part of this single indicator.
The 20EMA seems to offer little resistance but follows the price on it's move, offering some resistance to a volatile move upward. Initially upon contact with the 50EMA, price hangs up and bounces above and below the line whilst finding support on the Weekly VWAP Resistance at the same time. This causes a 'hang up' or sideways movement for around 20 minutes of trading. A potential trade may have entered at the white circle with a VWAP Resistance rejection and exited upon contact with the 50EMA in anticipation of multiple EMAs and support / resistance lines converging which is known to cause price movement to slow.
Eventually with an increase in volume, price breaks below the 20EMA (white), 50EMA (purple) and the Weekly VWAP Resistance level (red circles). Price then finds support on the 200EMA (orange), although there was potential for the price to fall to the Daily VWAP Equilibrium (solid blue). As the Red VWAP lines tend to act more often as resistance as opposed to support (price is rarely above these lines for extended periods), the trade from earlier may have profited more by awaiting contact with the 200EMA before exiting, taking the assumption that the Weekly VWAP Resistance was more likely to act as resistance than support.
A period of consolidation in the green box, around the Weekly VWAP Resistance, 20EMA, 50EMA and with support from the 200EMA eventually resulted in another break out where the price came back up to the Daily VWAP Resistance. Prior to the end of this trading day, there were two more opportunities for scalp setups based off of the price showing consistent rejections off the Daily VWAP Resistance back down to the 50EMA.
In the final example, price breaks above the Daily VWAP Resistance but quickly rejects off of the Monthly VWAP Resistance. For examples where the VWAP Resistance or Support or broken, it can help to look at an indicator such as the RSI to look for bullish divergence or bearish divergence.
Just as this example shows bounces and rejection off of VWAP Resistance, the same applies around the Equilibrium and Support VWAP lines.
The perfect scenario would be to find a ticker where there has already been two or three bounces off of one of these levels, with the goal of taking the trade on the next bounce and either using a percentage price target or technical price target based off of the EMAs or VWAP lines. If there are EMAs close in the direction you want to take the trade, there is a higher chance of hang ups and reversals, so a clear run is the more desired trade set up.
You can also look for these indicator lines to stack up in order to form a stronger support and resistance. For example the 200EMA and Daily VWAP Equilibrium being close to each other may suggest it would take more of an effort to break both of these levels, but one by itself may break more easily.
Indicator Setup
In the settings for the indicator, almost everything you might want to change can be done from the Input tab.
The three options for VWAP (daily, weekly and monthly) allow for analysis on multiple time frames. Daily is turned on as standard.
Standard Deviation Multiplier is set to 2 as standard, this effects the distance of the VWAP support and resistance from the equilibrium line. This seems to be a level that works well with finding support and resistance lines, however if there is excessively high or low volume, occasionally the lines can be thrown off. You can adjust this level if required to find a 'sweet spot' where price likes to reject or find support.
The colors for all VWAPs can be adjusted via the Inputs tab, however if you'd like to change the type of line these are depicted as, this can be done from the Styles tab.
The 3 EMAs (20, 50 and 200) can be toggled on or off and also have their color changed. The style of the lines can be adjusted from with the Styles tab if required.

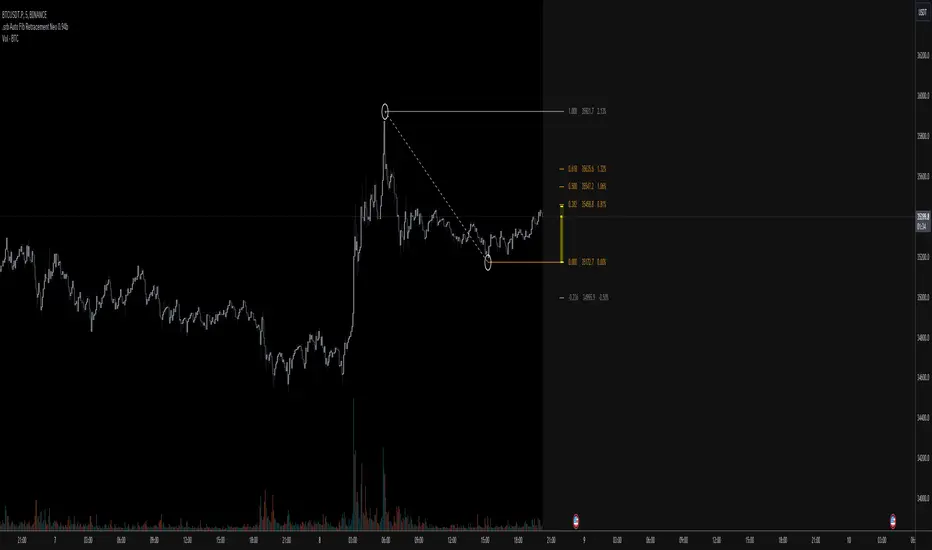
.srb suite Fib Retracement neoSPECIAL TOOLS - Auto Fibonacci Retracement neo - New GUI
designed for use with open-source indicator
'built-in auto FBR ' has been re-born
It shows - retracement Max top/ min bottom ; for higher visibility
It shows - current retracement position ; for higher visibility
The display of the Fib position that exceeds the regular range is auto-determined according to the price.
Fib.Retracement core is from tradingview built-in FBR ---> upgrade new-type GUI, and performance tuned.
Structured zigzag support&resistance [LM]Hello Traders,
I would like to introduce you Structured zigzag support&resistance. It is based on the ZigZag semafor script made by DevLucem so shout out to him
The indicator is used to spot future multi-level Supports and Resistance zones. It is also useful to spot HL or LL or HH or LH zones
I's the same zigzag indicator as my other zigzag indicator with highlight on diagonal lines(highs and lows are automatically classified and also new types of diagonal lines that connects low or highs and extends to right are drawn )
It has two settings:
Fist is to control horizontal lines and zigzag setting
Second is to control diagonal lines
I hope you will enjoy it as I enjoyed to write it.
Lukas

Titans Empirical LevelsThis indicator marks key pivot levels across two higher timeframes, longer term, and medium term.
When a pivot high or low is detected at the higher timeframe, a line is plotted in the future.
The user may select timeframes and pivot sensitivities in the indicator settings.
As no calculation is involved, the levels are identified purely from historical precedent.
Overlapping lines could imply strength of recent support/resistance at that level.
This indicator should be used in combination with other indicators.
The user is advised to use this indicator at his own risk.

MACD S/R signal indicatorI've based the script on my MACDs/r indicator.
I think it works better on higher timeframes, this is just an experiment, please feel free to modify it.
I have been testing it with parabolic SARS to know when to exit the trades.
Exit condition: if I'm in a log position and the price is below the last bearish parabolic SARS dot I exit the trade and the opposite for shorts
DISCLAIMER: Is just an experiment and I haven't test it with real money, be careful
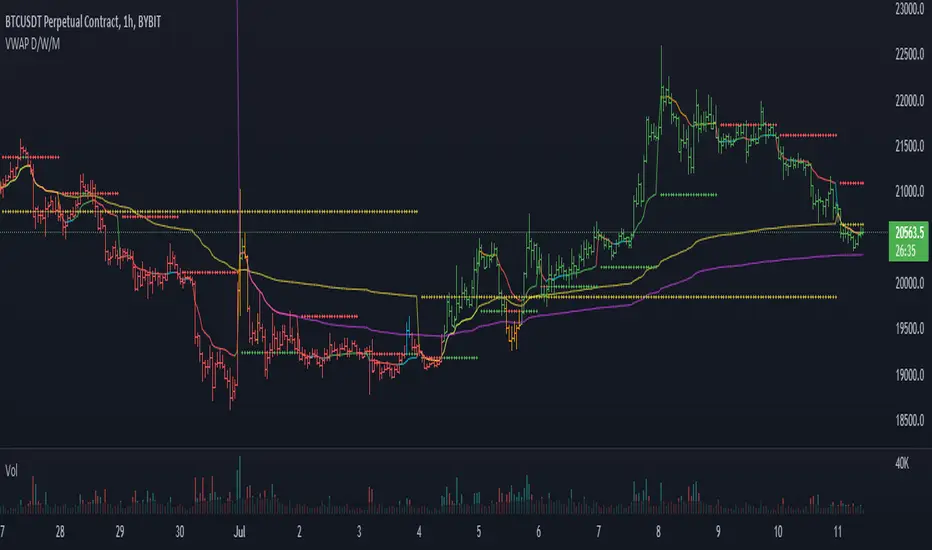
VWAP and previous VWAP for Support & Resistance for D W MI overhauled my old multi timeframe VWAP script to make the VWAP OC-Check work for all timeframes. Now only one function is used to calculate the 3 preset VWAPs.
Previous VWAPS = the price where the last session closed sometimes work as Support and Resistance.
The OC-Check Mode theory examines if the VWAP from the Open is above or below the VWAP from Close
and if price is above or below normal VWAP (HLC3).
This way we have 4 states:
Red = Strong Downtrend
Orange = Weak Downtrend
Blue = Weak Uptrend
Green = Strong Uptrend
As always it is just a theory - nothing is set in stone regarding any indicator.
Price Pivots for NSE Index & F&O StocksPrice Pivots for NSE Index & F&O Stocks
What is this Indicator?
• This indicator calculates the price range a Stock or Index can move in a Day, Week or Month.
Advantages of this Indicator
• This is a Leading indicator, not Dynamic or Repaint.
• Helps to identify the tight range of price movement.
• Can easily identify the Options strike price.
• The levels are more reliable and authentic than Gann Square of 9 Levels.
• Develops a discipline in placing Targets.
Disadvantages of this Indicator
• The indicator is specifically made for National Stock Exchange of India (NSE) listed index and stocks.
• The indicator is calculated only for index NIFTY, BANKNIFTY, FINNIFTY, MIDCPNIFTY and Stocks listed in Futures and Options.
• The indicator shows nothing for other indexes and stocks other than above mentioned.
• The data need to be entered manually.
• The data need to be updated manually when the F&O listed stocks are updated.
Who to use?
Highly beneficial for Day Traders, it can be used for Swing and Positions as well.
What timeframe to use?
• Any timeframe.
• The highlighted levels in Red and Green will not show correct levels in 1 minute timeframe.
• 5min is recommended for Day Traders.
When to use?
• Wait for proper swing to form.
• Recommended to avoid 1st 1 hour or market open, that is 9.15am to 10.15 or 10.30am.
• Within this time a proper swing will be formed.
How to use?
Entry
• Enter when the Price reach closer to the Blue line.
• Enter Long when the Price takes a pullback or breakout at the Red lines.
Exit
• Exit position when the Price reach closer to the Red lines in Long positions.
What are the Lines?
Gray Lines:
• Every lines with price labels are the Strike Prices in the Option Chain from NSE website.
• Price moves from 1 Strike Price level to another.
• The dashed lines are average levels of 2 Strike Prices.
Red & Green Lines:
• The Red and Green Lines will appear only after the first 1 hour.
• The levels are calculated based on the 1st 1 hour.
• Red Lines are important Resistance levels, these are strong Bearish reversal points. It is also a breakout level, this need to be figured out from the past levels, trend, percentage change and consolidation.
• Green Lines are important Support levels, these are strong Bullish reversal points. It is also a breakdown level, this need to be figured out from the past levels, trend, percentage change and consolidation.
What are the Labels?
• First Number: Price of that level.
• Numbers in (): Percentage change and Change of price from LTP(Last Traded Price) to that Level.
How to use?
Entry:
• Enter when price is closer to the Red or Green lines.
• Enter after considering previous Swing and Trend.
• Note the 50% of previous Swing.
• Enter Short when price reverse from each level.
• If 50% of swing and the pivot level is closer it can be a good entry.
Exit:
• Use the logic of Entry, each level can be a target.
• Exit when price is closer to the Red or Green lines.
Indicator Menu
Source
• Custom: Enter the price manually after choosing the Source as Custom to show the Pivots at that price.
• LTP: Pivot is calculated based on Last Traded Price.
• Day Open: Pivot is calculated based on current day opening price.
• PD Close: Pivot is calculated based on previous day closing price.
• PD HL2: Pivot is calculated based on previous day average of High and Low.
• PD HLC3: Pivot is calculated based on previous day average of High, Low and Close.
"Time (IST) (Vertical)"
• This is a marker of every 1 hour.
• Usually major price movement happen between previous day last 1 hour (2:15 pm) to today first 1 hour (10:15 pm).
• Two swings can happen between first 2 hour of current day.
• At the end of the day last 1 hour from 2.15 pm another important movement will happen.
• Usually rest of the time won't show any interesting movement.
To the Users
• Certain symbols may show the levels as a single line. For such symbols choose a different Source or Timeframe from the indicator menu.
• Please inform if any of the Symbol's price levels don't react to the pivots, include the Symbol a well.
• Also inform if you notice any wrong values, errors or abnormal behavior in the indicator.
• Feel free to suggest or adding new features and options.
General Tips
• It is good if Stock trend is same as that of NIFTY trend.
• Lots of indicators creates lots of confusion.
• Keep the chart simple and clean.
• Buy Low and Sell High.
• Master averages or 50%.
• Previous Swing High and Swing Low are crucial.

Fibonacci Pivot Points UltimateA better version of the Fibonacci Pivot Points . I added 100, 138, 161 and 200 support/resistance pivots , lookback function and now you can use daily/weekly/monthly/yearly fibonacci pivot points .

Trendlines Boll Ichi S1 by GammaprodI. How to use this indicator :
------------------------------
I.1. Set your teadingview theme to dark theme.
I.2. Gammaprod indicator is valid for forex, stock and but more valid for crypto.
I.3. Use three timeframe for more validation (choose between those, that fit to your trading style) :
- Timeframe 1m, 5m, and 15m for Scalping
- Timeframe 30m, 1h and 4h for Intraday
- Timeframe 4h, 1D and 1W for Swing Trading
I.4 Always use THREE INDICATORS FROM GAMMAPROD, those three indicators is back to back each other, by the way, I only made those three indicators only (for now) :
- Trendlines Boll Ichi S1 by Gammaprod
- MACD Volume S2 by Gammaprod
- Stoch RSI Divs Zone S2 by Gammaprod
============================================================================
II. How to setting :
--------------------
II.1. Trendlines Boll Ichi Crypto by Gammaprod
II.1.A. Support and Resistance
- Well if you familiar with this indicator you can add it, but recommended for Timeframe 30m or more
II.1.B. Trendlines Primary or Trendlines Secondary
- Timeframe 1m you DON'T NEED Trendlines Primary or Trendlines Secondary
- Timeframe 5m you DON'T NEED Trendlines Secondary, but you CAN ADD Trendlines Primary if you fell it helpful (for me, it is helpful to find where the candles start or the end trend or a consolidation or where the candles will surpass a resistance or a support).
- Timeframe 15m you DON'T NEED Trendlines Secondary, DEFENITELY add Trendlines Primary it will help to find where the candles stop or a consolidation or where the candles will surpass a resistance or a support).
- Timeframe 30m or more, DEFENITELY NEED BOTH Trendlines Primary and Secondary Trendlines, it will help to find where the candle stop or consolidation or where the candle will surpass a resistance or support).
II.1.C. Bollinger, Ichimoku Cloud and Lagging Span
- Please DON'T CHANGE IT at all, it's really helpful to know when and where to make an entry decesion or a trend or a consolidation, if you don't understand how to read it, you better to learn it first (on "how to read" section and "How to OPEN position" the section below)
II.2. Stoch RSI Divs Zone Crypto by Gammaprod (DON'T CHANGE IT)
II.3. MACD Volume Crypto by Gammaprod (DON'T CHANGE IT)
============================================================================
III. How to read :
------------------
III.1. Sell or Buy Priority :
III.1.A. Sell Priority
- Color background on macd and stoch rsi is pink or purple sell is the priority, (if you're not sure to buy, just wait until the best moment to sell)
III.1.B. Buy Priority
- Color background on macd and stoch rsi Teal or light green buy is the priority, (if you're not sure to sell, just wait until the best moment to buy)
III.1.C. Indecision / Golden Moment
- Color background on stoch rsi yellow is indecision / golden moment of reversal pattern (wait until it formed background only on Stoch RSI), please be careful at this moment.
III.2. Trend / Consolidation :
III.2.A. BULLISH trend
- When Stoch RSI and MACD have teal or light green background that's means BULLISH trend, better to confirm by the candle is above green cloud and lagging span (red line) is also above the candle.
III.2.B. BEARISH trend
- When Stoch RSI and MACD have the Pink or purple background that's means BEARISH trend, better to confirm by the candle is above purple cloud and lagging span (red line) is also below the candle.
III.2.C. CONSOLIDATION
- When Stoch RSI have the mix background that's means CONSOLIDATION, better to confirm by the candle is in or near to green / purple cloud and lagging span (red line) is also on the candle.
III.3. Special Mark
III.3.A. Ideal Bullish :
- Near line 20 and green / teal background = When Stoch RSI have the char R / H on lime color label, that's means divergence or hidden divergence for buy position, if you not see this label that's means just a standard confirmation for buy
III.3.B. Not an Ideal Bullish :
- Near line 80 and green / teal background = if this happens make sure you know what happen, it could be a false signal or bullish continual pattern
III.3.C. Ideal Bearish :
- Near line 80 and pink / purple background = When Stoch RSI have the char R / H on lime color label, that's means divergence or hidden divergence for buy position, if you not see this label that's means just a standard confirmation for sell position.
III.3.D. Not an Ideal Bearish:
- Near line 20 and pink / purple background = if this happens make sure you know what happen, it could be a false signal or bearish continual pattern
III.3.E. The Beginning of Reversal (from BEARISH to BULLISH) :
- When Stoch RSI line shaping GREEN position is near 20.
- MACD lines still PINK, position lines is UNDER the HISTOGRAM, but the HISTOGRAM start to SHAPE FALL PINK (light pink) and the BACKGROUND still PINK / PURPLE.
- Position CANDLES NEAR BLUE line, NEAR PURPLE CLOUD, and lagging span (red line) STILL ON the area candle. (it used to be confirmed with the golden moment).
III.3.F. The Beginning of Reversal (from BULLISH to BEARISH) :
- When Stoch RSI line shaping PINK position is near 80.
- MACD lines still GREEN, position lines is ABOVE the HISTOGRAM, but the HISTOGRAM start to SHAPE FALL GREEN (light green) and the BACKGROUND still TEAL / GREEN.
- Position CANDLES NEAR WHITE line, NEAR TEAL CLOUD, and lagging span (red line) STILL ON the area candle. (it used to be confirmed with the golden moment).
III.3.G. False Signals, or It could be a Golden Moment (better to see it on TF 15 or bigger):
- Near line 20 or 80 and yellow background = When Stoch RSI have the char R / H on color label, that's means divergence or hidden divergence for buy / sell position, if you not see this label that's means just a standard confirmation for buy / sell depends on where the Stoch RSI line if near 20 that's means buy, near 80 means sell
============================================================================
IV. How to OPEN position:
-------------------------
IV.1. Bullish
IV.1.A. Trendlines Boll Ichi S1 by Gammaprod
- The candles above the green cloud.
- Lagging span (red line) above the candles.
- then open buy near yellow line (the first option) / blue line (the second option) (always confirm the position with two other indicators below).
IV.1.B. MACD Volume S2 by Gammaprod
- Teal or Green background.
- The lines is shaped or shaping green.
- Better if at the green histogram.
IV.1.C. Stoch RSI Divs Zone S3 by Gammaprod
- Teal or Green background.
- The lines is shaping green.
- Better if on the bottom (at a range 20).
IV.2. Bearish
IV.2.A. Trendlines Boll Ichi S1 by Gammaprod
- The candles below the purple cloud.
- Lagging span (red line) below the candles.
- then open buy near yellow line (the first option) / white line (the second option) (always confirm the position with two other indicators below).
IV.2.B. MACD Volume S2 by Gammaprod
- Pink or purple background.
- The lines are shaped or shaping green.
- Better if at the pink histogram.
IV.2.C. Stoch RSI Divs Zone S3 by Gammaprod
- Pink or purple background.
- The lines are shaping pink.
- Better if the line on the top (at a range 80).
IV.3. Consolidation
IV.3.A. Trendlines Boll Ichi S1 by Gammaprod
- The candles on the cloud (green or purple).
- Lagging span (red line) on the candles.
- then open buy near the white or blue line (always confirm the position with two other indicators below).
IV.3.B. MACD Volume S2 by Gammaprod
- Changing the background.
- The line is near the middle line.
- Have small Histogram.
IV.3.C. Stoch RSI Divs Zone S3 by Gammaprod
- Mix background specially on a timeframe 15m or more.
- The line move fast up and down.
- Better if on the bottom or the top of the lines (at a range 20 or 80).
============================================================================
>> The secret ingredient is comparing the timeframe :
The example scalping (Timeframe 1m, 5m and 15m)
- TF 1m is for making an open position.
- TF 5m is for making a judgement of the trend market.
- TF 15m is to confirm that judgement from TF 5m, be careful if it not similar then it used to be a consolidation or the beginning of the reversal.
There's a lot a way to open the position than above information that i gave it to you, but consider there are a limit chars on this column, I hope it will help your trading and make a more profit on it.

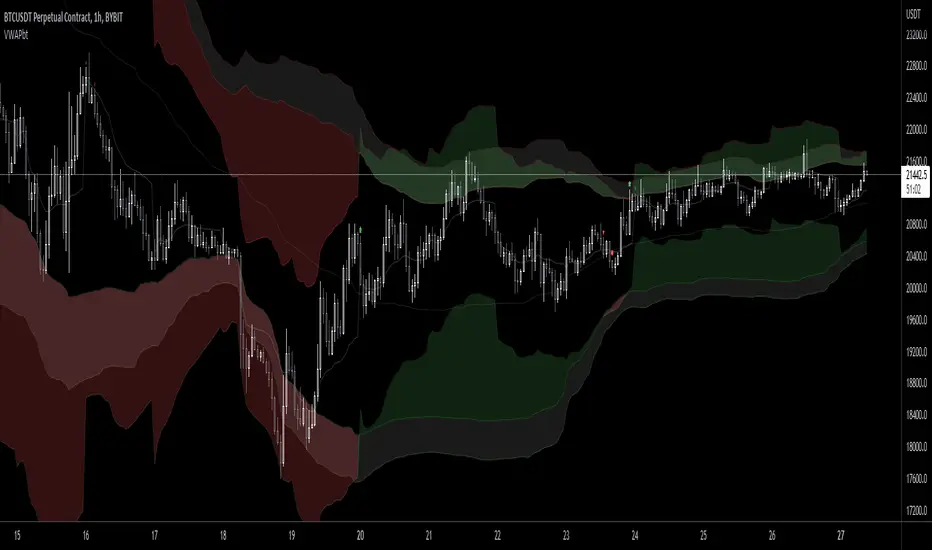
VWAP Band TrendThis indicator combines two features: VWAP bands for range trading and trends for trend-following.
The white bands offer support/resistance levels ideal for range trading: short when rejecting off the upper band, long when rejecting off the lower. Take profit either when hitting the (faint gray) midline and/or when hitting the band on the far side.
The trend analysis shows green or red ranges above or below the bands to indicate trend strength - larger swaths of green or red indicates strong trend while shorter swathes indicate weak. If the upper trend color doesn't match the lower trend color, the trend is undecided or transitioning.
Optionally, trend initiation indicators can be turned on to show above/below candles where a trend switch is taking place.
Support and Resistance Multiperiod (Zig Zag Based)Support and Resistance Multiperiod (Zig Zag Based)
What is the indicator?
• The indicator is a multi period (up to 5 lengths) Support and Resistance indicator calculated based on Zig Zag.
Who can use?
Scalpers to Long term investors
What timeframe to use?
• Any timeframe
What are the lines?
• Green lines are Support levels.
• Orange lines are Resistance levels.
How to use?
• Buy Low and Sell High.
• Brighter zones means strong Support or Resistance.
• Weaker zones appear lighter.
• Brighter zones are formed by overlapping of lines from multiple levels of support or resistance.
Indicator Menu
• The indicator can input 5 different Lengths.
• The default settings uses 13, 21, 52, 100 & 200.
• Every option are customizable.
