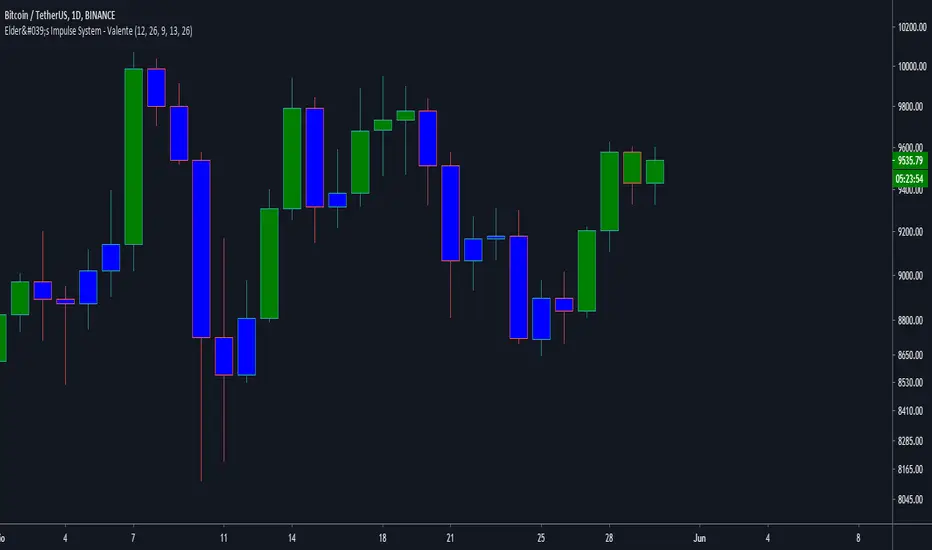
Elder's Impulse System with weekly EMA Filter - ValenteThis indicator was based on the Elders Impulse System by astraloverflow.
The only difference is that I included the weekly EMA26 as a filter and you can plot it on the graph if you want (unchecking the Weekly EMA26 won't turn the filter off, will only stop plotting it).
The indicator works this way:
When the MACD Histogram is growing UP, the EMA13 is pointing UP AND the Weekly EMA26 is pointing UP, the bar is Green
When the opposite is true, the bar is Red.
When any condition from both green and red is not true, the bar is blue.
In my opinion, this particular indicator works better on the D1 time frame. I recommended using the original one, by astraloverflow for other time frames.
I hope it is useful!
System
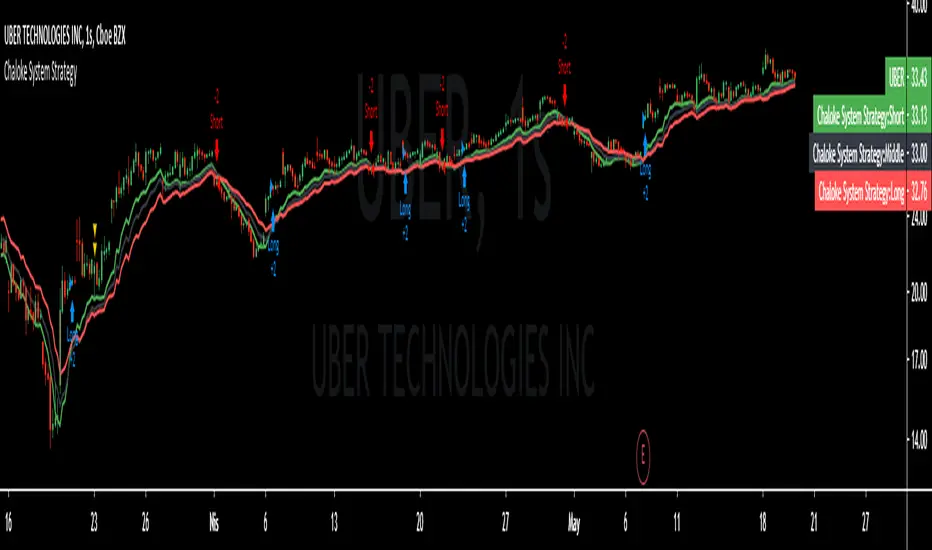
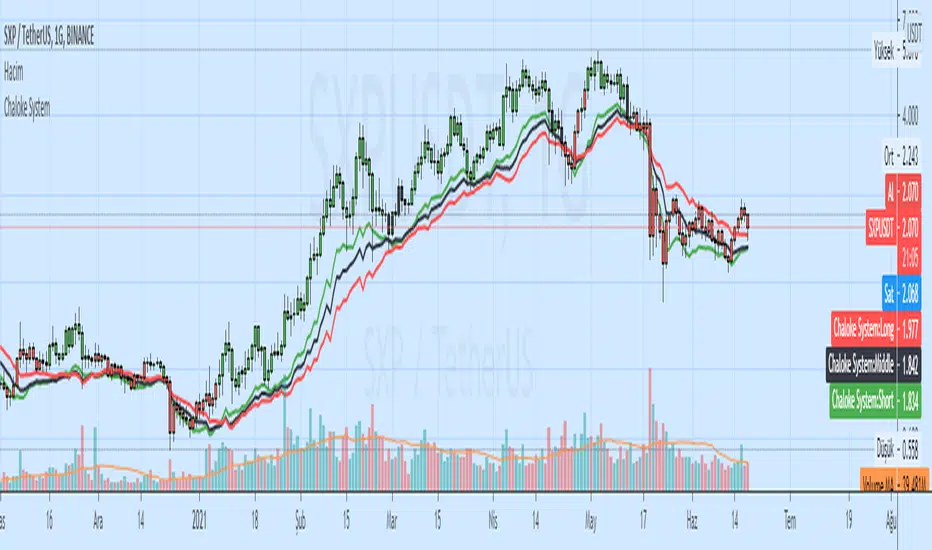
Chaloke System StrategyChaloke System Strategy
This is a trend indicator
Atr and 3 moving averages are used
Short 9-day moving average,Medium 15-day moving average,Calculated with a long 24-day moving average.
Atr period : 5
Sht,Mid,Lng calculation method is different
Buying Strategy
long = crossover(Sht,Mid) and close > Sht
Selling Strategy
short = crossunder(Sht, Lng ) or close < Lng
Buy should be done when the barcolor turns green
Sell should be done when barcolor is red
When the barcolor is black, there may be change.
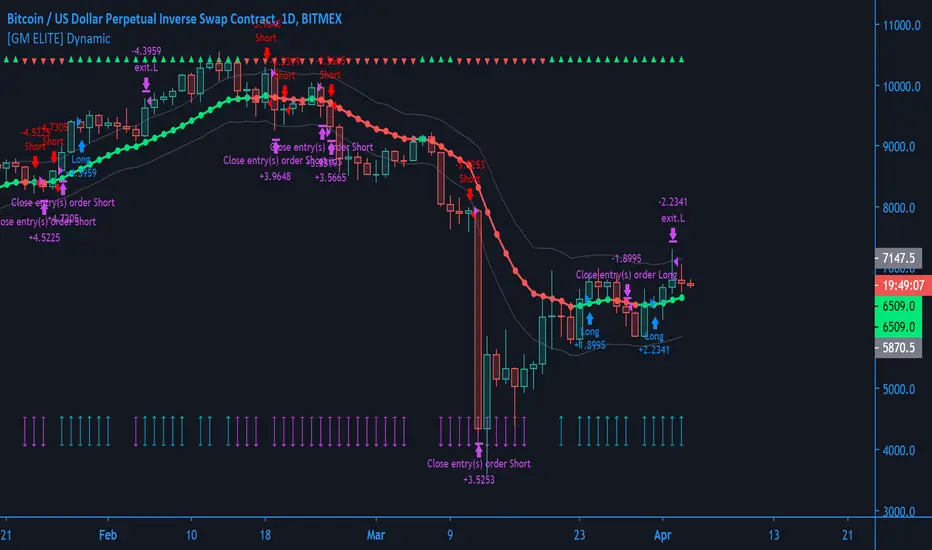
[GM ELITE] Dynamic - Setup AssistantAdditional Tool for Customers of Dynamic. Over 20 indicators built in. Separate Indicator windows to help setup GM Dynamic Algorithm. Toggle which indicator you want to view.

[GM ELITE] Dynamic_Introduction
This is the first of the GM ELITE indicator range. Designed for Algorithmic Traders looking to speed up their process of testing and optimizing their algorithm. This script contains an entire suite of indicators, that work together in unison to find optimal trade entries, based on NNFX rules. There are two versions of this script. One is a strategy and built in back-tester, and the other will update in real time designed for live trading and forward testing.
This script is for live trading/forward testing.
Entries/Exits
The System has 5 indicator slots, and the user can choose one indicator per slot
- Trend Confirmation Indicators to pick when the market has taken off
- Volume and volatility Indicators to determine the strength of the trend or whether the market is ranging.
- Moving Averages for trend bias
- Exit Indicators to signal when to get out!
Money Management
Dynamic allows you to choose your Stop Loss and Take Profit distance based on a multiplier x ATR.
Options to exit the whole trade at TP or at a signal from the exit indicator of your choosing.
Start and End times (Window) to backtest.
Forex - $EVZ
Euro Volatility FX Vix ( aka $EVZ) is built in. You can toggle a filter for low $EVZ or whether or not EVZ is above average. No signals will be given if EVZ is below threshold. EVZ is one of the best indicators of overall forex market volume and volatility .
Customization
Several visual and color customization options. Thousands of possible parameter combinations.
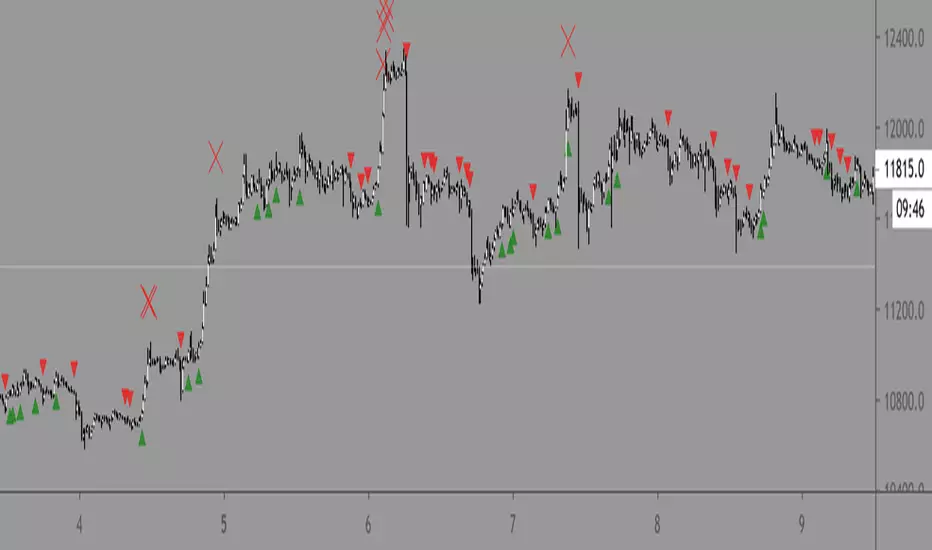
The "bias" or mode of the Confirmation Indicators appears at the top and bottom of the screen as horizontal rows of triangles.
For any two-line Indicator (eg MACD ) if the fast line is above the slow line, the triangles are green, other-wise, they are red.
For any "Level Cross" indicator, when the line is above the level, the triangles are green, otherwise, they are red.
The Arrows at the bottom of the screen determine whether or not there is sufficient volume

[GM ELITE] Dynamic Introduction
This is the first of the GM ELITE indicator range. Designed for Algorithmic Traders looking to speed up their process of testing and optimizing their algorithm. This script contains an entire suite of indicators, that work together in unison to find optimal trade entries, based on NNFX rules. There are two versions of this script. One is a strategy and built in back-tester, and the other will update in real time designed for live trading and forward testing.
Entries/Exits
The System has 5 indicator slots, and the user can choose one indicator per slot
- Trend Confirmation Indicators to pick when the market has taken off
- Volume and volatility Indicators to determine the strength of the trend or whether tha market is ranging.
- Moving Averages for trend bias
- Exit Indicators to signal when to get out!
Money Management
Dynamic allows you to choose your Stop Loss and Take Profit distance based on a multiplier x ATR.
Options to exit the whole trade at TP or at a signal from the exit indicator of your choosing.
Start and End times (Window) to backtest.
Forex - $EVZ
Euro Volatility FX Vix (aka $EVZ) is built in. You can toggle a filter for low $EVZ or whether or not EVZ is above average. No signals will be given if EVZ is below threshold. EVZ is one of the best indicators of overall forex market volume and volatility.
Customization
Several visual and color customization options. Thousands of possible parameter combinations.
The "bias" or mode of the Confirmation Indicators appears at the top and bottom of the screen as horizontal rows of triangles.
For any two-line Indicator (eg MACD ) if the fast line is above the slow line, the triangles are green, other-wise, they are red.
For any "Level Cross" indicator, when the line is above the level, the triangles are green, otherwise, they are red.
The Arrows at the bottom of the screen determine whether or not there is sufficient volume
Out of the Box
The Indicators and parameters out of the box are chosen based on defaults. Please optimize for the market that you trade.My recommendation is to paper trade once you have found a combination of settings with good back-testing results, and have different settings for different markets, as not all markets behave in the same manner.
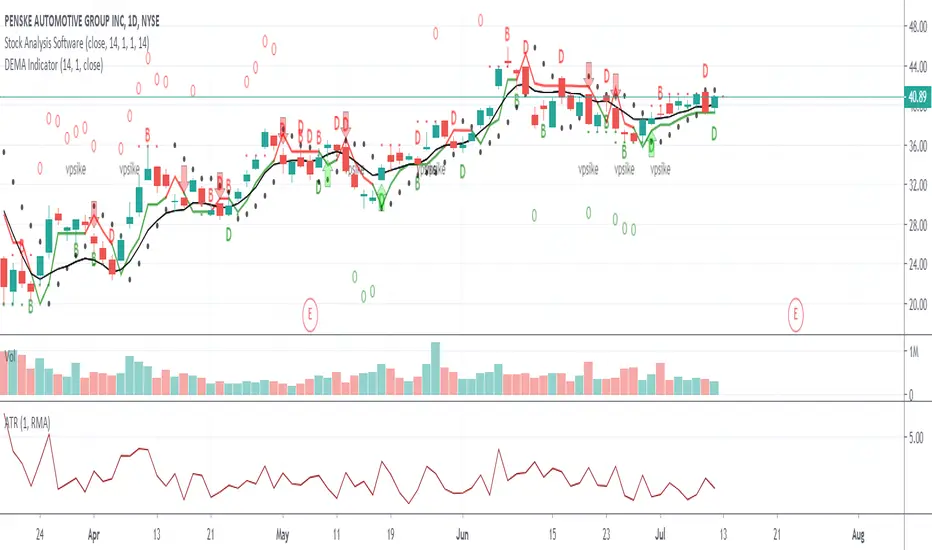
DEMA Indicator
The DEMA indicator is part of the stock analysis software trading system and will highlight on the chart when the moving average and candle are touching on a certain percent ratio. When the candle is GREEN and touching the moving average in the correct ratio it will show a GREEN D below the candle. If the candle is RED and it is touching the moving average in the correct ratio it will plot a RED D above the candle.
If you look at any of these charts you will see the red and green D's. The green D's below the green candles would signal a more bullish looking setup where as a red D would signal a more bearish looking setup.
This indicator is great when added to the complete system to look for entries but also exits. This indicator has been used by myself for many years as a trading professional.
Uber Baseline [UTS]Uber Baseline is a highly customizable Baseline component for any trading system. Different strategies can be applied making it a powerful tool for every trader.
General Usage
The Baseline is used as an indication of the prevailing trend and helps keeping the trader out of bad trades.
Price above the Baseline only allows for LONG trades and below Baseline only allows for SHORT trades.
On price cross upwards from below Baseline and and candle close above Baseline the movement can be considered as bullish. Controversy if price crosses Baseline downwards from above and and candle closes below the baseline the movement can be considered as bearish.
Hence, ENTRY Signals for LONG or SHORT can be derived from those Baseline crosses.
Furthermore, any Baseline cross can also be treated as valid EXIT signal for an open position as the movement indicates a possible shift in trend.
Price that moves with unusual high volatility into one direction often tends to not trend but instead pulls back. Overshoot of the base line (default setting: 1x ATR) is recognized but does not produce an ENRTY signal, only an EXIT signal.
Advanced techniques can incorporate the one-candle-rule waiting for pullbacks after Baseline overshot following a possible ENTRY in direction of the new trend.
Trend traders can also look for Baseline bounces after an ENTRY signal for confirmation and better trade entries.
Moving Averages
16 different Moving Averages are available:
ALMA (Arnaud Legoux Moving Average)
DEMA (Double Exponential Moving Average)
EMA (Exponential Moving Average)
FRAMA (Fractal Adaptive Moving Average)
HMA (Hull Moving Average)
JURIK (Jurik Moving Average)
KAMA (Kaufman Adaptive Moving Average)
Kijun (Kijun-sen / Tenkan-sen of Ichimoku)
LSMA (Least Square Moving Average)
RMA (Running Moving Average)
SMA (Simple Moving Average)
SuperSmoothed (Super Smoothed Moving Average)
TEMA (Triple Exponential Moving Average)
VWMA (Volume Weighted Moving Average)
WMA (Weighted Moving Average)
ZLEMA (Zero Lag Moving Average)
A freely determinable length allows for sensitivity adjustments that fits your own requirements.
Trend Visualization
If the predominant trend direction is DOWN the moving average is painted red. If the trend direction is UP the moving average is painted in green.
If the movement is FLAT then the color is gray.
Alerts
Traders can utilize the following signals to trigger alerts from:
Bull Cross
Bear Cross
Overshoot Up
Overshoot Down
Those values are > zero if a condition is triggered.
Alert condition example: "Bear Cross" - "GreaterThan" - "0"

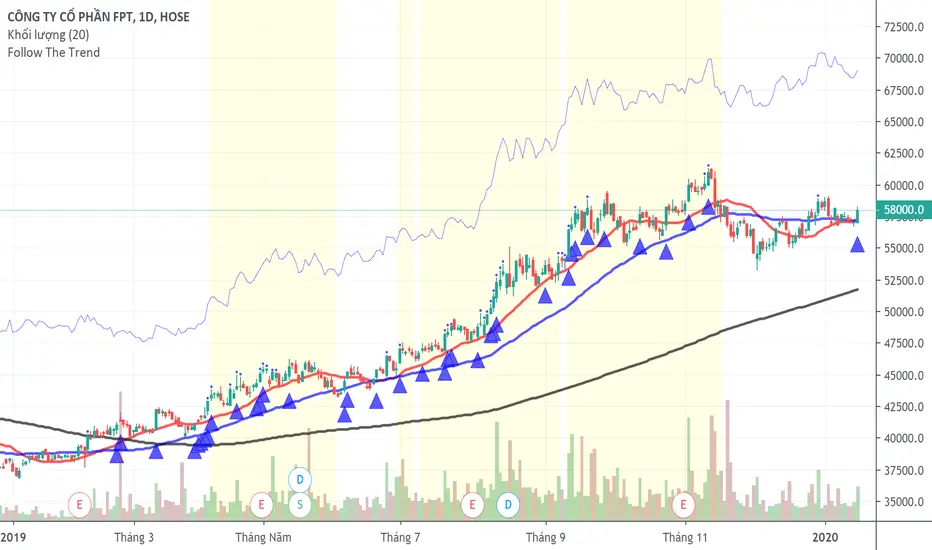
Follow The TrendFollow the trend system
The system uses MA20 as trailing stoploss and marks the strong trending area with color yellow.
This system only uses for stock and Long position.
Leverage Strategy and a few words on risk/opportunityHello traders,
I started this script as a joke for someone... finally appears it could be used for educational content
Let's talk about leverage and margin call
Margin Call
A margin call is the broker's demand that an investor deposit additional money or securities so that the account is brought up to the minimum value, known as the maintenance margin.
A margin call usually means that one or more of the securities held in the margin account has decreased in value below a certain point.
Leverage
A leverage is a system which allows the trader to open positions much larger than his own capital. ... “Leverage” usually refers to the ratio between the position value and the investment needed,
Strat
The strategy simulates long/short positions on a 4h high/low breakout based on the chart candle close.
The panel below shows the strategy equity curve. Activating the margin call option will show when the account would be margin called giving the settings
Casino
I'm not doing any financial recommendation here.
I made this strategy so that people include more risk management metrics into their strategy.
From the code, we see it's fairly easy to calculate a leveraged position size and a margin call flag - when that flag is hit, the system stops trading.
I simplified things to the extreme here but my point is that the leverage is a double-edge sword gift.
Assuming we always take the same position sizing, increasing the leverage speed up how fast a margin could be ..... called. (bad joke? feel free to tell me). Not saying it will, saying it introduces more risk by design.
Then one could say "I'll just turn off that stupid margin call option". And that's when someone starts backtesting with unrealistic market conditions.
Finally...
When I backtest I always assume the worst in every scenario possible (because I'm French), I always try to minimize the risk first (also because I'm French), keeping as close from 0 as possible (French again)
Then I add the "opportunity" component, looking to catch the maximum of opportunity while keeping the risk low.
It's like a Rubix cube puzzle - decreasing the risk is one side of the equation but whenever I try to catch more opportunity... my risks increases.
Then I update my risk... and now the opportunity decreases... (#wut #wen #simple)
Completely removing the risk from a trading strategy isn't something I wouldn't dare doing.
Trading involves risk. Being obsessed by decreasing the risk is what I do BEST :)
Dave

Chaloke SystemChaloke System
Buy=Short>Middle and Close > Short ,barcolor(green)
Sell=Close < Long or Short
Daily RangeHey traders,
at first thanks to the one and only Master Educator Stefan Kassing for sharing his legendary system with us!
And also credit to Mortdiggiddy , RootDuk and PineCoders for helping me with the script =)
This script is calculating the daily range (in pips) of the current market you are in, in relation to the last 70 days (10 weeks) .
It is used for a possible Take Profit in Stefan Kassing's System .
How to add the script to your chart:
1. Click " Add to Favorite Scripts "
-> i.imgur.com
2. Go in the Chart & click the little arrow in the upper bar and then click " Daily Range ", then the Daily Range appears in the top left corner
-> i.imgur.com
To avoid errors make sure to right-click the Y-Axis on the right side of the chart and then left-click "Scale Price Chart Only" .
-> i.imgur.com
Also be aware that the daily range is only showing up , if you are in the daily time interval or below and you are not hovering with the cursor over the past candles respectively above or below them .
If you are using this script in exotic currencypairs or uncommon other markets , the daily range can be incorrect or not showing up .
So don't hesitate contacting me , then I will try to add the markets that you want to.
To change the color or the decimal places of the number, you can click the gear in the upper left corner.
-> i.imgur.com
Happy Pips

X Period High/Low/MidToday we have a simple, but endlessly versatile, indicator that plots the X Period High/Low/Mid of your chosen market.
Traditionally the 52 week High/Low is used as a breakout signal. However, by changing to an X period, and adding a midway line, we create a more versatile indicator that can be tailored to various markets.
By default it's set at 250 periods (because I like the 250 period moving average), and I generally trade H4 and Daily time frames. But tweak it to your liking, you just have to modify the length periods by your desired time frame and lookback length. E.g. to create a 52 week indicator on the daily time frame, enter a length of 260 in the indicator (5 days per week * 52 weeks = 260).
For the above reason, I haven't made this indicator MTF, as there's no real need. However, if users find it easier I can look at adding it later.
Also, the mid point between an X period high/low is often a good trend-follower, as well as acting as support/resistance . I encourage you to experiment with different ways of using this indicator. Entire systems (if your risk management is correct) can be built and traded from this one indicator.
Good luck.
DD


21EMA trading system [CosmonautC] Got inspired by @DropTopSakky to make this after he had been talking about the significance of the 21EMA for a long time
Recommnedation: Use this on the 1-hour to 15 minute timeframe. Will add a feature in the future for lower timeframes. For now lower timeframes have too much noise though.
Was bored today so decided to make a system based on the 21 period EMA. There are oversold, overbought and trend based signals all in one (yes only based on EMA, no other indicators)
There are also options to configure length and moving average type.
Red/green circles = Price will go up/down (trend is bullish or bearish)
Red/green crosses = oversold/overbought
Enjoy!

Mega Trend Plus - S&P 500 Trend Follower / Market GaugeFirstly, 100% of the credit goes to Greg Morris @ Stockcharts.com for the article detailing the concept and most of the settings/components. I've simply implemented his idea. I haven't sought permission from him, but given that he was open with the components of the indicator I'm assuming he's happy for me to go ahead and code this in pinescript. See the article here: stockcharts.com
Okay, so this is part of a system/indicator Greg outlined in the article that he calls Trend Gauge. The idea is fairly simple: take a group of indexes that cover the breadth of the market you want to trade, track their relationship/position to their 200 period Exponential Moving Average (EMA), and assign scores to bull/bear crosses + relative location to the EMA. Once you've normalized and aggregated the scores you finish up with a trend following indicator that works surprisingly well.
This part is called Mega Trend Plus, and tracks whether an index is above or below its 200 period EMA. I'll be releasing the second part ("Trend Strength") soon. Once that's done I'll combine them to form the full "Trend Gauge" indicator.
I decided to provide the base version that people can then experiment with and tweak to their liking, so Greg's version shown in the article is smoother than the one provided here. It's up to you to play with smoothing options, and potentially tweak the weightings of the various components. Please see the script for info on what the various inputs are - I've added notes there.
So, how does it do? Well, as you can see from the chart above it works pretty well overall. The S&P 500 has been fairly trendy over the last few decades, so it's been prime territory for a system like this. It would have kept you out of the big bear markets (particularly GFC & 2015-16), and that's the goal of any trend-based system. They thrive on how little they lose, not necessarily on how much they make.
As you can see, the indicator is pretty choppy. So it's not designed (in the current configuration) to provide accurate buy/hold/sell signals. It currently functions more as a market gauge / strength indicator.
Hopefully you find this concept interesting. It's simple, but the best systems often are.
Please add comments below if you come up with an interesting configuration or variation.
Let me know if you have any queries.
DD


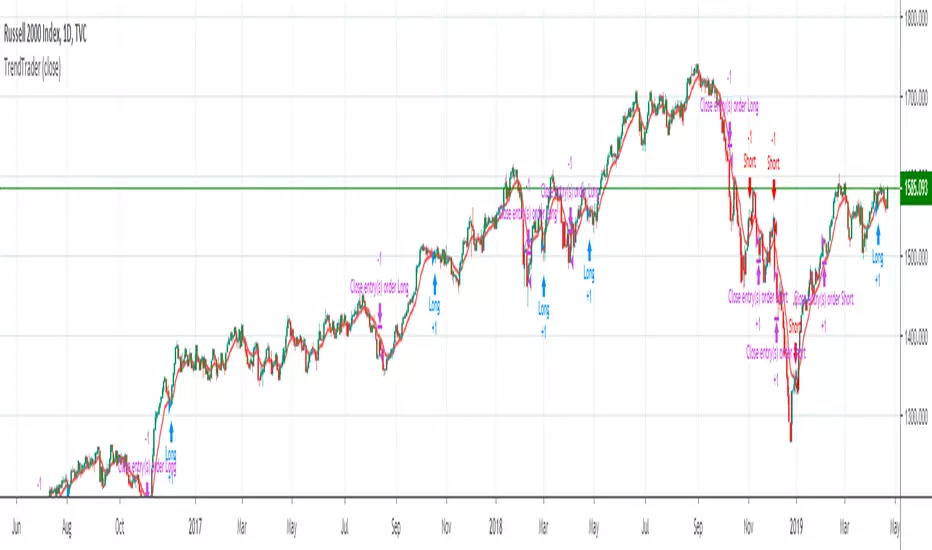
Trend Trader (by JamieSteele)This strategy uses a multi-time-frame approach to trading.
A longer-term set of moving averages represents the Weekly (long-term) Trend.
The current trend represents the intermediate-term trend.
A 10 period exponential moving average represents the short-term trend.
The system trades in the direction of the long-term and intermediate term trend,
and enters trades on pullbacks counter to these trends.
The daily bars are colored based upon their intermediate term trend.
Red=Down Trend, Green=Up Trend.
For short-side trades, we look to capture small, consistent profits. This is necessary
given the extreme manipulation by governments' central banks in an effort to prop-up their
stock markets to give an appearance of an economy that is better than actually exists.
These governments look to limit all downside moves, so we capture small profits and then
re-short after the market resets.
For long-side trades the system stays in the trade until the trend is proven to be over.
Given the extreme valuations present in world markets today, extreme caution should be taken
on all trades, especially long-side trades. Use of derivatives are preferred (e.g. options,
which can be used to limit downside risk.) Naked put selling should be avoided, since huge
losses are possible selling naked puts in a market that is very overdue for a crash/large
price decline.)
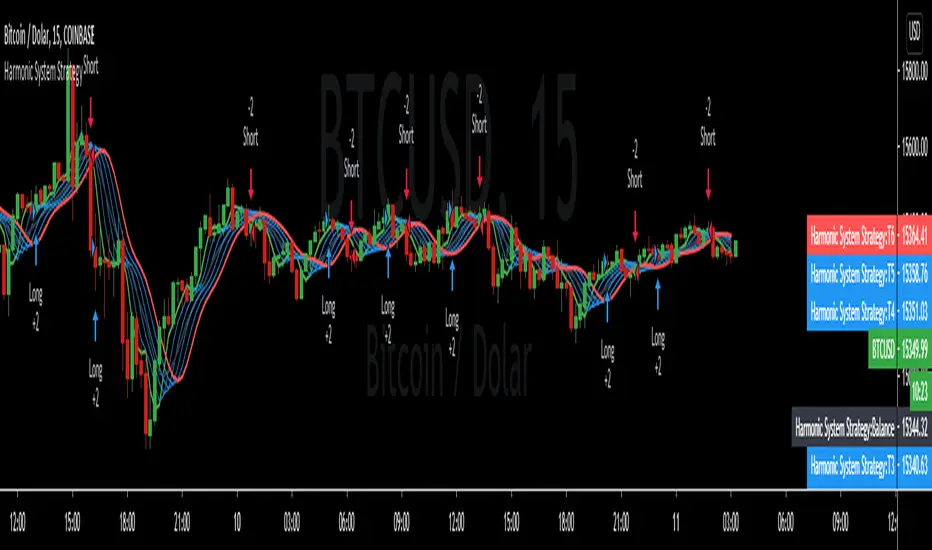
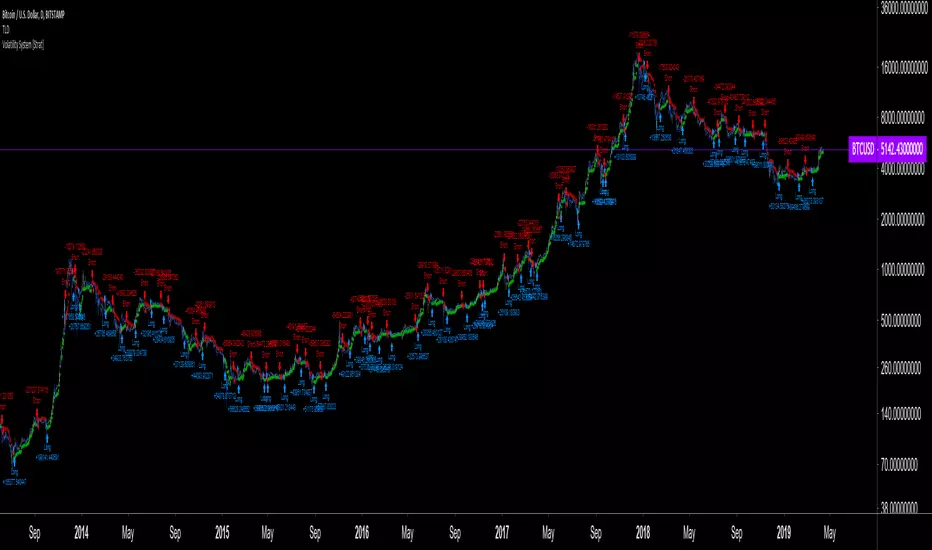
Volatility System by Wilder [LucF]The Volatility System was created by J. Welles Wilder, Jr. It first appeared in his seminal masterpiece, "New Concepts in Technical Trading Systems" (1978). He describes the system on pp.23-26, in the chapter discussing the first presentation ever of the "Volatility Index", built using a novel way of calculating a value representing volatility that he named Average True Range (ATR). The latter stuck.
The system is a pure reversal system (it is always either long or short). One of its characteristics is that its stop strategy moves up and down during a trade, widening the gap from price when volatility (ATR) increases. Because of this, this strategy can suffer large drawdowns and is not for the faint of heart.
The strategy uses a length (n) to calculate an ATR. ATR(n) is then multiplied by a factor to calculate the Average Range Constant (ARC). The ARC is then added to the lowest close n bars back to form the high Stop and Reverse points (SAR), and subtracted from the highest close n bars back to calculate the low SAR. Reversals occur when price closes above the high SAR or below the low SAR.
The system is best suited to higher time frames: 12H and above. Its performance depends heavily on calibration of the length and ARC factor. Wilder proposes a length of 7 and a factor between 2.8 to 3.1. My summary tests at 12H, 1D and 3D on stocks and cryptos yield better results with values of approximately 9-10/1.8-2.5 for cryptos and 9-10/3.0-4.0 for stocks. Small changes in the values will sometimes yield large variations in results, which I don’t particularly like because it tends to imply fragility, whereas I’d expect more robustness from a system with such simple rules. Additionally, backtests at 1D on cryptos provide so little data that no solid conclusions can be drawn from them.
All in all, the system is not very useful in my opinion; I publish it more for completeness, since as far as I can tell, it did not exist on this platform before. I also publish it out of respect for Wilder’s work. His book laid the foundation for many of the building blocks used by system designers, even today. In less than a hundred pages he presented RSI, ATR, DMI, ADXR and the Parabolic SAR indicators, some of which have become built-in functions in programming languages. This is a colossal feat and has not been repeated. Wilder is a monument.
Some lesser-known facts about his book:
It sells for the exact same price it cost in 1978: 65$,
The book has always been published by Wilder himself,
The layout hasn’t changed in 40 years,
He sells >35K copies/year.
Gotta love the guy.
The strategy is shown here on BTC /USD with settings of 12/1.8 (the defaults are 9/1.8). It shows the system under its best light. Other markets will most not reproduce such results. Also, the drawdown is as scary as the results are impressive.
Features
The code is written as a strategy but can easily be converted to an indicator if you want to use the alerts it can produce. Instructions are in the code.
You can change the length and ARC factor.
You can choose to trade only long or short positions.
You can choose to display the SARs (the stops) in multiple ways.
You can show trigger markers.
A date range can be defined.
3 alerts: reversals (both long and short), longs, shorts. Remember that for the moment, strategies cannot generate alerts in TradingView, so the strategy must be converted to an indicator in order to make the alerts available.
Sar-MA SystemThis Script uses Parabolic SAR (developed by Welles Wilder) and some Moving Averages to calculate BUY/SELL and Close Buy/Close Sell points. Additionally the script adds Stop Loss line that is calculated by using Average True Range (ATR).
Basically, script checks the Parabolic SAR and gets confirmation from moving averages or parabolic sar of the higher time frame.
You will not be in a position all the time because if there is no comfirmation then you need to wait for it. For example after closing BUY position, if no confirmation from MAs or higher time frame SAR then there will not be short position, or vice versa.
if you use it please comment.
If you find this script useful, please consider a donation
BTC: 16XRqyS3Vgh1knAU1tCcruqhUrVm4QWWmR
