Tick Weighted Average PriceTick Weighted Average Price
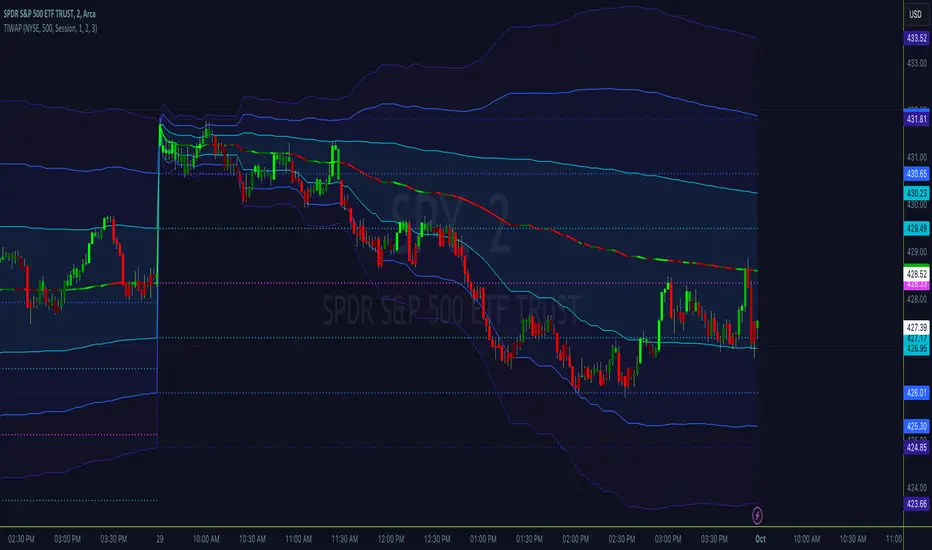
"TiWAP" is an indicator that tracks the NYSE TICK by default and plots weighted average price on the charted security based only off of extreme TICK movement. NASDAQ TICK is also supported and future updates may add others if they provide value, or if requested.
What makes this different?
Quite simply there isn't another indicator that plots weighted average price based on TICK movement as done here, this is showing the correlation between the entire markets volatile price movement and the charted security. It provides a sense of established fair value given the entire NYSE/NASDAQ, given the automated nature of the markets there's a strong correlation between highly liquid ETFs/Indexes and the whole market.
How to use
Using this is similar to volume or time weighted average price, there is the average price line that is only adjusted when TICK movement breaches configured thresholds via sensitivity. Standard deviation bands are calculated and can be enabled up to 3rd deviation as per standard configuration, the further deviations being broken can serve as valuable signals for reversals.
As price is affected by market volatility look to see the weighted price adjust to actual price and combine with other trading strategies to take advantage of the data. Rejections and bounces near standard deviations as well as the weighted average price line can provide excellent trade setups, or they could be utilized in advanced options strategies such as straddles, strangles, iron condors, etc.
Anchor points can be utilized to track how the market is adjusting broad value for the week, month, quarter, etc. The higher timeframe based anchor points will need higher periods for the chart or a max bars lookback error may occur.
Sensitivity should be adjusted as changes in TICK occur, this is commonly correlated with NYSE adjustments but the tooltip provides some guidance on value selection based on current conventional wisdom.
Markets
TICK tracks the entire market and as such whatever the entire market is doing will most likely apply to any individual security charted so give this a shot with anything you trade and let me know your results :)
Usage Conditions
Currently I'm finding the most success with this weighted average price on various intra-day timeframes, but anchored on weekly or higher and utilizing other timeframes may net some interesting swing trading opportunities.
TICK
Tick LevelsTick Levels
This indicator is designed to be a companion to "MIT" .
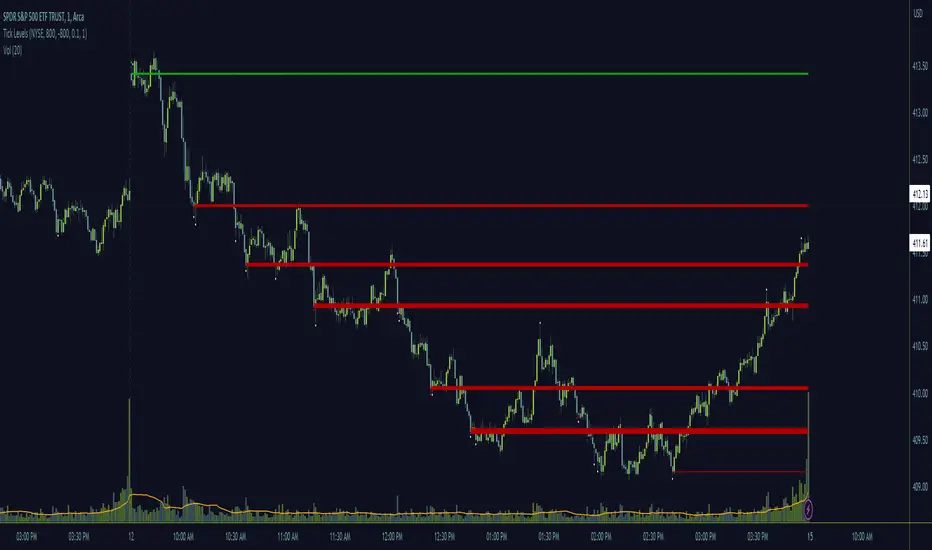
It tracks the NYSE TICK by default and plots key levels on the charted security based off of extreme TICK movement. NASDAQ TICK is also supported and future updates may add others if they provide value, or if requested.
What makes this different?
Quite simply there isn't another indicator that plots levels based on TICK as done here, the signal and proximity sensing features added give context to which levels may provide the best entries, trims and exits for day traders.
How to use
Ensure adjustments are set for TICK, it changes over time but currently I've found the defaults to be best suited for me - your results may vary.
Watch price around the tick levels plotted on the chart to combine with other trading strategies. Use the proximity tolerance setting to ensure multiple TICK movements within the region as other movements are combined to lessen any possible noise, or disable this feature if each individual line is desired, though be warned extremely volatile days may produce noise.
Currently, the tick levels are reset on first new bar on regular sessions, but perhaps a future update will allow past sessions lines to stay with setting adjustment.
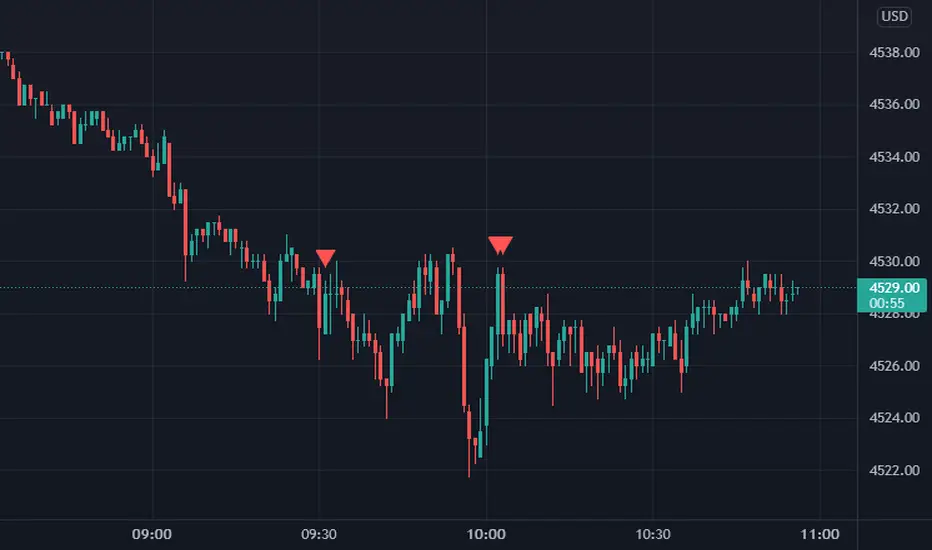
Diamonds above or below candles signify extreme highs and lows of TICK respectively, and triangles above or below candles signify extreme closures of TICK - if you're using this indicator in combination with "MIT" it may be redundant and you can disable the signals should you so choose.
Markets
TICK tracks the entire market and as such whatever the entire market is doing will most likely apply to any individual security charted so give this a shot with anything you trade and let me know your results :)
Usage Conditions
Currently I'm finding the most success with these levels on various intra-day timeframes, the more fine grained the more levels you can expect potentially but at key areas.
Market Internal TrendMIT - Market Internal Trend
I've developed what I consider to be the best market internals, market breadth indicator on Trading View to date :)
Market internals (sometimes referred to as Market Breadth) are built-in indicators of the market, there are the following main indicators:
TICK - Uptick or downtick transaction of market (NYSE/NASDAQ)
ADD - Advancing or declining issues/stocks of the market
VOLD - Up volume or down volume of the issues/stocks of the market
TRIN - Trend of market based on ADD and VOLD
VIX - Volatility of the market
PCN - Options market puts vs calls
What makes this different?
This single compact indicator delivers an "eyes on glass" style presentation to detail extreme movements of TICK, sentiment analysis of ADD and VOLD as well as their trends and report when the market is most likely balanced or an in imbalance. No need to study multiple clouds and amassing a ton of different charts all with similar indicator setups and candle analysis in the heat of the moment.
Use this to determine the overall initial trend at open, watching for imbalance and extreme movement on TICK as a signal to prepare for potential trades. The metrics table is useful to see where potential rejections/bounces may occur on the volatility index.
Extreme tick closures (see below) can provide excellent trim or exit signals for existing trades depending on the market structure of the day (trending or ranging).
How To Use
The main histogram represents the highs and lows of TICK, anything within the +/- $500 region is most likely normal movement while anything outside of that will brighten in color and indicates potential larger reactions. Extreme highs and lows will be represented by white diamonds by default, closures are indicated by bright colored crosses at $0. Price levels should be noted on the securities being traded during TICK extreme movement, these usually act as dynamic support and resistance from my observations but your results may vary (please share in comments your experiences!).
There is a smoothed trend line over the histogram, by default it's white in color, and this represents simply a trend of TICK closures - when it's trending down the market should be following in kind and vice versa; adjust the smoothing length in settings to suit your trading style.
The center line will have colored dots, by default yellow for balanced markets or white for imbalanced markets. When the market is in an imbalance that's when trending moves have been observed and balanced markets are usually choppy with sideways price action not suitable for quick scalp type trading styles.
The upper colored band represents the market overall advancing or declining issues/stocks within the market, by default green tones are bullish for a advancing market and red tones represent bearish market - the brighter the tone the strong the sentiment. There are triangles at all times above this band and that represents a smoothed trend status as compared to the current amount of stocks in advance or decline, if the smoothed trend is above then it's potentially a signal of reversal (red triangles over green band would be bearish reversal and vice versa).
The lower colored band works the exact same as the upper band but it tracks the up and down volume of the issues/stocks within the market, it utilizes the same color and triangle logics as the upper band.
Markets
Currently this will present internals data for NYSE and NASDAQ, I'm still researching other markets internals and their particulars.
The signals on this indicator will best apply to SPY, QQQ, ES, NQ or highly liquid ETFs largely affected by NYSE or NASDAQ - individual stocks may have mixed results depending on how they're moving with major indexes so keep that in mind when watching for sympathy moves with the indicator.
Usage Conditions
All of the market internals are fantastic indicators when day trading, I've had great success on 1-15 minute and even higher for scalps or intra-day swings. Observing the middle dots will save those of you that struggle in choppy markets from being too aggressive when opportunities don't exist.
Use the triangles, diamonds, dots and crosses to your advantage to manage your scalps and intra-day swings, or gain an edge in preparation for entering trades!
I hope this indicator is a benefit to all for day trading, provide any feedback or feature requests in the comments.

Volume Tick ExperimentThis ticks-based indicator provides real-time volume information for a trading asset. Volume is analyzed and updated continuously, not just at candle close. It is based on DGT's Bull vs Bear Power indicator but adds a gas signal that activates when buying or selling volume percentage reaches a predetermined threshold.
This indicator can also help traders determine the direction and aggressiveness of pushes in buying or selling volume. By monitoring the volume percentages and gas signals, traders can get an idea of whether the market is pushing in a particular direction and how strong the push is. This information can be helpful in making trading decisions and identifying potential entry or exit points.
The indicator uses open, high, low, and close prices of the asset to calculate volume information. It determines the average volume over a selected period and calculates volume for both buying and selling. This information is used to calculate the percentage of buying and selling volume. A gas signal is triggered when either the buying or selling percentage reaches a predetermined threshold.
Enjoy!

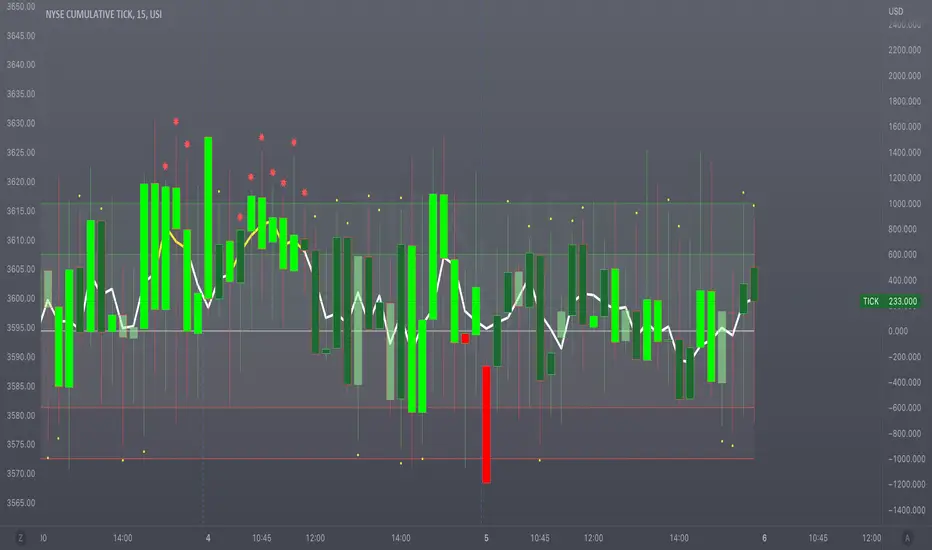
Tick Profile HeatmapThis is a market internal TICK heatmap with the intent of displaying areas of price associated to stronger reactions with NYSE TICK (by default).
This code is based off of a variation of a Volume Profile coded originally by colejustice who originally used code from LuxAlgo . The full-width volume bars that colejustice setup were replaced with full-width bars representative of TICK breaking +/- $500, the current cumulative value representing the "heat" is comprised of hlc3 by default but that can be changed. In a future update I may add additional logic here to capture highs and lows in the heatmap specifically, and perhaps additional colors.
As with other traditional profiling studies, this indicators purpose is to visualize correspondence to specific price levels, allowing rapid assessment where the most TICK activity is occurring, and where it hasn't been. This information may provide areas of support and resistance and regions where price may move quickly repeatedly.
All of the same input guidance that colejustice provided is the same for those pre-existing inputs:
Inputs are set up such that you can customize the lookback period, number of rows, and width of rows for most major timeframes individually. Timeframes between those available will use the next lower timeframe settings (e.g., 2m chart will use the 1m settings.)
Zero usage of volume is present in this indicator, only TICK data so please don't confuse it with volume studies.

LNL Smart TICKLNL Smart TICK
This study is mostly beneficial for intraday traders. It is basically a user-friendly "colorful" representation of the $TICK chart with highlighted $TICK extremes. This indicator also includes: a simple trend gauge that can visualize the bias for the day, cumulative tick cloud which is showing the cumulative strength of either longs & shorts on the day.
$TICK Trend Gauge
Although it is just a exponential moving average. This average (default set on 20) works quite well as an overall gauge for the day. Whenever the gauge is green (above zero), any negative $TICK values below -500 can offer great pullback opportunities. Same applies for the red gauge. 20 EMA is below zero ? Great time to fade any +500 or +1000 tick readings. Obviously the gauge can be ajdusted to any number based on personal style.
$TICK Extremes (little triangles)
These little triangles are triggered anytime $TICK jumps above or below the pre-set values of +1000 or -1000. By just simply observing the $TICK triangles during the day can tell you how much volaility or pressure there is. Sometimes there will be 20 green triangles and only 2 red ones. That obviously mean there is a strong bearish pressure. But there will be days when you are not going to see any triangles at all which can mean there is either a low volatility or the price is stuck in the indecisive market.
Cumulative $TICK Cloud
Cumulative $TICK by itself is a great study for day traders. It is basically running "counting" $TICK that is adding the previous $TICK values from previous bars. Cumulative $TICK can create a direct picture of the current market sentiment. It is not just a simple green / red line but a cloud that can really show you the depth on the $TICK. Some days, the cloud will be quite wide which is a good sign for the strength to one side, but sometimes the cloud will be so narrow it will practically disappear. This would be telling you the exact opposite - not much conviction to any side. Of course the depth as well as the color of the cloud can change during the day.
$TICK & Cumulative $TICK Tables
By just looking at these tables. You can immidiately tell the state of the current $TICK. They both can be red or green. It all depends whether the values are positive or negative. The tables are just a little visual addition to the whole $TICK study.
Hope it helps.

Big 8 Intraday TICKAt the start of each trading day (0930 EST), this indicator calculates the intraday price difference between open and close for the eight largest market cap stocks (AAPL, AMZN, GOOGLE, META, MSFT, NFLX, NVDA, and TSLA), assigns a +/-1 for each, and then plots the cumulative change. An EMA has been added for smoothing purposes that is set to 5 but can be changed. Please note indicator is best used on lower timeframes (15 min or less) and has no applicability to time frames above 1 hour.
The thought behind this indicator is those eight major stocks drive a majority of intraday price change in indices like SPY and QQQ that are heavily weighted towards these stocks, therefore they should be a leading indicator in price change. You can often catch a move in SPY or QQQ one to two bars (on 1 min chart) ahead of the actual move because you see this indicator moving strong to one direction.
It's not perfect as there are divergences you will see when you compare historical charts, but oftentimes those divergences ultimately lead to significant price swings in the same direction as this indicator, so recommend being on watch to pull the trigger when you see those and price confirms.
You can use this indicator in a few ways:
1. Confirmation that your current trade is in the same direction as this indicator
2. Use the zero cross as a trigger for put or call entry
3. Focusing only on calls/longs if the value is above 0, or only puts/shorts if the value is below zero. Just be sure to keep an eye on reversals.
If you have recommendations on how to improve, let me know and I'll do my best to make changes.

TICK - Custom Tickers [Pt]Traditionally, the TICK index is a technical analysis indicator that shows the difference in the number of stocks that are trading on an uptick vs a downtick in a particular period of time. This indicator allows user to choose up to 40 tickers to calculate TICK.
By default, it uses the SPY Top 40 stocks, but can be changed to any tickers.
There are options to show:
- Top 7 , ie. can be used for just showing TICK for FAANGMT => $FB + $AMZN + $AAPL + $NFLX + $GOOG + $MSFT + $TSLA
- Top 10
- Top 20
- Top 30
- Top 40
Data can be displayed in candle bars, line, or both.
Enjoy~

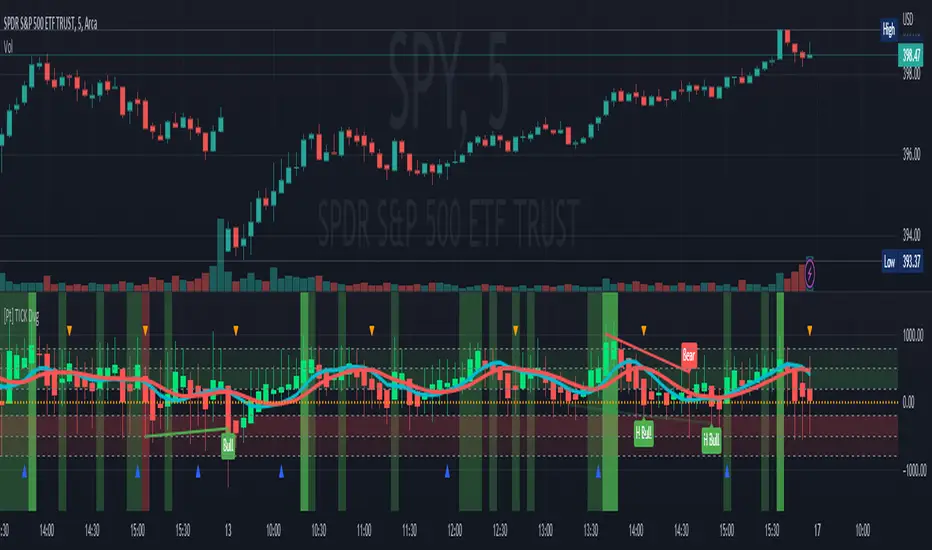
TICK Divergence + Heikin Ashi [Pt]This indicator identifies divergence between NYSE TICK and price, displays TICK in line, bar, or Heikin Ashi format, calculates various types of moving average lines and shows moving average crossovers.
What is TICK
NYSE TICK, also known as the TICK index, is a technical analysis indicator that shows the number of stocks on the New York Stock Exchange (NYSE) that are trading on an uptick or a downtick in a particular period of time. The TICK index is calculated by subtracting the number of stocks trading on a downtick from the number of stocks trading on an uptick. A reading of +1000 on the TICK index, for example, would indicate that there are 1000 more stocks trading on an uptick than on a downtick. The TICK index is often used as a measure of market sentiment, as it can provide insight into whether there is more buying or selling pressure in the market at a given time. A high TICK index reading may suggest that there is strong buying pressure, while a low TICK index reading may indicate that there is more selling pressure in the market.
The TICK index is usually very volatile, so this indicator is best suited for lower timeframes, such as 1 to 5 min charts.
Features
1) Shows bullish, bearish, hidden bullish and hidden bearish divergences
2) Three display modes for TICK data: Line, Bar, Heikin-Ashi
3) Plot various moving average lines and crossovers. Overall background
4) Configurable significant zones. Background colors will change based on closing TICK value.
BullBarbie's TICK Companion v1.2For use on a TICK Index chart. Intended for 5 minute intraday chart
There are approximately 2800 tickers on the New York Stock Exchange. The TICK index (ticker TICK) compares the number of stocks rising to the number of sticks falling. A perfect harmony of rising vs falling stocks would read "0" (zero) on the TICK index. A rising TICK reading will indicate that more stocks are gaining value so we might expect indexes like the S&P 500 (SPY, SPX, ES) to also be rising. An extremely high reading is often not sustainable and can indicate a reversal. Conversely, a low TICK reading indicates more stocks losing value and therefore likely indexes following suit; however, this is only sustainable for so long. When persistently high or low TICK readings are not reflected in price action, this can also clue traders in that a reversal or breakthrough could be likely. The TICK index is one of many popular "market internals" used by the best professional traders out there.
This indicator has several features:
* Candles are color coded (and customizable). Out of the box, moderate/neutral TICK readings have muted red and green candles intended to not catch your eye. When TICKS are elevated in either direction (bid or ask), a bolder color candle serves as a warning. Beyond that, a 3rd level of "extreme" TICK readings create brightly colored, eye-catching candles. Colors and levels are adjustable.
* Level Zones come programed with colored backgrounds and level lines to indicate when candles are exceeding high/low and extreme readings. All colors, brightnesses, and levels can be customized or turned off completely if you'd prefer.
* A build-in color-changing EMA can be set to any period. When the EMA hits an extreme level, the color changes to bright yellow. Of course you can also turn this on and off and adjust the style.
* Warning dots appear above and below more aggressive TICK candles letting you know in a highly visual way that something potentially important is going on with the TICK index. When extreme readings are sustained, large warning stars appear as these levels are the most likely to result in a reversal.
Of course, use the TICK Companion as one of many tools and always consider its indications in the context of market trend, levels, news events, and other factors.
I built this indicator for the 5 min, 1 day TICK Index chart on my Dashboard chart layout where I keep my helpful market internals charts and have been asked to make it available on TradingView. I'm making it available for a small premium to cover maintaining updates & improvements.
Tick based chart [DotH]Version 1.0 - 2nd January 2023
Hi All,
This is my first published indicator, although I have written several hundreds for private use.
Description
Tick based chart
I got intrigued while reading about tick based charts on this page (please note this link/website owner is not affiliated with me) , so I decided to see if it would be possible to recreate this type of chart in TradingView, and here's the results.
This is an implementation for displaying a tick based chart in Trading View. There are benefits to using ticks based candles, as each candle represents the same number of "price moves" rather than an unknown number of moves.
Tick based charts are charts with candles that are rendered in the same way as traditional candles. However, instead of rendering a new candle at a specific time period,tick based candles are rendered after a set number of ticks have occured. For example, in a 50 tick chart, each candle that you see represents exactly 50 ticks, i.e. 50 price changes/moves. Having a view of what happens on the tick level, may help some traders evaluate what is happening within very large candles, or even detect a change in trend, volatility or some other metric which otherwise may not be visible using a standard chart.
Please note that this indicator DOES NOT match/synchronize timewise with the main chart in TradingView. You must view it independently. If you need to see what times are represented in the tick chart, you can look at the custom time labels and X-Axis grid lines in it to get an idea what parts of the tick based chart correspond to the main chart.
Limitations/known issues:
Currently the indicator has been restricted to 100 candles. This is for limiting the line and box usage to a max of 300 objects.
On timeframes above 1 minute, the seconds values will always be 0. In order to be able to see seconds values in the chart scale you need to be on a second level chart, which requires a premium TradingView subscription.
Changing the parameters in the settings will cause the chart to empty and start redrawing from its first candle again. This is because the tick chart is being drawn from realtime data, unlike the standard TradingView charts.
TODOs & Bugs:
Add some moving average indicators (SMA, EMA as a minimum)
Add a corresponding tick based volume chart
Create RSI, MACD, BB variations of this indicator
If you have any ideas/suggestions or bug reports, please feel free to let me know, however keep in mind that I do not have too much spare time to add things, so updates are going to be sporadic.
ABOUT CODE REUSE:
The code is free to use/change. However, if you plan to use this code to make a derivative indicator or strategy, it would be nice to know, so let me know if you feel like it!

[Pt] TICK + Heikin Ashi RSI IndicatorThis indicator combines NYSE TICK and RSI to aim to provide a view of NYSE market trend strength.
What is TICK
NYSE TICK, also known as the TICK index, is a technical analysis indicator that shows the number of stocks on the New York Stock Exchange (NYSE) that are trading on an uptick or a downtick in a particular period of time. The TICK index is calculated by subtracting the number of stocks trading on a downtick from the number of stocks trading on an uptick. A reading of +1000 on the TICK index, for example, would indicate that there are 1000 more stocks trading on an uptick than on a downtick. The TICK index is often used as a measure of market sentiment, as it can provide insight into whether there is more buying or selling pressure in the market at a given time. A high TICK index reading may suggest that there is strong buying pressure, while a low TICK index reading may indicate that there is more selling pressure in the market.
By default, I am using -800 and 800 for oversold and overbought levels. These are configurable. Also, this indicator includes TICK divergence signals.
The TICK index is usually very volatile, so this indicator is best suited for lower timeframes, such as 1 to 5 min charts.
Idea of TICK neutral zone
As part of this indicator I've identified what I consider as "neutral" range for the TICK. Based on my own personal experience, the market tends to be in consolidation or choppy in this range. By default, I've defined this range to be -200 to 200. This range is configurable.
Signals
In combination with RSI and Heikin Ashi RSI (HARSI), which help smooths out the RSI values and make it easier to identify trends and potential reversal points, this indicator aims to generate Bullish vs Bearish signals based on the following conditions:
- bullish / bearish HARSI candle
- Inside bar on HARSI candle
- TICK trend (above or below Neutral zone)
- RSI trend (above or below 0, but not overbought or oversold)
- RSI / HARSI convergence and divergence
When all bullish conditions are met, the signal turns bright green. Bright red when all bearish conditions are met. These generated signals aims to provide users easy to read visual cues to help with their trades.
A table is also provided in attempt to identify the trend in real time:
TICK trend:
- Bullish, Extended
- Bullish
- Neutral w/ Bullish bias
- Neutral w/ Bearish bias
- Bearish
- Bearish, Extended
RSI:
- Bullish
- Bearish
Note on scale
This indicator is based on the scale for TICK, hence the RSI and HARSI are scaled. By default, standard overbought RSI value of 70 = 800 on this scale, whereas oversold value of 30 = -800.
Credits:
Heikin Ashi RSI code was borrowed from @JayRogers - Heikin Ashi RSI Oscillator

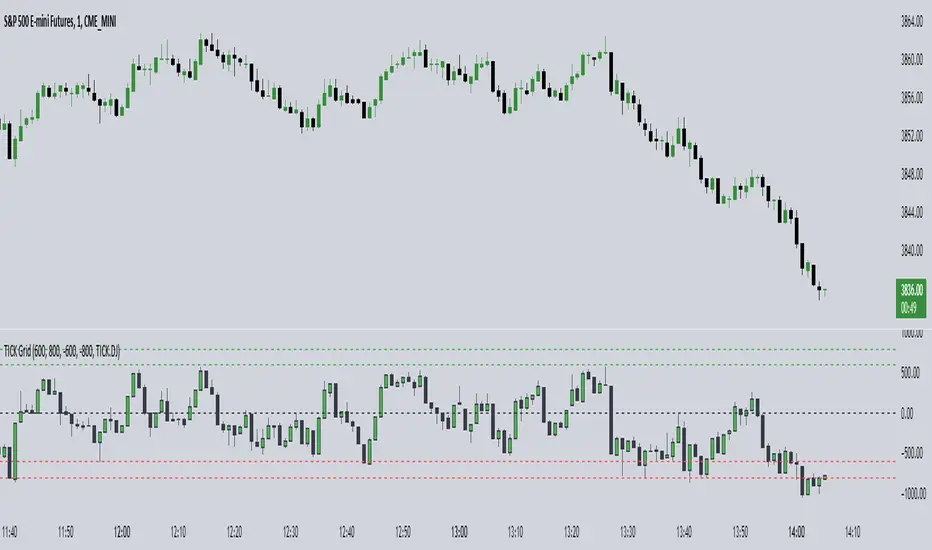
TICK Grid (TheMas7er)█ OVERVIEW
Shows the NYSE Tick Index, as it is used by TheMas7er .
This indicator has several customization options built-in that can be configured:
• Positive and negative threshold levels with show/hide option and color selection.
• Zero line with show/hide option and color selection.
• Bar colors are fully customizable.
• Symbol can be changed. Default is USI:TICK for the New York Stock Exchange.
Tick Indices are available in TradingView as a symbol - just like any other stock - which you can show on a chart.
This script adds a pane with your selected Tick Index, which can then be used as an indicator to make short-term trading decisions.
█ CONCEPTS
The Tick Index is a short-term barometer of internal market strength.
It shows the number of stocks trading on an uptick minus the number of stocks trading on a downtick, and is used by day traders to view the overall market sentiment at a given point in time.
It's categorized as a Breadth Indicator because it analyzes the "Breadth and Scope" of an entire Index.
Since the Tick Index measures the up/down ticks of a universe of stocks, any collection of stocks (market,index,...) could theoretically have it's own Tick Index.
Some of the major Tick Indices are:
• USI:TICK for the New York Stock Exchange
• USI:TICKQ for Nasdaq
• USI:TICKI for the Down Jones
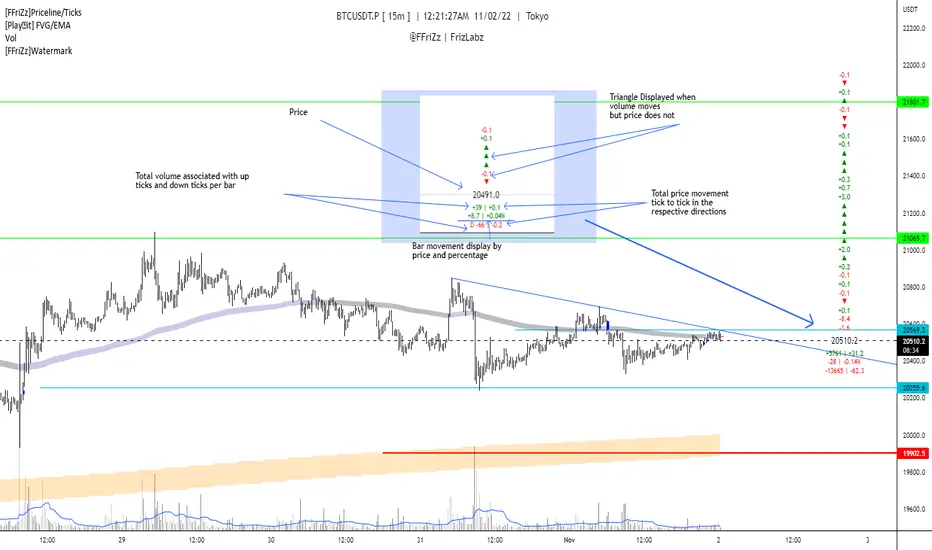
[FFriZz]Priceline/TicksFFriZz | FrizLabz -- Priceline/Ticks
Due to TradingView not allowing us to change the size or style of the Priceline I decided to make this
You can change the style, size, color of the Price line with this Script
There is also an option for the closing price to be plotted on the Priceline
-- Colors --
You can have the Line and/or the Closing price change colors with the price movements
both are adjustable to your preference
-- Ticks --
Will show the difference in price from tick to tick
when Volume moves but price doesn't it will show '▲▼'
-- Adjustments --
The offset of the Close and Ticks can be adjusted from left to right
Can Extend Priceline in all directions
Can change the Line style and Width
Can change all the Text sizes and Colors
Can also Change Colors to change with Price movements
Can Change number of Ticks to show
-- Priceline --
You don't have to but I suggest going to the settings of your Chart and turning off the Priceline
-- Challenge --
There is Some code at the bottom that will move the Label and Ticks to the x% of your screen in from the right once
the last bar is no longer visible. I decided not to use it because even when the feature is turned off any movement of the
chart resets the Ticks. If you find out a way to have it not reset the Ticks Let me know!
If you find any bugs or have any suggestions feel free to DM me or leave a comment!
Hope you Enjoy! -- FFriZz | FrizLabz
Tick LiteTick Lite is our solution to issues caused by indicator processing restrictions.
Our original Tick Plus Indicator was too powerful and had to be split into 2 indicators to guarantee we are giving you the fastest live tick data through it.
You can use Tick Lite with "Tick Plus" for the entire Tick Plus System, or you can use it on its own if you prefer.
Tick Lite displays the Tick Chart along with our Market Sync Indicator.
The Tick chart displays a candlestick TICK chart for your chosen exchange and keeps track of the current day's high tick and low tick. Drawn behind these are our Key Reversal Zones.
Market Sync Indicator
This is a small but powerful indicator that analyzes the inflow and outflow of each exchange's underlying securities. When all the markets are in harmony, it will print a green or red symbol below the tick chart.
Alerts can be set with these signals to take advantage of the system across tickers.
Note: A gray readout indicates that every market is not moving in the same direction at that moment.
We recommend using this indicator with our "Tick Plus" Indicator for the entire Tick Plus System.
All of the default settings are our recommended settings.
Please check the Author Instructions Below for how to gain access to our indicators.

TICK/BreadthThis indicator will show you both the $TICK values for the day showing you the advance and decline of stocks in the NYSE throughout the day, as well as showing you the Breadth ratio for the NYSE and the NASDAQ.
There is a maximum and minimum line showing the maximum and minimum throughout the day.
There is also a marker placed on this max/min line for when the TICK candle closes above or below zero.

Tick PlusTick Plus
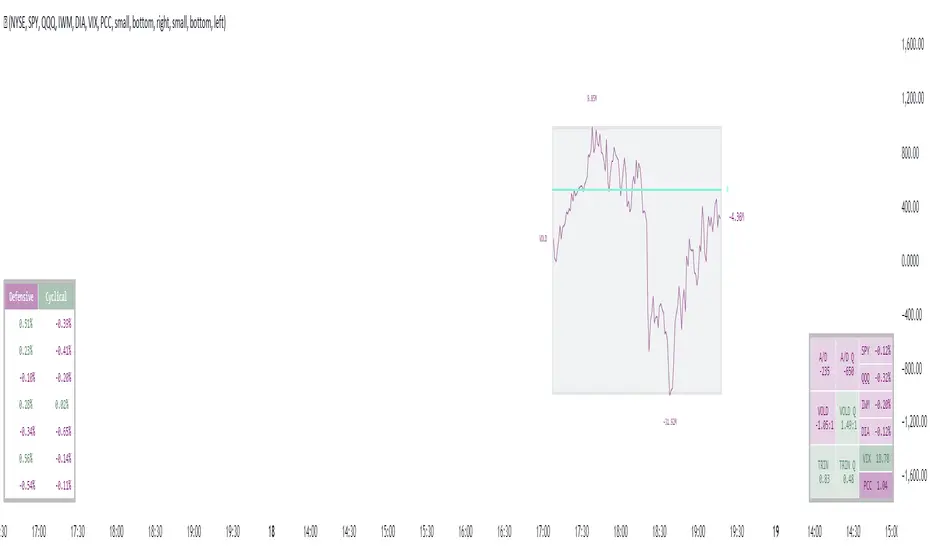
Tick+ is an all-in-one market internals dashboard.
Tick+ features a real-time NYSE or NASDAQ Tick chart, a dynamic Advancers/Decliners vs. VOLD chart, a market internals table readout including both NYSE and NASDAQ instruments, defensive and cyclical sector’s, and daily inflow/out analysis. Also included are customizable symbols readouts, so you can keep an eye on securities that are important to you!
The Tick chart displays a candlestick TICK chart for your chosen exchange and keeps track of the current day's high tick and low tick. Drawn behind these are our Key Reversal Zones.
The Advancers/Decliners vs. VOLD chart dynamically scales both instruments together to easily detect divergences that are known to cut the noise from the market and give an accurate indication of the day's trend.
Market Sync Indicator
This is a small but powerful indicator that analyzes the inflow and outflow of each exchange's underlying securities. When all the markets are in harmony, it will print a green or red symbol below the tick chart. We have also included this signal within the internals table labeled “trending,” which is simply the same signal presented in a more apparent area. Alerts can also be set with these signals to take advantage of the system across tickers.
Note: A gray readout indicates that every market is not moving in the same direction at that moment.
This indicator has been made to be customizable to fit your individual layout style! You are able to stack the Tick & Comparison Charts, as well as display the tables vertically or horizontally!
Note: We are measuring % change of symbols from the daily open to current price, this is so you can make an analysis based on today's info.
All of the default settings are our recommended settings.
Please check the Author Instructions Below for how to gain access to our indicators.
Moving Average Suite + VWAP + TICKThis indicator combines some of the commonly used moving averages, VWAP, and TICK sentiment, all of which are useful for all types of trading
By default, this indicator includes:
- 21/50/100/200 period smoothed simple moving average
- great for determining trends
- also act as support / resistance line for price
- 9 period exponential moving average
- fast trend / direction indicator
- Volume Weighted Average Price
- no explanation required
- $TICK sentiment as background fill
- overall market sentiment and direction
- +/- 500 levels are colored green/red and are usually indication of institutional order flow --> critical for trading indexes such as SPY or QQQ
- deep green/red background indicates +/-1000 on the $TICK, which are usually associated with overbought or oversold

Litt Tick InternalsThe Litt Tick Internals uses the NYSE Cumulative Tick to show traders the number of stocks that are rising vs the number of stocks that are falling on the New York Stock Exchange. The Litt Tick Indicator allows traders to more easily read the TICK Index chart. It does this by showing traders colored tick candles and overbought / oversold areas. Green candles mean that the current TICK trend is UP and Red candles mean that the
current TICK trend is DOWN. Readings that occur in the overbought or oversold areas mean that the market is showing great strength or great weakness. Typically when we get into these zones we can see potential reversals; however, sometimes the strong readings are indicating that a very strong trend is taking place and the trend could continue. That is why it is best to pair this indicator with other tools to enhance its usefulness.
The Litt Tick Interals are meant to be used ONLY small intraday timeframes (1min - 5min) and ONLY on U.S. equities or U.S. equity options. The NYSE TICK index only runs during U.S. Market Hours; therefore, the Litt TICK Internals will only work from 0930-1600 EST.

Time and SalesThis scrip mimics time and sales window displaying tick by tick data coming from the exchange.
It only works when the market is open. And it does not store historical data.
Red color when the last price was higher than the new price.
Gray when both were same.
Green when new price is higher than last price.
Please note that I have tested this in India NSE Market Only. If you find anything buggy let me know in the comments, I will try to update it.

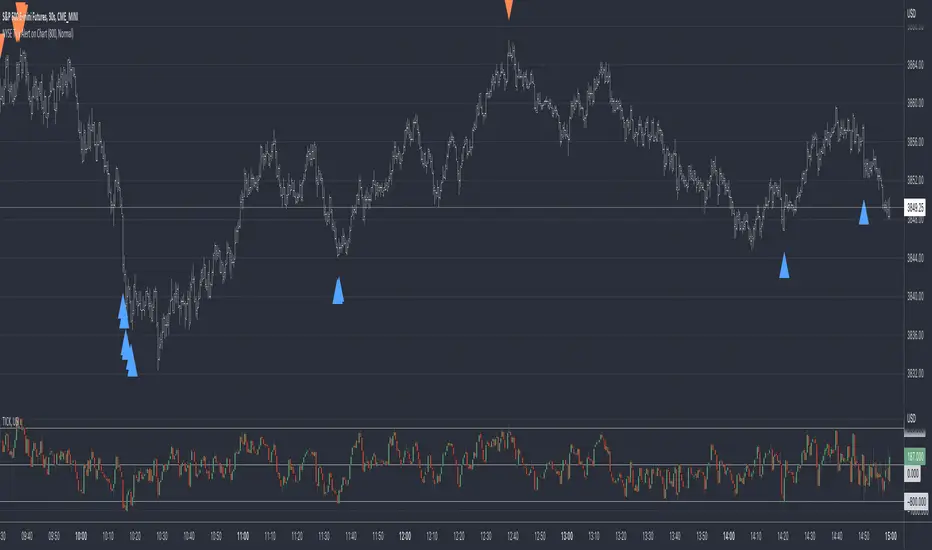
1k TICK arrowsThis plots green up arrows when the TICK index goes to -1,000 or lower or red down arrows when the TICK index goes +1,000 or higher. Can be used as a short term reversal signal (not investment advice). Will unfortunately plot on all charts but should only be relevant for US equity indices, mainly S&P500/ES futures. Indicator will adapt to the charts time frame and is hard coded to only show during 9:30-16:00 EST.
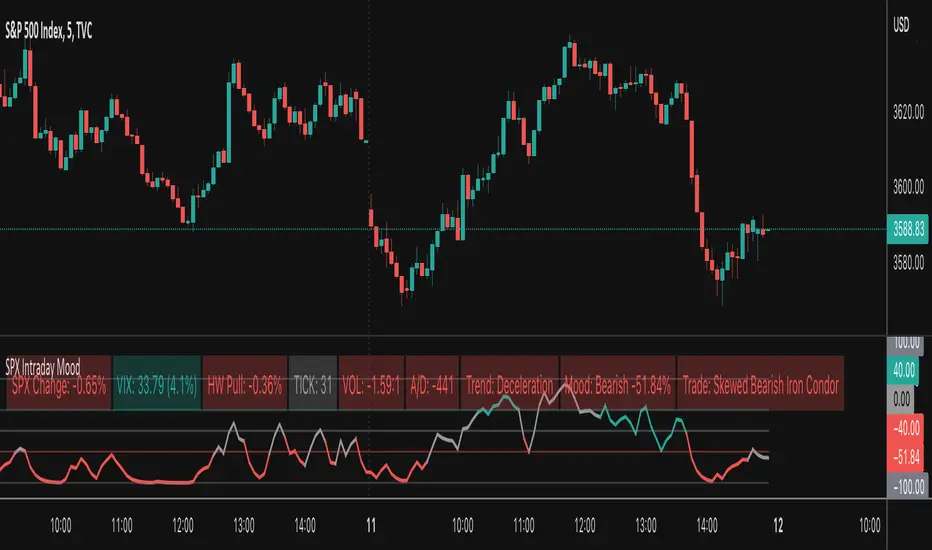
SPX Intraday Mood IndicatorThe SPX Intraday Mood Indicator tries to gauge the intraday market direction of the S&P 500 (SPX) by focusing on internal market data.
Based on the 0DTE Mood Indicator concept. Overall strength/weakness is converted into a directional Mood Percentage which can help with choosing a trade type.
Use at your own risk and discretion. Potential trade ideas offer no guarantees. Intraday Charts Only. Turn off extended hours data. Only works on SPX.
This first version is untested and I am only sharing it to gather feedback on its accuracy, use at your own risk.