Zonas de Liquidez Pro + Puntos de GiroAnalysis of Your BTC/USDT 4H Chart
Here’s the breakdown of the liquidity zones shown on your chart and what each element means:
🔴 Resistance Zones (Red Lines)
R 126199.43 – Upper dotted line
Level: ~$126,199
Strength: = Moderate zone
Touch count: 1 touch | 1 rejection
Meaning: Weak resistance, price has only reacted here once.
Dotted line = few historical rejections.
R 111263.81 – Thick solid red line
Level: ~$111,263
Strength: = Strong zone
Touch count: 3 touches | 2 rejections
Meaning: Major resistance level, strongly defended multiple times.
Solid, thicker line = very respected zone.
R 111250.01 – Solid red line (high strength)
Level: ~$111,250
Strength: = Extremely strong
Touch count: 5 touches | 4 rejections
Meaning: This is a critical zone, heavy liquidity stacked here.
Score 19 = institutional-grade liquidity zone.
R 107508.00 – Lower dotted line
Level: ~$107,508
Strength: = Strong zone
Touch count: 4 touches | 1 rejection
Meaning: Previously acting as resistance, now above current price.
💧 “LIQ” Markers – Liquidity Grabs
The yellow LIQ tags signal liquidity grabs.
Pattern detected:
Price taps the strong resistance around $111,263
Wicks above → triggers stop-losses
Closes back below → fake breakout
High volume → institutional stop-hunting
This led directly to the strong downside move.
🎯 Current Price Context
Current price: ~$91,533
Price is below all major resistance zones
Market structure is bearish
Price is far from major liquidity areas
📉 What Happened
The 111k resistance cluster acted as a massive ceiling
Multiple failed breakouts = institutional selling
Liquidity grabs at the top → trap for late buyers
Price then dumped from $111k to $91k (≈ -18%)
🎲 Probable Scenarios
Bullish Scenario 📈
If price returns to the $107,508 zone → first resistance test
Break with volume → target $111,250
Needs a confirmed close above to validate a breakout
Bearish Scenario 📉
If demand remains weak → continuation lower
Watch for new demand zones forming below price
Rejection from $107k–$111k would confirm bearish continuation
🔍 Key Signals to Watch
Bullish:
Price revisits resistance zone
Liquidity grab below support (fake breakdown)
Strong close back above with volume
Bearish:
New lows below $91k
Volume increasing on down moves
New resistance forming overhead
💡 Trading Approach
If you're a buyer (long bias):
Wait for price to pull into a strong demand zone
Look for bullish rejection + volume
Stop-loss below the zone
If you're a seller (short bias):
Ideal entry already happened at 111k (liquidity trap)
Look for a pullback into $107k–$111k
Watch for bearish rejection signs
Conservative Approach
Don’t trade in the middle of nowhere
Wait for price to reach a liquidity zone
Liquidity zones act as magnets → safest places to form trades
🎓 Key Takeaways
High-score zones like are extremely difficult to break → respect them
Liquidity grabs signaled the reversal perfectly
Strong rejections at 111k = smart money unloading
Thicker solid lines = more reliable levels
Wave Analysis

BPR (Ballanced price range) DetectorHow This BPR Detector Works
This indicator is designed to detect and visualize balanced price ranges (BPRs) on price charts. The indicator has two main components:
Regular FVG Detection - The indicator first detects regular Fair Value Gaps in price action, which are spaces where price has moved quickly leaving a gap. This is necessary because BPRs are derived from regular FVGs.
BPR Detection - When the price action inverts and moves through a regular FVG in the opposite direction, the indicator identifies this as a BPR. This concept is important in Inner Circle Trader (ICT) methodology as it can signal potential changes in trend direction. Additionally the detection logic is refined by incorporating displacement.
The main functionality preserved includes:
Detection of regular FVGs (required to find BPRs)
Conversion of regular FVGs to BPRs when price moves through them creating a FVG in the opposite direction
Visual display of both FVG and BPR zones
Mitigation tracking for both types of imbalances
Displacement visualization that helps identify energetic price moves
Key Settings
FVG Settings - Control the appearance and behaviour of regular Fair Value Gaps
BPR Settings - Control the appearance of Breaker Price Ranges (which have different colours by default)
Mitigation Settings - Define how the indicator determines when an imbalance has been filled
Displacement Settings - Optional highlighting of energetic price moves that may lead to imbalances

Hybrid Flow Master📊 Hybrid Flow Master - Professional Trading Indicator
Overview
Hybrid Flow Master is an advanced all-in-one trading indicator that combines Smart Money Concepts, institutional order flow analysis, and multi-timeframe confluence scoring to identify high-probability trade setups. Designed for both scalpers and swing traders across all markets (Forex, Crypto, Stocks, Indices).
🎯 Key Features
1. Intelligent Confluence System (0-100% Scoring) Proprietary scoring algorithm that weighs multiple factors Only signals when minimum confidence threshold is met
Real-time probability calculations for each setup Signal quality grading: A+, A, B, C ratings
2. Smart Money Concepts (SMC)
Automatic Order Block detection (bullish/bearish) Fair Value Gap (FVG) identification
Market structure analysis (Higher Highs, Lower Lows) Swing high/low tracking with visual markers
3. Multi-Timeframe Analysis
Higher timeframe trend filter for confluence Customizable HTF periods (1H, 4H, Daily, etc.)
Prevents counter-trend trades Aligns entries with major trends
4. Volume Flow Analysis
Volume spike detection with customizable thresholds Volume delta calculations (buying vs selling pressure) Institutional footprint identification Background highlighting for high-volume bars
5. Advanced Risk Management
ATR-based stop loss calculation Automatic take profit levels Customizable risk/reward ratios (1:1, 1:2, 1:3+) Visual SL/TP lines on chart Position sizing guidance
6. Professional Dashboard
Real-time HUD displaying:
Market bias (Bullish/Bearish/Neutral)
Higher timeframe trend status
Current confluence percentage
Volume status (Normal/High)
RSI reading with color coding
ATR volatility measure
Signal quality grade
7. Smart Alert System
Bullish confluence signals
Bearish confluence signals
Volume spike notifications
Customizable alert messages
Works with mobile app notifications
📈 What Makes It Unique?
✅ No Repainting - All signals are confirmed and final
✅ Probability-Based - Shows confidence level, not just binary signals
✅ Multi-Factor Confluence - Combines structure, volume, momentum, and HTF analysis
✅ Clean Interface - Toggle individual components on/off
✅ Works on All Timeframes - From 1-minute scalping to daily swing trading
✅ Universal Markets - Forex, Crypto, Stocks, Indices, Commodities
🎨 Customization Options
Adjustable swing detection length
Volume threshold settings
Minimum confluence score filter
Custom color schemes
Dashboard position (4 corners)
Show/hide individual components
Risk/reward ratio adjustment
ATR multiplier for stops
📊 Best Used For:
✔️ Scalping (1m - 15m charts)
✔️ Day Trading (15m - 1H charts)
✔️ Swing Trading (4H - Daily charts)
✔️ Trend Following
✔️ Reversal Trading
✔️ Breakout Trading
💡 How to Use:
Add indicator to chart - Works immediately with default settings Set your timeframe - Choose your trading style Wait for signals - Green BUY or Red SELL labels with confidence %
Check confluence score - Higher % = better quality setup Review dashboard - Confirm market bias and HTF trend Manage risk - Use provided SL/TP levels or adjust to your preference
Set alerts - Get notified of high-probability setups
⚙️ Recommended Settings:
For Scalping (1m-5m):
Swing Length: 5-7
Min Confluence: 70%
HTF: 15m or 1H
For Day Trading (15m-1H):
Swing Length: 10-15
Min Confluence: 60%
HTF: 4H or Daily
For Swing Trading (4H-Daily):
Swing Length: 15-20
Min Confluence: 50-60%
HTF: Weekly
📚 Indicator Components:
✦ Market Structure Detection
✦ Order Block Identification
✦ Fair Value Gaps (FVG)
✦ Volume Analysis
✦ RSI (14)
✦ MACD (12, 26, 9)
✦ ATR (14)
✦ Multi-Timeframe Trend
✦ Confluence Scoring Algorithm
🚀 Performance Notes:
Optimized for speed and efficiency Minimal CPU usage Clean chart presentation
Limited drawing objects (no chart clutter) Works on all TradingView plans
⚠️ Important Notes:
This indicator is a tool to assist trading decisions, not financial advice Always use proper risk management (1-2% per trade recommended) Backtest on your preferred market and timeframe
Combine with your own analysis and strategy Past performance does not guarantee future results
🔔 Alert Setup:
Right-click indicator name → "Add Alert" → Choose:
"Bullish Confluence Signal" for buy setups
"Bearish Confluence Signal" for sell setups
"Volume Spike Alert" for unusual activity
💬 Support:
For questions, suggestions, or custom modifications, feel free to message me directly through TradingView.

Keltner Channels - signal providerThis enhanced channel for pro traders visually indicates enhanced entry or exit signal based on the position of the underlying within the channel. Remember: EVERY TREND HAS ITS RETRACEMENTS - with this indicator you will avoid entering in full uptrend (bearing more downside risk than upside) or exiting (shorting) at max downtrend.
To be used together with the trend on higher timeframes (especially for the interpretation of the baseline)
Upper part = potential sell signal (especially in overall downtrends)
Lower part = potential buy signal (especially in overall uptrends)
Basis = potential buy signal (especially in strong uptrends)
= potential sell signal (especially in overall downtrends)

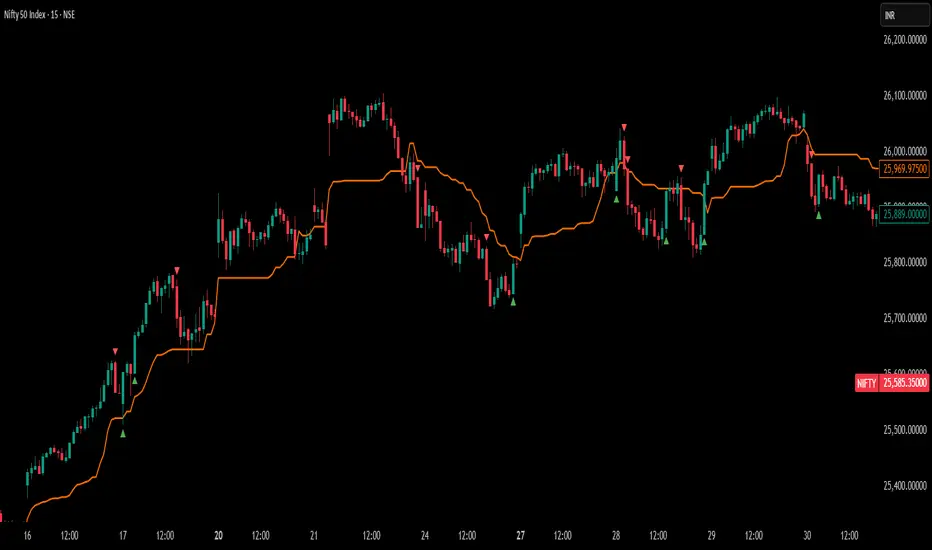
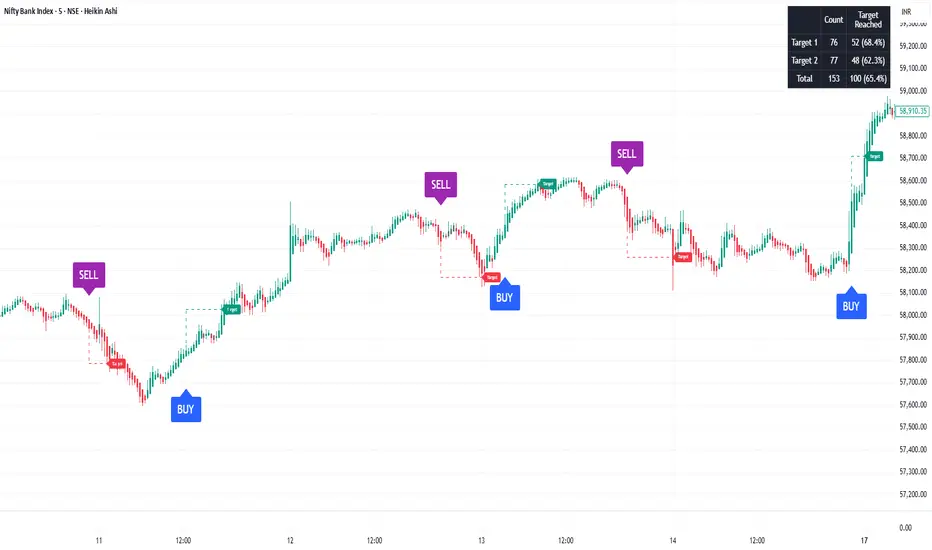
SoopAlgo — Premium Buy & Sell Targets (v6)SoopAlgo — Premium Targets (v6)
Description / Usage:
SoopAlgo — Premium Targets is a powerful trading tool designed to provide clear and actionable buy and sell signals directly on your chart. It highlights optimal entry points with distinct labels and automatically plots target levels, helping traders plan exits with precision.
Advantages:
Clear Visual Signals: Buy and sell opportunities are displayed prominently, reducing confusion and improving decision-making speed.
Integrated Target Levels: Automatic target lines allow traders to set realistic profit expectations without manual calculations.
Customizable Alerts: Receive alerts when signals occur, ensuring you never miss a trade opportunity.
Clean, Modern Display: Minimal clutter with intuitive color-coding (Buy in blue, Sell in purple) for easy chart readability.
Flexible Settings: Easily adjust target distances, label sizes, and indicator sensitivity to fit different trading styles.
Ideal For:
Traders who want a streamlined, easy-to-read tool for spotting market entries and exits with visual targets and alerts, while keeping the chart clean and focused.
Monitor Posición Bollinger Multi-TFThis indicator provides a comprehensive dashboard that allows you to monitor the price position relative to Bollinger Bands across 7 different timeframes simultaneously, without the need to switch charts.
It uses the %B (Percent B) logic to normalize the price position, giving you an instant "Heatmap" view of the market state (Overbought/Oversold) from the 1-minute chart up to the Weekly chart.
Key Features:
Multi-Timeframe Monitoring: Watch 1m, 5m, 15m, 1h, 4h, Daily, and Weekly timeframes in a single panel.
Dynamic Color Coding:
Dark Red: Price breaking above the Upper Band (>100%).
Light Red: Price near the Upper Band (Resistance zone).
Gray: Price in the neutral middle zone.
Light Green: Price near the Lower Band (Support zone).
Dark Green: Price breaking below the Lower Band (<0%).
Trend Arrows: Indicates momentum (▲ or ▼) based on the previous candle's position.
Current Timeframe Highlight: Automatically highlights the row corresponding to your current chart view in orange.
Fully Customizable: Adjust Bollinger settings (Length, Mult), choose your preferred timeframes, and change the table position/size.
Movable Panel: Includes X/Y offset settings to prevent the table from blocking price action or menu buttons.
How to Use:
Add the indicator to your chart.
Use the dashboard to spot confluence across timeframes.
Example: If 15m, 1H, and 4H are all showing Red, the asset is likely overextended to the upside.
Example: If the lower timeframes are turning Green while the higher timeframes remain Gray/Bullish, it might indicate a pullback opportunity.
Settings:
Bollinger Config: Length (20) and Multiplier (2.0) by default.
Timeframes: Select the 7 specific TFs you want to track.
Visuals: Change table position, text size, and offset coordinates.
This tool is essential for scalpers and day traders who need situational awareness across multiple fractals instantly.

MACD Divergence auto displayed on chart, with alertsMACD Pivot Divergence Detector
This tool identifies MACD histogram divergences based on confirmed pivot highs and lows.
Instead of comparing swing points on the MACD line, this script focuses specifically on the histogram, which measures momentum shifts between MACD and Signal.
How it works
The script detects confirmed pivots using a two-bar swing structure.
When price breaks above a previous pivot high, the script compares the MACD histogram value at that pivot to the current histogram value:
• If price makes a higher high while the histogram makes a lower high, a potential bearish divergence is marked.
The reverse logic is applied for bullish divergence when price breaks below a pivot low.
What makes this script unique
It uses pivot-confirmed histogram values, not lookback-based divergence.
It evaluates divergence only at actual highs/lows, reducing false positives.
It marks divergence directly on the candles for visual clarity.
Alert conditions are included for automated detection.
How to use
Bullish signals may highlight potential momentum loss in downtrends; bearish signals may highlight momentum loss near highs. Divergence does not guarantee reversal and should be combined with broader context, structure, or trend analysis.

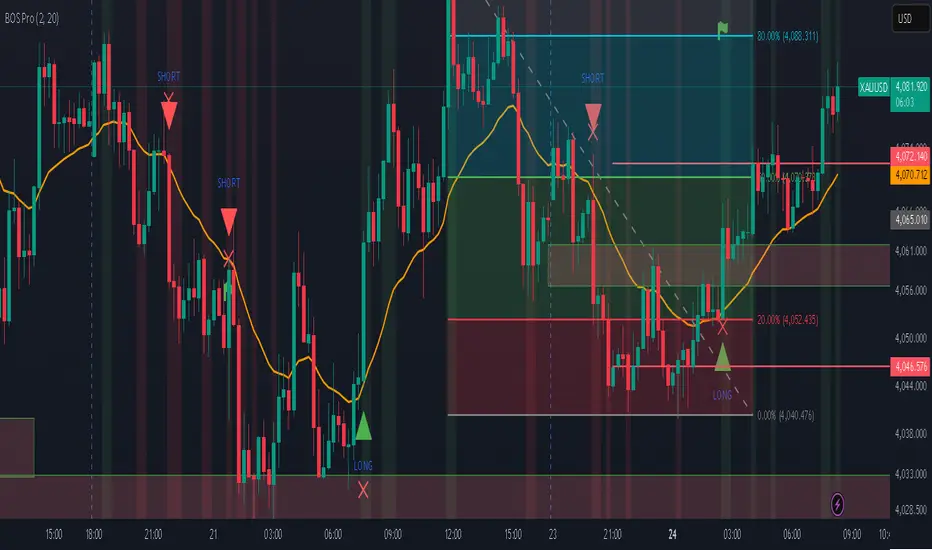
Professional BOS IndicatorThis is a trend following indicator that focuses on BOS, pullback and entry
Price Action - LegsRooted in Al Brooks' leg counting philosophy from "Trading Price Action Trends," this draws zigzag lines connecting swing points: green for up legs (until low < previous low), red for down legs (until high > previous high). Updates dynamically to new extremes, with optional count labels (0 resets on stronger pivots). Visualizes twists in channels or ranges—markets always test with two legs; use for pullback entries or reversals.

Price Action - H/L BarBased on Al Brooks' "Bar by Bar" (Chapter 09A, p.45-50) and "Trends" (p.98-105), this marks H (higher high with close above mid) and L (lower low with close below mid) swings. Marking pauses after each, resuming on pullback. Labels "H" above and "L" below bars for swing counting in trends or ranges. Key: Markets form two legs—use for measured moves or failed breakouts, always in context of prior extremes.

Swing High-Low Line ConnectorSwing High-Low Line Connector is a simple and intuitive tool that automatically detects swing highs and swing lows using fractal-style pivot logic and connects them with clean, continuous lines. This indicator helps traders visualize market structure, trend shifts, and swing-based support/resistance levels at a glance.
The script identifies each confirmed swing point based on a user-defined lookback window (left/right bars). When a new swing is confirmed, the indicator updates the previous leg or creates a new one, effectively drawing the classic “zigzag-style” connections used in discretionary trading and price-action analysis.
A dynamic tail extension is included to show the most recent swing extending toward the current price. By default, the tail follows a ZigZag-style logic—extending upward after a swing low and downward after a swing high—but users can also anchor it to Close, High, Low, or HL2.
Features
Automatic detection of swing highs and swing lows
Clean line connections between swings (similar to discretionary market-structure mapping)
Proper consolidation handling: weaker highs/lows are ignored
Optional ZigZag-style dynamic tail extension
Fully customizable lookback window, line color, and line width
Works on any market and timeframe
Use Cases
Identifying market structure (HH, HL, LH, LL)
Visualizing trend transitions
Spotting breakout levels and swing-based support/resistance
Aiding discretionary swing trading, trend following, or pattern recognition
This indicator keeps the logic simple and visual—ideal for traders who prefer clean chart structure without unnecessary noise.

Smart Cloud by Ilker (Custom Matriks)A Proprietary Hybrid Trend System for All Major Financial Assets
This indicator, originally developed for the Matriks platform, is a highly effective hybrid trend identification system designed for day-to-day analysis across all major asset classes, including Stocks, Forex, Indices, and Cryptocurrencies. It combines the forward-looking principle of the Ichimoku Kinko Hyo Cloud with heavily smoothed Moving Averages (MAs) to create a clear, visually guided trading signal. (Daily Timeframe recommended for optimal results).
📊 Algorithmic Structure and Parameters
The "Smart Cloud" utilizes six primary user-adjustable parameters that govern its sensitivity and shape, moving away from standard Ichimoku settings to provide a robust, customized trend view:
P1, P2, P3 (60, 56, 248): These long-term settings define the core structure and width of the cloud, acting as the primary dynamic support and resistance zone. The significantly longer P3 (Lagging Period) ensures the cloud reflects strong, deep market cycles.
P4 (Displacement 26): Maintains the traditional Ichimoku principle of projecting the cloud 26 periods forward to provide a predictive view of future trend support/resistance.
P5 (MA50 - Blue) & P6 (MA10 - Purple): These are the two primary Moving Averages plotted inside the cloud. They serve as fast-response momentum lines:
P5 (MA50): Represents the middle-term trend average.
P6 (MA10): Represents the short-term market momentum.
📈 Core Trend and Signal Interpretation
The indicator provides powerful trend identification based on three key components:
The Cloud (Kumo):
Green Cloud (Bullish): Indicates the dominant trend is up, suggesting dynamic support for price action.
Red Cloud (Bearish): Indicates the dominant trend is down, suggesting dynamic resistance.
The thickness and slope of the cloud are key indicators of trend strength.
MA Crossover Signal (Blue/Purple):
Buy Signal: When the faster Purple MA (P6=10) crosses above the slower Blue MA (P5=50).
Sell Signal: When the faster Purple MA (P6=10) crosses below the slower Blue MA (P5=50).
Price Action & Confirmation:
The most powerful signals occur when a MA Crossover is confirmed by price breaking out of the cloud in the same direction.
Price above the cloud and MA crossover to the upside suggests a strong buy entry.
Disclaimer: This tool is intended for analysis and decision-making support. It is not financial advice. Always use stop-loss orders and manage your risk accordingly.

Cumulative Volume Delta (HA Option)# **📘 Ultimate Guide to Trading With CVD Heikin Ashi (CVD+)**
## **🔍 What This Indicator Shows**
This tool plots **Cumulative Volume Delta (CVD)** as candlesticks—optionally transformed into **Heikin Ashi CVD candles**.
Instead of price, each candle represents the *battle between buyers and sellers* within your chosen timeframe.
**Volume Delta = Buying Volume – Selling Volume**
CVD takes all deltas and stacks them cumulatively, showing who is controlling the auction *over time*.
With Heikin Ashi smoothing layered on top, trend detection becomes cleaner, letting you see the “true pressure” behind price moves.
---
# **💡 Why CVD Is a Game Changer**
Most traders only see price.
Serious traders watch **pressure**.
CVD exposes what price hides:
* Absorption
* Hidden accumulation
* Seller exhaustion
* Fake breakouts
* True reversals
* Momentum strength / weakness
* Smart money footprint
When combined with Heikin-Ashi smoothing, you get delta trends with way less noise and fewer fake flips.
---
# **📈 How to Actually Use It (The Edge)**
## **1. Spot True Trend vs. Fake Trend**
If **price goes up** but **CVD goes down**, that’s:
* Passive sellers absorbing
* A weak rally
* High probability of reversal
If **price pulls back** but **CVD keeps rising**, that’s:
* Secret accumulation
* A continuation setup
* Great dip-buy opportunity
**Rule of thumb:**
🔹 *Follow the CVD trend, not the price noise.*
---
## **2. Catch Reversals Early**
Watch for:
### **🔻 Bearish Reversal Signals**
* CVD makes a **lower high**
* Heikin Ashi CVD prints **red bodies with rising upper shadows**
* Price makes one final push up on low delta
This is classic distribution → the drop usually follows fast.
### **🔹 Bullish Reversal Signals**
* CVD forms a **higher low**
* HA CVD flips from red to green with full bodies
* Price still looks weak = bottom forming
This is exactly how pros catch bottoms early.
---
## **3. Identify Absorption Levels**
If price hits a level multiple times but CVD keeps climbing (or falling), that level is being defended.
Example:
* Price stalls at support
* CVD keeps rising
= **Buyers absorbing sells → high-probability bounce**
Opposite works for resistance.
---
## **4. Validate Breakouts**
A breakout with *weak or negative CVD* is usually a trap.
A breakout with **strong, rising HA CVD** is real.
If CVD diverges from the breakout direction → fade it.
If CVD confirms → ride it.
---
## **5. Use Heikin Ashi to Stay in Trends**
HA smoothing removes the nasty chop of raw delta data.
Look for:
* Consecutive **full-body teal candles = strong buying wave**
* Consecutive **full-body red candles = strong selling wave**
* Small-bodied candles after a trend = momentum dying
This keeps you in winners longer and cuts losers faster.
---
# **🎯 Practical Trading Playbook**
### **A) Long Setup**
1. Price pullback into support
2. CVD stays bullish or makes a higher low
3. HA CVD flips green or prints a strong body
4. Enter long
5. Stop under CVD structural low
### **B) Short Setup**
1. Price pushes into resistance
2. CVD forms bearish divergence
3. HA CVD prints red bodies
4. Enter short
5. Stop above CVD swing high
### **C) Chop Filter**
No clear HA CVD trend = avoid trading → stop donating money to the market.
---
# **🧠 Tips for Mastery**
* Use lower timeframe delta (1m–5m) for scalping entries
* Use a higher anchor timeframe (1D) to define direction
* When price trends but CVD is flat → expect a fakeout
* When CVD trends but price is flat → expect a breakout
* Trade WITH delta, fade AGAINST delta
---
# **⚠️ Important Notes**
* Crypto = full tick-by-tick volume → CVD is extremely accurate
* Stocks = depends on your broker/data vendor
* Futures = best signal-to-noise ratio
* If your symbol has no volume → indicator will warn you
---
# **📥 Recommended Settings**
* **Anchor timeframe**: 1D or 4H
* **Lower timeframe**: 1m, 3m, or 5m
* **Heikin Ashi**: ON for trend filtering, OFF for raw delta
---
# **🔥 Final Word**
Price can lie.
Delta usually doesn’t.
CVD + Heikin Ashi gives you the closest thing to reading the market’s heartbeat in real time.
Use it to confirm breakouts, detect reversals early, identify real trend strength, and avoid getting caught in manipulation.
If you learn to read CVD well…
you stop trading price, and start trading the **intent** behind the price.

Wick-RSI-CandleBody_SEZERthis strategy is ideal to recognize peaks for both long and short positions in 1h and 4h periods. for quick response and faster trade, please use 15m period but keep in mind targeting lower profits. otherwise you may lose your profit.


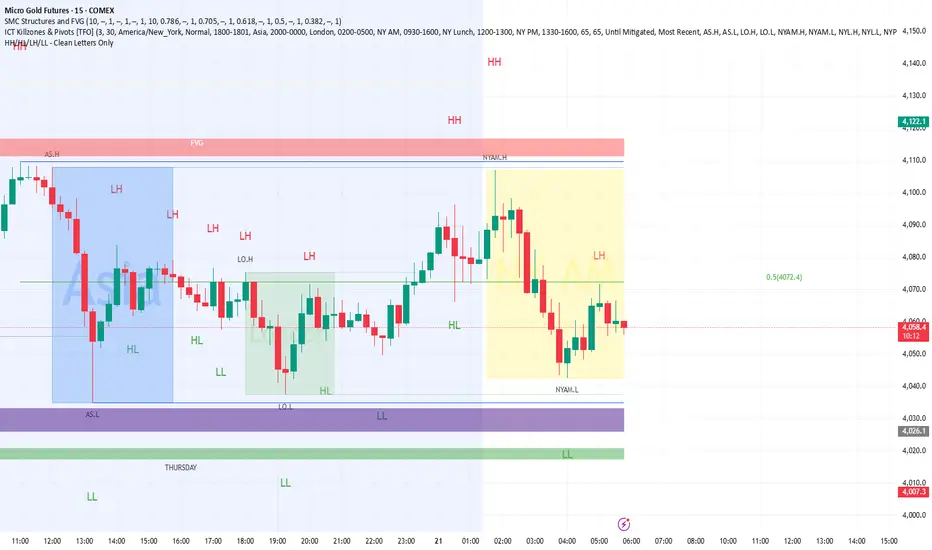
HH/HL/LH/LL - Bigger Letter MArkingAlam's Money
//@version=6
indicator("HH/HL/LH/LL - Clean Letters Only", overlay = true, max_labels_count = 500)
// Pivot confirmation bars (fixed)
L = 2
R = 2
// Confirmed pivots (appear R bars after turn)
sh = ta.pivothigh(high, L, R)
sl = ta.pivotlow(low, L, R)
// Keep last confirmed swing values
var float lastHigh = na
var float lastLow = na
// Swing highs → HH / LH
if not na(sh)
if na(lastHigh)
lastHigh := sh
else
string txtH = sh > lastHigh ? "HH" : "LH"
label.new(bar_index - R, sh, txtH, xloc.bar_index, yloc.price, color.new(color.white, 100), label.style_label_down, color.red, size.large)
lastHigh := sh
// Swing lows → HL / LL
if not na(sl)
if na(lastLow)
lastLow := sl
else
string txtL = sl > lastLow ? "HL" : "LL"
label.new(bar_index - R, sl, txtL, xloc.bar_index, yloc.price, color.new(color.white, 100), label.style_label_up, color.green, size.large)
lastLow := sl
Test shift level strategyTesting this on all timelines where in it checks the candle color and takes call to buy or sell

Forex Session TrackerForex Session Tracker - Professional Trading Session Indicator
The Forex Session Tracker is a comprehensive and visually intuitive indicator designed specifically for forex traders who need precise tracking of major global trading sessions. This powerful tool helps traders identify active market sessions, monitor session-specific price ranges, and capitalize on volatility patterns unique to each trading period.
Understanding when major financial centers are active is crucial for forex trading success. This indicator provides real-time visualization of the Tokyo, London, New York, and Sydney trading sessions, allowing traders to align their strategies with peak liquidity periods and avoid low-volatility trading windows.
---
Key Features
📊 Four Major Global Trading Sessions
The indicator tracks all four primary forex trading sessions with precision:
- Tokyo Session (Asian Market) - Captures the Asian trading hours, ideal for JPY, AUD, and NZD pairs
- London Session (European Market) - Monitors the most liquid trading period, perfect for EUR, GBP pairs
- New York Session (American Market) - Tracks US market hours, essential for USD-based currency pairs
- Sydney Session (Pacific Market) - Identifies the opening of the trading week and AUD/NZD activity
Each session is fully customizable with individual color schemes, making it easy to distinguish between different market periods at a glance.
🎯 Session Range Visualization
For each active trading session, the indicator automatically:
- Draws rectangular boxes that highlight the session's time period
- Tracks and displays session HIGH and LOW price levels in real-time
- Creates horizontal lines at session extremes for easy reference
- Positions session labels at the center of each trading period
- Updates dynamically as new highs or lows are formed within the session
This visual approach helps traders quickly identify:
- Session breakout opportunities
- Support and resistance zones formed during specific sessions
- Range-bound vs. trending session behavior
- Key price levels that institutional traders are watching
📱 Live Information Dashboard
A sleek, professional information panel displays:
- Real-time session status - Instantly see which sessions are currently active
- Color-coded indicators - Green dots for active sessions, gray for closed sessions
- Timezone information - Confirms your current timezone settings
- Customizable positioning - Place the dashboard anywhere on your chart (Top Left, Top Right, Bottom Left, Bottom Right)
- Adjustable size - Choose from Tiny, Small, Normal, or Large text sizes for optimal visibility
The dashboard provides at-a-glance awareness of market conditions without cluttering your chart analysis.
⚙️ Extensive Customization Options
Every aspect of the indicator can be tailored to your trading preferences:
Session-Specific Controls:
- Enable/disable individual sessions
- Customize colors for each trading period
- Adjust session times to match your broker's server time
- Toggle background highlighting on/off
- Show/hide session high/low lines independently
General Settings:
- UTC Offset Control - Adjust timezone from UTC-12 to UTC+14
- Exchange Timezone Option - Automatically use your chart's exchange timezone
- Background Transparency - Fine-tune the opacity of session highlighting (0-100%)
- Session Labels - Show or hide session name labels
- Information Panel - Toggle the live status dashboard on/off
Style Settings:
- Turn session backgrounds ON/OFF directly from the Style tab
- Maintain clean charts while keeping all analytical features active
🔔 Built-in Alert System
Stay informed about session openings with customizable alerts:
- Tokyo Session Started
- London Session Started
- New York Session Started
- Sydney Session Started
Set up notifications to never miss important market opening periods, even when you're away from your charts.
---
How to Use This Indicator
For Day Traders:
1. Identify High-Volatility Periods - Focus your trading during London and New York session overlaps for maximum liquidity
2. Monitor Session Breakouts - Watch for price breaks above/below session highs and lows
3. Avoid Low-Volume Periods - Recognize when major sessions are closed to avoid false signals
For Swing Traders:
1. Mark Key Levels - Use session highs and lows as support/resistance zones
2. Track Multi-Session Patterns - Observe how price behaves across different trading sessions
3. Plan Entry/Exit Points - Time your trades around session openings for better execution
For Currency-Specific Traders:
1. JPY Pairs - Focus on Tokyo session movements
2. EUR/GBP Pairs - Monitor London session activity
3. USD Pairs - Track New York session volatility
4. AUD/NZD Pairs - Watch Sydney and Tokyo sessions
---
Technical Specifications
- Pine Script Version: 5
- Overlay Indicator: Yes (displays directly on price chart)
- Maximum Bars Back: 500
- Drawing Objects: Up to 500 lines, boxes, and labels
- Performance: Optimized for real-time data processing
- Compatibility: Works on all timeframes (recommended: 5m to 1H for session tracking)
---
Installation & Setup
1. Add to Chart - Click "Add to Chart" after copying the script to Pine Editor
2. Configure Timezone - Set your UTC offset or enable "Use Exchange Timezone"
3. Customize Colors - Choose your preferred color scheme for each session
4. Adjust Display - Enable/disable features based on your trading style
5. Set Alerts - Create alert notifications for session starts
---
Best Practices
✅ Combine with Price Action - Use session ranges alongside candlestick patterns for confirmation
✅ Watch Session Overlaps - The London-New York overlap (1300-1600 UTC) typically shows highest volatility
✅ Respect Session Highs/Lows - These levels often act as intraday support and resistance
✅ Adjust for Your Broker - Verify session times match your broker's server clock
✅ Use Multiple Timeframes - View sessions on both lower (15m) and higher (1H) timeframes for context
---
Why Choose Forex Session Tracker Pro?
✨ Professional Grade Tool - Built with clean, efficient code following TradingView best practices
✨ Beginner Friendly - Intuitive design with clear visual cues
✨ Highly Customizable - Adapt every feature to match your trading style
✨ Performance Optimized - Lightweight code that won't slow down your charts
✨ Actively Maintained - Regular updates and improvements
✨ No Repainting - All visual elements are fixed once the session completes
---
Support & Updates
This indicator is designed to provide reliable, accurate session tracking for forex traders of all experience levels. Whether you're a scalper looking for high-volatility windows or a position trader marking key institutional levels, the Forex Session Tracker Pro delivers the insights you need to make informed trading decisions.
Happy Trading! 📈
---
Disclaimer
This indicator is a tool for technical analysis and should be used as part of a comprehensive trading strategy. Past performance does not guarantee future results. Always practice proper risk management and never risk more than you can afford to lose. Trading forex carries a high level of risk and may not be suitable for all investors.

Elliott Wave + SMC Fusion # Elliott Wave + SMC Fusion
## TITLE:
Elliott Wave + Smart Money Concepts Fusion
---
## SHORT DESCRIPTION:
Automated Elliott Wave pattern detection with Smart Money Concepts confirmation, EWO oscillator integration, and confluence scoring system.
---
## FULL DESCRIPTION:
### 📊 OVERVIEW
This indicator combines three powerful trading methodologies into a unified system:
- **Elliott Wave Theory** - Automated detection of Wave 1-2 impulse patterns
- **Smart Money Concepts (SMC)** - Order Blocks and Fair Value Gaps for institutional confirmation
- **Elliott Wave Oscillator (EWO)** - Momentum-based signal validation
The core concept is to identify high-probability Wave 3 entries by detecting completed Wave 1-2 structures and validating them with SMC and momentum indicators.
---
### 🔧 HOW IT WORKS
**1. Pattern Detection (ZigZag Method)**
- Uses pivot high/low detection to identify swing points
- Validates Wave 2 retracement using Fibonacci ratios (default: 38.2% - 88.6%)
- Requires minimum wave size to filter noise
- Applies confirmation bars to avoid premature signals
**2. Wave Projections**
- Wave 3 target: Fibonacci extension of Wave 1 (default: 1.618)
- Wave 4 retracement: Percentage of Wave 3 (default: 38.2%)
- Wave 5 projection: Extension of Wave 1 from Wave 4
**3. Smart Money Validation**
- **Order Blocks**: Identifies last opposing candle before breakout (institutional footprint)
- **Fair Value Gaps**: Detects price imbalances for potential support/resistance
**4. EWO Confirmation**
- Calculates momentum: (EMA5 / EMA34 - 1) × 100
- Signal line crossovers confirm trend direction
- Strong signals occur at extremes (< -13 or > 13 threshold)
**5. Confluence Scoring (0-100%)**
Points awarded for:
- Fibonacci quality of Wave 2 retracement (10-30 pts)
- Order Block presence (15 pts)
- Fair Value Gap presence (10 pts)
- Volume confirmation (10-15 pts)
- Trend alignment with EMA50 (10 pts)
- EWO confirmation (10-20 pts)
---
### 🎯 UNIQUE FEATURES
**Pattern Locking System**
- Once a valid pattern is detected, it locks until:
- Pattern invalidates (price breaks Wave 0)
- Pattern completes (Wave 5 reached)
- Auto-timeout (configurable bars)
- Prevents rapid signal flipping and false alerts
**Signal Stability Controls**
- Adjustable cooldown between signals (default: 20 bars)
- Minimum bar distance between wave points
- Direction change requirement option
- Confirmation bars after Wave 2 formation
**Visual Wave Tracking**
- Solid lines for impulse waves (0→1, 2→3, 4→5)
- Dashed lines for corrective waves (1→2, 3→4)
- Numbered labels on each wave point
- Real-time projection lines to targets
**Comprehensive Dashboard**
- Current wave status and lock state
- Pattern grade (A+ to D based on confluence)
- Projected vs actual wave levels (✓ when completed)
- SMC confirmation status
- Risk/Reward ratio calculation
- EWO trend direction
---
### 📈 TRADING APPLICATION
**Entry Strategy**
- Wait for Wave 1-2 pattern detection (diamond signal)
- Check confluence score (>65% = higher probability)
- Verify EWO alignment with pattern direction
- Enter after 30% retracement of Wave 2 (customizable)
**Risk Management**
- Stop Loss: Below Wave 0 (with buffer)
- Take Profit 1: Wave 3 projection
- Take Profit 2: Wave 5 projection
- R:R displayed in dashboard
**Invalidation Rules**
- Price breaks below Wave 0 (bullish) or above (bearish)
- Wave 2 level violated before Wave 3 forms
- Pattern timeout exceeded
---
### ⚙️ KEY SETTINGS
**Elliott Wave**
- ZigZag Length: Pivot detection sensitivity
- Fib Tolerance: Acceptable retracement range
- Min Wave Size: Filter small movements
**Signal Stability**
- Signal Cooldown: Minimum bars between signals
- Lock Pattern Until Invalid: Prevent signal changes
- Confirmation Bars: Wait after Wave 2
**Wave Projection**
- Wave 3/4/5 Fibonacci extensions
- Projection display distance
**EWO Settings**
- Fast/Slow EMA lengths
- Signal smoothing
- Strength threshold
**SMC Settings**
- Order Block lookback period
- FVG minimum size percentage
---
### 🔔 ALERTS
- New bullish/bearish pattern detected
- High confluence setup (>75%)
- Pattern invalidation
- Wave completion
---
### ⚠️ IMPORTANT NOTES
- This indicator identifies **potential** Elliott Wave patterns based on mathematical rules
- Elliott Wave analysis is subjective - patterns may be interpreted differently
- Always combine with other analysis methods and proper risk management
- Past pattern performance does not guarantee future results
- Pattern locking prevents repainting but delays new pattern detection
- Best used on higher timeframes (1H+) for cleaner wave structures
---
### 📚 METHODOLOGY REFERENCES
**Elliott Wave Theory**
- Wave 2 typically retraces 38.2% - 88.6% of Wave 1
- Wave 3 is often the strongest, extending 161.8% of Wave 1
- Wave 4 usually retraces 38.2% of Wave 3
- Wave 5 completes the impulse structure
**Smart Money Concepts**
- Order Blocks represent institutional supply/demand zones
- FVGs indicate price inefficiencies that may act as magnets
**Elliott Wave Oscillator**
- Developed to identify wave momentum
- Crossovers signal potential wave transitions
- Extreme readings often coincide with wave completions
---
### 🎨 VISUAL ELEMENTS
- **Green**: Bullish patterns and projections
- **Red**: Bearish patterns and projections
- **Orange**: Wave projection levels
- **Purple**: Order Block zones
- **Yellow**: Fair Value Gaps
- **Blue**: Entry levels
- **Diamond shapes**: New pattern signals
- **Triangle shapes**: EWO crossover signals
---
### 💡 TIPS FOR BEST RESULTS
1. Use on liquid markets with clear trend behavior
2. Higher timeframes produce more reliable patterns
3. Look for confluence scores above 65%
4. Verify EWO alignment before entry
5. Consider market context (overall trend, key levels)
6. Adjust ZigZag length based on your trading style
7. Increase cooldown period for longer-term signals
---
**Indicator Type**: Overlay
**Markets**: All (Crypto, Forex, Stocks, Commodities)
**Timeframes**: All (1H+ recommended)
**Style**: Pattern Recognition + Momentum + Price Action

Slope Rank ReversalThis tool is designed to solve the fundamental problem of "buying low and selling high" by providing objective entry/exit signals based on momentum extremes and inflection points.
The System employs three core components:
Trend Detection (PSAR): The Parabolic SAR is used as a filter to confirm that a trend reversal or transition is currently underway, isolating actionable trade setups.
Dynamic Momentum Ranking: The indicator continuously measures the slope of the price action. This slope is then ranked against historical data to objectively identify when an asset is in an extreme state (overbought or oversold).
Signal Generation (Inflection Points):
Oversold/Buy: A 🟢 Green X is generated only when the slope ranking indicates the market is steeply negative (oversold), and the slope value begins to tick upwards (the inflection point), signaling potential mean reversion.
Overbought/Sell: A 🔴 Red X is generated only when the slope ranking indicates the market is steeply positive (overbought), and the slope value begins to tick downwards, signaling momentum exhaustion.
The core philosophy is simple: Enter only when the market is exhausted and has started to turn.

ECG PRICE - mauricioofsousa📉 ECG PRICE – The Price Electrocardiogram
(explained for traders, scientists, and complete beginners)
🔍 1. WHAT IS THE ECG PRICE?
The ECG PRICE protocol is a market-reading system based on the RSI, but with a surgical twist:
👉 You don’t just calculate RSI from price.
👉 You adjust the price using the RSI, and then calculate RSI over this adjusted price.
This creates a filtered, amplified signal that behaves like a heart monitor for price, detecting micro-impulses and subtle market movements long before they show up in the standard RSI.
🧬 2. CORE IDEA
Just like a real ECG amplifies and reveals electrical rhythms hidden inside the heartbeat,
the ECG PRICE amplifies micro-deformations hidden inside the price’s momentum.
It works in three stages:
Compute the regular RSI
Use the RSI to adjust the price (creating an electrocardiographic price)
Compute a second RSI over this modified price
The result is a meta-derived oscillator—more sensitive, more precise, and better at detecting structural changes.
🧩 3. TECHNICAL BREAKDOWN
3.1. First RSI (classic)
The script calculates:
average gains
average losses
relative strength (RS)
and then the standard 0–100 RSI
This is the “normal heart rate monitor” everyone uses.
3.2. Creating the “Adjusted Price”
adjustedPrice = close * (rsi / 100)
This means:
➡️ When RSI is high (strong buying momentum), price is amplified.
➡️ When RSI is low (strong selling momentum), price is compressed.
This converts raw price into a bio-electrical signal, where the price itself is modulated by its own internal momentum.
It’s the financial equivalent of ECG gain adjustment.
3.3. RSI of the Adjusted Price
Now the script calculates a new RSI from this modified price.
That is the actual ECG PRICE.
This second-order oscillator becomes extremely sensitive to:
micro-momentum shifts
early trend fading
volatility shocks
micro-divergences
institutional pressure waves
It reads the electrical pattern behind the price rather than the superficial movement.
🟩🟥 4. Diagnostic Lines of the Protocol
35 (green dotted)
Pre-oversold fatigue zone.
65 (red dotted)
Pre-overbought exhaustion zone.
30 (white solid)
Classic oversold.
70 (white solid)
Classic overbought.
Together they create two diagnostic corridors:
1. Medical corridor (30–70):
Standard RSI clinical range.
2. Electrical corridor (35–65):
The ECG-sensitive zone where micro-shifts appear first.
🧠 5. In Engineering Language (MGO style)
The ECG PRICE is essentially:
A nonlinear second-order oscillator where the RSI feeds back into price, creating a recursive momentum-modulated signal.
It functions like a:
bioinformational modulator
feedback-driven wave processor
impulse amplifier
micro-PID sensitivity enhancer
Very similar to the informational-wave transformations inside the MGO pipeline.
👨⚕️📉 6. Explained for a Total Beginner
Imagine the price is a heart.
The normal RSI shows if the heart is beating fast or slow.
But the ECG PRICE takes that heartbeat…
feeds it back into the heart…
and then measures the new heartbeat.
This creates a much more sensitive exam that detects problems before the normal test would.
💡 7. What It Gives You in Practice
earlier reversal signals
better trend-fatigue detection
clearer micro-divergences
a clean RSI with reduced noise
a smoother momentum curve
advanced behavioral readings before breakouts
It’s an upgrade.
A second-layer RSI that “hears” the inner electrical impulses of price.

VMMA Wave Edges [MTF]The VMMA Wave Edges is a multi-timeframe (MTF) overlay indicator that plots dynamic upper and lower edges formed by a band of Volume-Weighted Moving Averages (VWMAs) of varying lengths. It computes N VWMAs with lengths increasing arithmetically from start_len by incr, then plots:The maximum of all VWMAs → Upper Edge
The minimum of all VWMAs → Lower Edge
These edges are calculated on a higher timeframe (mtf_tf) and projected onto the current chart, creating a smooth, volume-sensitive envelope that adapts to volatility and trend strength.Use & InterpretationFeature
Purpose
Upper Edge
Dynamic resistance zone; price often reacts when approaching or breaking above.
Lower Edge
Dynamic support zone; price tends to bounce or consolidate near it.
Edge Contraction
Low volatility → potential breakout setup.
Edge Expansion
High volatility → trend continuation or exhaustion.
MTF Projection
Avoids repainting & noise by using cleaner higher-timeframe data.
Trading ApplicationsMean ReversionBuy near Lower Edge, sell near Upper Edge (especially in ranging markets).
Breakout ConfirmationPrice closing above Upper Edge on MTF → bullish breakout.
Below Lower Edge → bearish.
Trend FilterIn uptrend: price above Upper Edge → strong momentum.
In downtrend: price below Lower Edge → strong bearish control.
Support/Resistance FlipBroken Upper Edge → becomes future support (and vice versa).

Quantum Leap by GSK-Vizag-AP-IndiaQuantum Leap by GSK-Vizag-AP-India
This indicator detects strong impulse price movements, also known as "quantum leaps," in bullish and bearish directions. Using the Average True Range (ATR) to measure market volatility, it identifies candles with body sizes significantly larger than recent average ranges, suggesting strong momentum surges.
The script groups consecutive impulse candles into blocks, highlighting zones of sustained bullish or bearish strength on the chart. These visual blocks aid traders in quickly spotting powerful price moves that may indicate key market shifts or reversals. Additionally, this tool can be effectively used to identify Fair Value Gaps (FVG) in price action, making FVG detection easier and more intuitive for users.
Inputs allow customization for ATR length, impulse strength threshold, and minimum consecutive candles, enabling adaptation to different markets or timeframes.
Important Disclaimer:
This indicator is for educational and informational purposes only. It is not financial advice and does not guarantee future results. Users should conduct their own research and seek professional guidance before making any trading decisions. Trading involves risk, including the potential loss of capital.