The power of community
Get inspiration for your next trade. Don't reinvent the wheel.


IREDA NEAR BREAK OUT OF VCPIREDA
Rally - Base - Rally price action
1.First Rally, then forming Base in the VCP pattern (Volatility contraction) & then again expected Rally after break out of the neck line.
2. Close above previous day High(170.4)
3. Close above last week High(169.7)
4. Close above last month High(163.7)

BANKNIFTY Intraday Trade Setup For 24 Feb 2024BANKNIFTY Intraday Trade Setup For 24 Feb 2024
Bullish-Above 48310
Invalid-Below 48200
T- 48755
Bearish-Below 47890
Invalid-Above 48000
T- 47300
BANKNIFTY has closed almost on a flat note today. It opened with a big gap and was sold into immediately like yesterday. 10 o'clock range was to be used


MACD Crossover Swing Trade📊 Script: HINDUNILVR
📊 Sector: FMCG
📊 Industry: Personal Care - Multinational
⏱️ C.M.P 📑💰- 2231
🟢 Target 🎯🏆 - 2362
⚠️ Stoploss ☠️🚫 - 2172
📊 Script: KPIL
📊 Sector: Capital Goods - Electrical Equipment
📊 Industry: Transmission Line Towers / Equipment
⏱️ C.M.P 📑💰- 1206
🟢 Target 🎯🏆 - 1272
⚠️ Sto

#Bitcoin Bull Flag Analysis #Bitcoin Bull Flag Analysis
The #BTC Bull flag is currently holding $60,000 price Level.
A bull flag is forming with a target lying around $1,18,000
For this pattern to play out CRYPTOCAP:BTC must be above $60,000 Level.
Note: If break $60,000 level then ready for $45000
Like/RT if you agree


Bank NIFTY trading at support
Bank Nifty is trading at support around 47750 zone.
Considering the trading holiday on Wednesday 17/04/2024. BNF expiry will be tomorrow.
BNF is now in a support zone of 47750 if broken we can expect a fall till the below two support zones
Support 1 47750
Support 2 47400


See all editors' picks ideas
Learn the ins and outs of trading.
What is Swing Trading Let's Know Hi mates and friends, Here i am sharing again an educational post and this time it's all about Swing trading as you might have guessed after reading the title so sharing some insight on this topic below mates !!
Swing Trading: A Strategy for Riding Market Waves
Swing trading is a popular trading

Stay Ahead: Essential Tips to Avoid Trading PitfallsHello TradingView Community!
I'm excited to share some valuable insights on trading pitfalls and how to navigate them effectively. Trading in financial markets can be a challenging journey, but understanding common pitfalls and methods to avoid them can significantly enhance your success. Here are

Stock Selection Based on ATH/52 Week Stock and Relative strengthHello community
Here I will be talking about the process for picking up the stocks based upon the All Time High (ATH)/52 Week BO Stock and RSI . As this is known to everyone but only few are getting benefited by applying it in real trading. The stock represents strength if it breaks its ATH Level a

Overview of Financial Markets // World Market By 👑TrendTalk 👑How To Become a Professional Trader :
Learn the trading basics. ...
Learn the advanced basics. ...
Develop trading systems and techniques. ...
Gain trading experience. ...
Consider paper trading. ...
Choose a reliable broker. ...
Learn to focus. ...
Understand risk management.


What is Technical analysis or Technical Trading How To Become a Professional Trader :
Learn the trading basics. ...
Learn the advanced basics. ...
Develop trading systems and techniques. ...
Gain trading experience. ...
Consider paper trading. ...
Choose a reliable broker. ...
Learn to focus. ...
Understand risk management.

Expensive Mistakes in Trading and how to Clear Them !Hello Trading community, Today i brought an educational publication for sharing with all of you mates in which most of the experiences are mine too that what are the expensive mistakes we are doing and how can we improve that mistakes i am trying to share below mates. But before i start i want to sa

Price-Time Correlation: Through WavesPrice reflection through Waves
We all know that price does not moves in a straight line, it moves in waves. A graphical representation of price with respect to time always gives us a wavy structure. If you notice carefully, on any chart, these waves reflect different characteristics. Some will be

Getting Started with Technical AnalysisInvesting in the stock market can be both exciting and overwhelming. There are so many stocks and strategies are there that make it hard to decide where to invest. That’s where technical analysis comes in. It’s the study of market data to find patterns, trends, and potential opportunities.
To get

Double Bottom & Double Top Patterns and How To Trade Them👋 Hello Trading community and my friends so today i came here with an educational post hope you like my work mates, In technical analysis quite often we hear about Double bottom and Double top patterns so today i am sharing that in very simple and easy to understand way. Although a lot can be unders

See all editors' picks ideas
Trading explainers – why read when you can watch instead?

Overview of Financial Markets // World Market By 👑TrendTalk 👑How To Become a Professional Trader :
Learn the trading basics. ...
Learn the advanced basics. ...
Develop trading systems and techniques. ...
Gain trading experience. ...
Consider paper trading. ...
Choose a reliable broker. ...
Learn to focus. ...
Understand risk management.

What is Technical analysis or Technical Trading How To Become a Professional Trader :
Learn the trading basics. ...
Learn the advanced basics. ...
Develop trading systems and techniques. ...
Gain trading experience. ...
Consider paper trading. ...
Choose a reliable broker. ...
Learn to focus. ...
Understand risk management.
You can take a long trade in HDFC BankCompany:- HDFC Bank Ltd.
Sector:- Banking
M Cap:- 10.99T
Technical:- On the hourly and daily chart smart money formed semetric triangle chart pattern and breakout it with heavy volume, I thik this stock is bottoming out and ready for the next leg rally. One more thing Nifty private banking and nift


J KUMAR INFRA PROJECTS LTDHello & welcome to this analysis
JKIL is a small cap infra co which has in higher time frame been making higher highs and higher lows since its listing.
Currently trading around a resistance.
Fresh breakout above 715 with strong support near 550
All the best with your investing and trading strat

See all editors' picks ideas
Trading indicators and strategies built by our community.
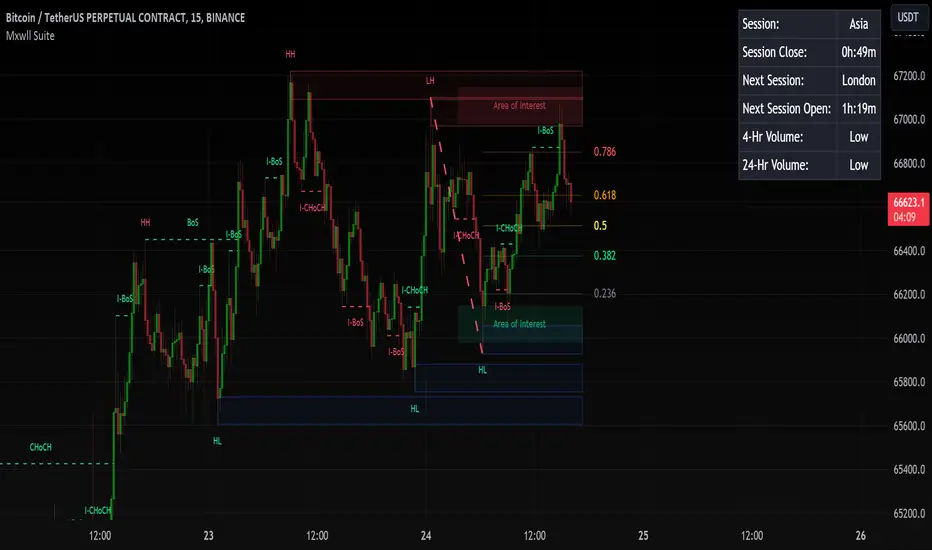
Mxwll Price Action Suite [Mxwll]Introducing the Mxwll Price Action Suite!
The Mxwll Price Action Suite is an all-in-one analysis indicator incorporating elements of SMC and also ideas extending beyond the trading methodology!
Features
Internal structures
External structures
Customizable Sensitivities
BoS/CHoCH
Order B
Percent Rank HistogramThis Pine script indicator is designed to create a visual representation of the percent rank for multiple financial instruments. Here's a breakdown of its key features:
Percent Rank Calculation:
The core functionality of this Pine script indicator revolves around the calculation of the percent r

Heat Map SeasonsHeat Map Seasons indicator
Indicator offers traders a unique perspective on market dynamics by visualizing seasonal trends and deviations from typical price behavior. By blending regression analysis with a color-coded heat map, this indicator highlights periods of heightened volatility and helps

Index Generator [By MUQWISHI]▋ INTRODUCTION :
The “Index Generator” simplifies the process of building a custom market index, allowing investors to enter a list of preferred holdings from global securities. It aims to serve as an approach for tracking performance, conducting research, and analyzing specific aspects of the glob

Higher-timeframe requests█ OVERVIEW
This publication focuses on enhancing awareness of the best practices for accessing higher-timeframe (HTF) data via the request.security() function. Some "traditional" approaches, such as what we explored in our previous `security()` revisited publication, have shown limitations

Trailing Management (Zeiierman)█ Overview
The Trailing Management (Zeiierman) indicator is designed for traders who seek an automated and dynamic approach to managing trailing stops. It helps traders make systematic decisions regarding when to enter and exit trades based on the calculated risk-reward ratio. By providing a cle

Periodic Activity Tracker [LuxAlgo]The Periodic Activity Tracker tool periodically tracks the cumulative buy and sell volume in a user-defined period and draws the corresponding matching bars and volume delta for each period.
Users can select a predefined aggregation period from the following options: Hourly, Daily, Weekly, and Mo

Gaps Profile [vnhilton]Note: If you get an error preventing indicator from executing due to a loop running longer than >500ms, please lower the amount of boxes shown and/or increase the minimum gap % threshold.
OVERVIEW
The Gaps Profile (GP) simply shows the remaining gaps on the chart that have yet to be closed. Gaps
TTrades Daily Bias [TFO]Inspired by @TTrades_edu video on daily bias, this indicator aims to develop a higher timeframe bias and collect data on its success rate. While a handful of concepts were introduced in said video, this indicator focuses on one specific method that utilizes previous highs and lows. The following des

Risk Management Chart█ OVERVIEW
Risk Management Chart allows you to calculate and visualize equity and risk depend on your risk-reward statistics which you can set at the settings.
This script generates random trades and variants of each trade based on your settings of win/loss percent and shows it on the chart as dif

See all editors' picks scripts