How do I turn Bar Replay on?
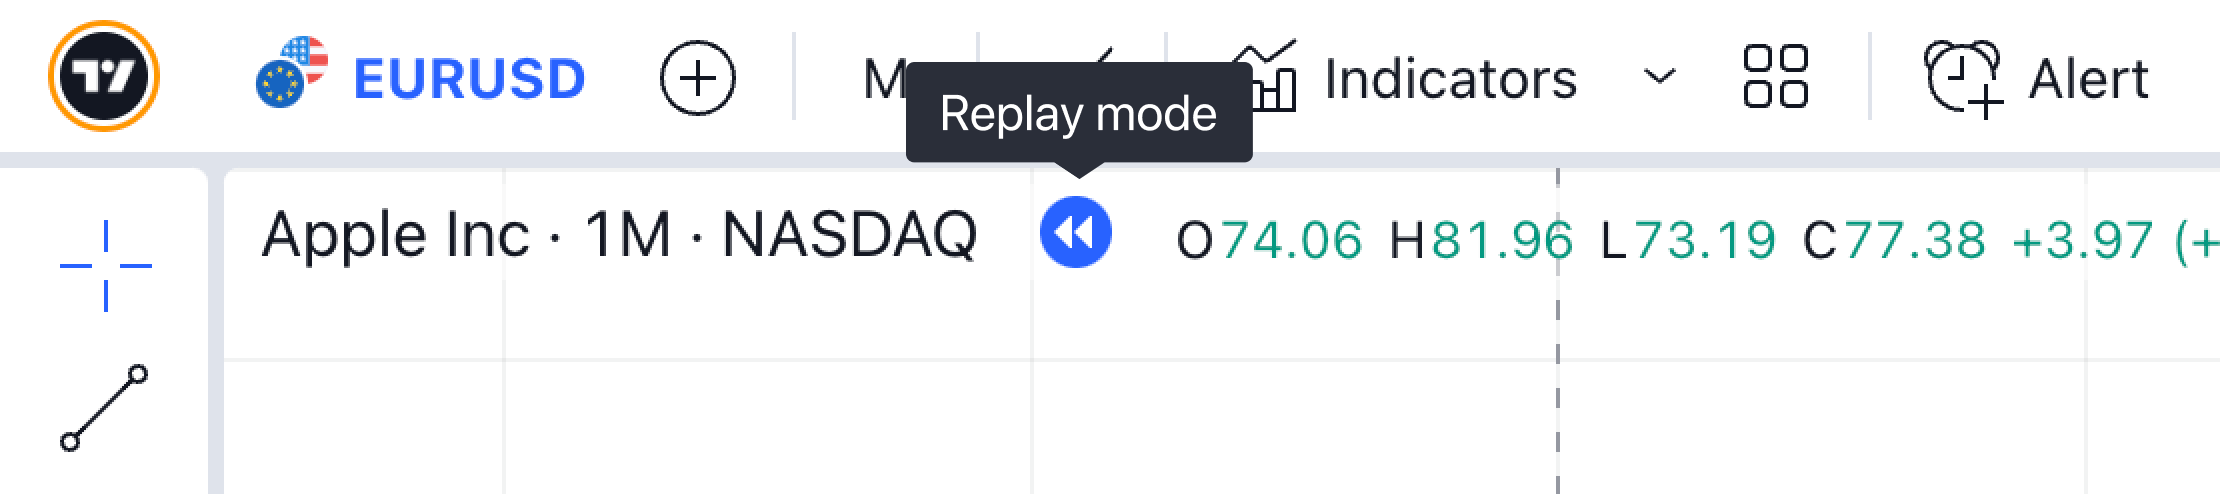
Click the Bar Replay button on the top panel of the chart to open the replay panel.

The replay buttons are intuitive, as in any media player.

After opening the replay panel, the chart goes into the mode of selecting the starting point. Hover over the chart screen and you will see a blue vertical line with scissors.
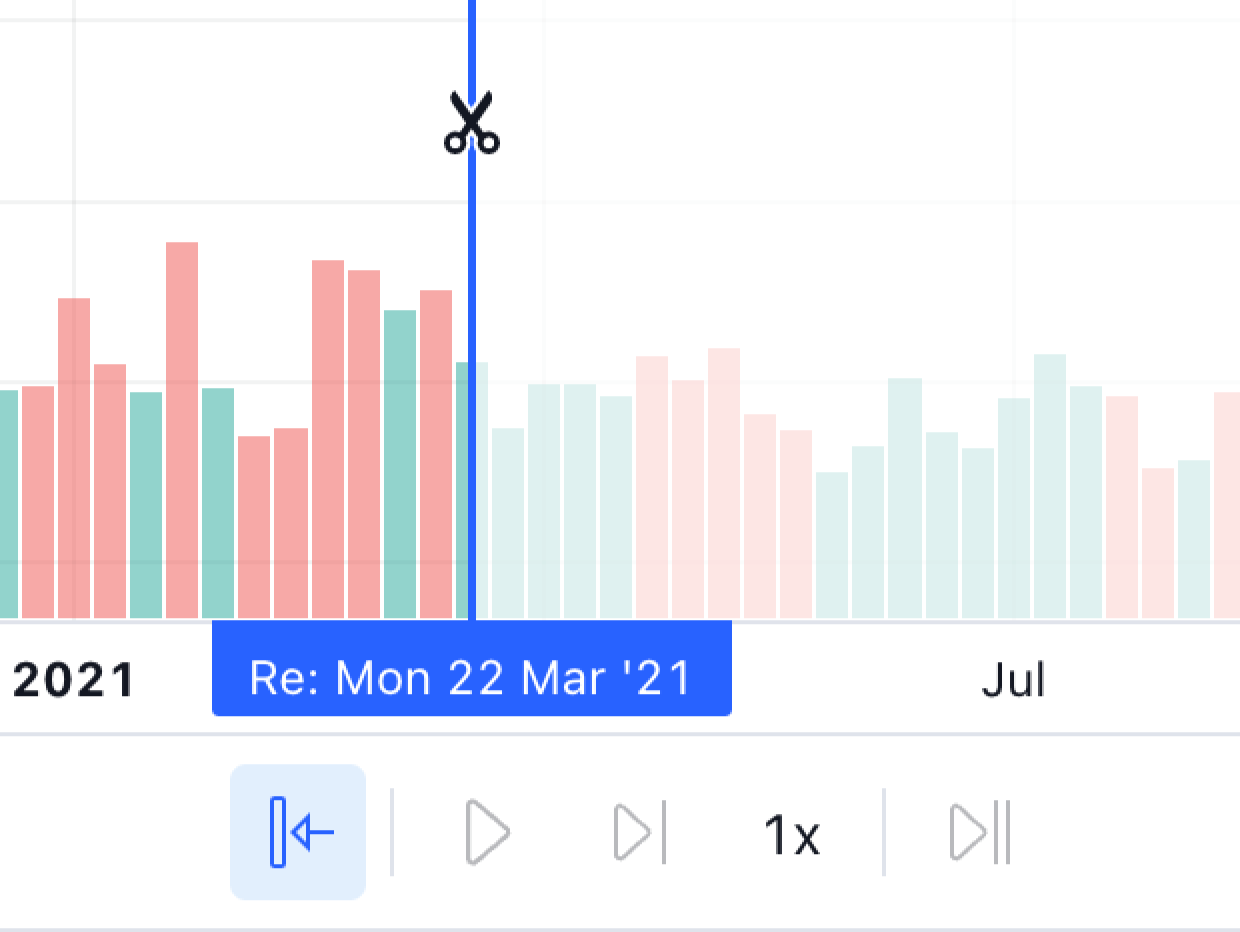
Select the starting point on the chart by clicking on the date/time you need.
Click the Play button to start autoplay. You can adjust the speed before or during replay.

To manually move one step forward, click the Forward button.

On the chart where the Bar Replay is running, you will see the corresponding status.
You can select a different starting point even if the replay is already running. Click Go to... and select a historical part of the chart to change the starting point by clicking on the chart.
You can synchronously run the Bar Replay on all charts of the layout and track the dynamics of changes in one or completely different symbols at different timeframes at one point in time.
When switching to a workspace with several charts, you can select a replay mode: one current chart or all.
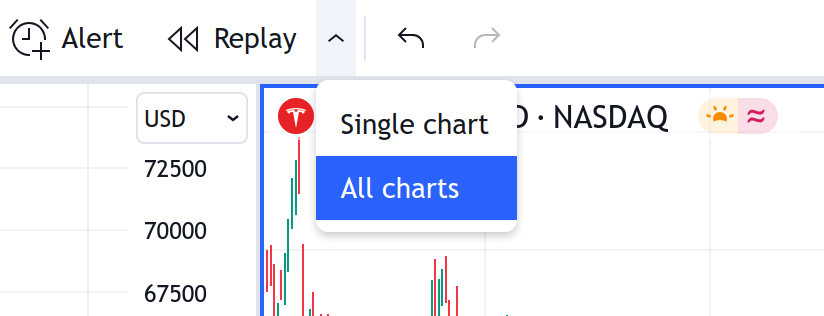
In single chart mode, the replay can be launched on only one of the charts, and it will not differ from what it was before.
In the “All charts” mode, when you select the starting bar, the starting line will appear on all charts of the layout, and while you choose the starting point on one, the charts are synchronized in time so that the point from which replay will begin on each chart is in the visible area.
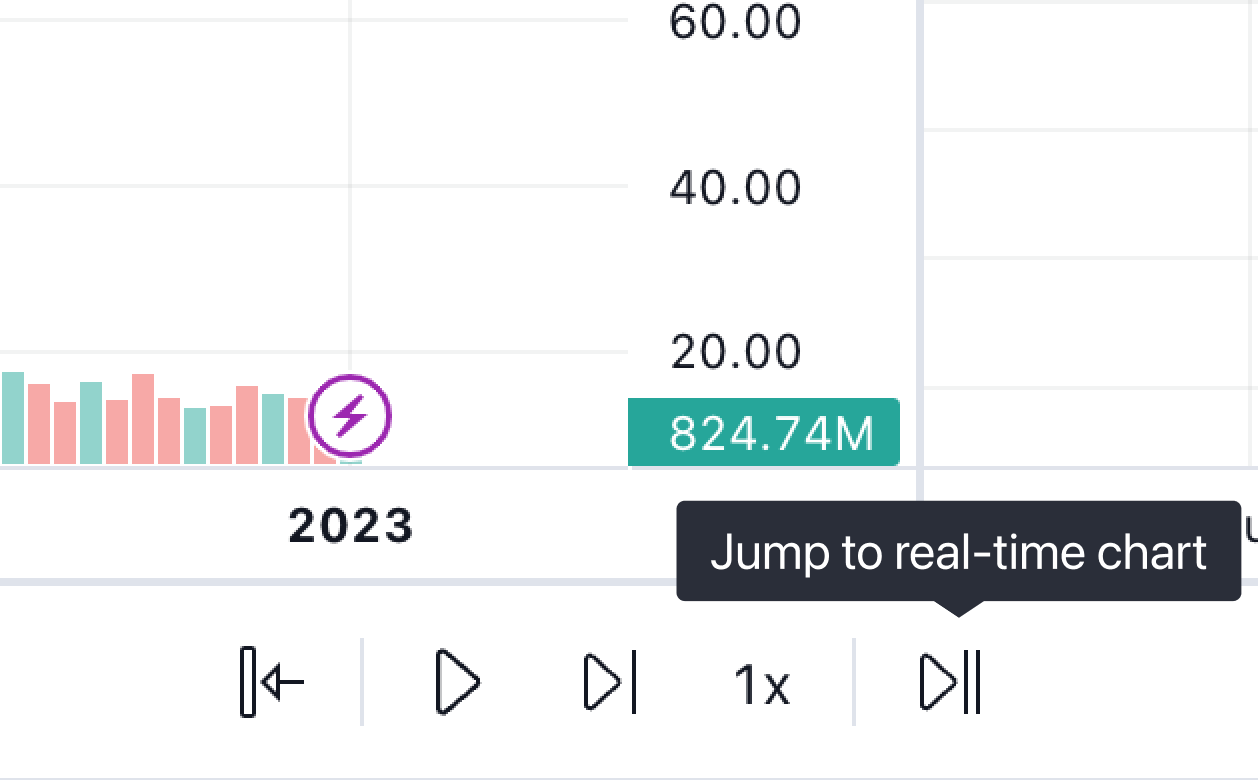
In addition, you can end replay and immediately return to live data. The Jump to real-time chart button allows you to do this in one click.
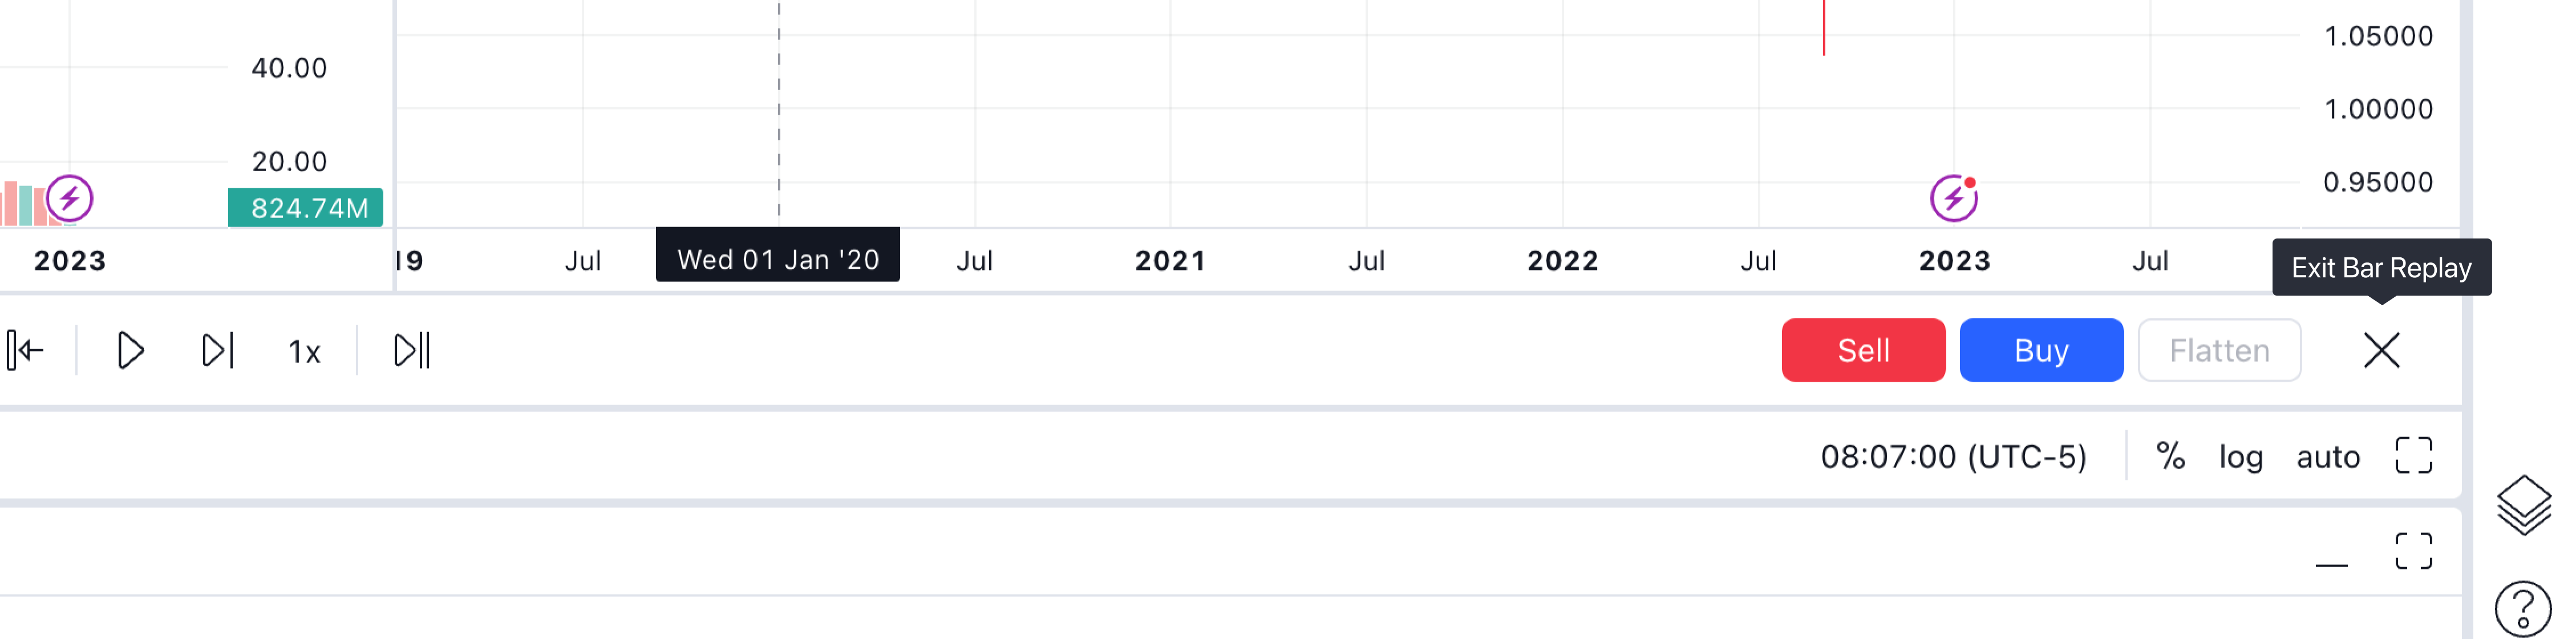
You can close the replay panel by clicking [X] on it, or click on the Bar Replay button at the top of the chart.

Other functions and limitations in Bar Replay:
- server-side alerts continue to fire based on real-time data;
- new server-side alerts cannot be created in replay;
- trading orders (Paper Trading and other brokers) are executed based on real-time data;
- quotes displayed on the trading panel and in the list of quotes correspond to real-time data when the chart is in the replay;
- non-standard chart types are incompatible with Bar Replay;
- Bar Replay allows you to apply drawing objects and indicators. They will remain on the chart even after exiting the mode;
- Bar Replay does not work with spread charts and tick-based charts;
- regression Trend and Fixed Range Volume Profile tools do not work during replay.