NGASG2025 trade ideas
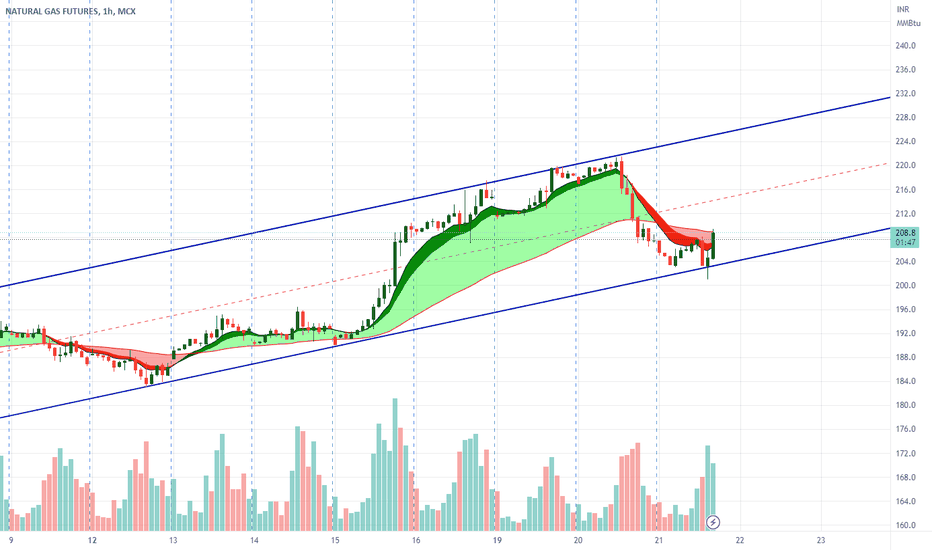
Natural Gas Will take Support ShortlyAs per technical Analysis Looks like Natural gas is on sell side but as per chart it will take small support Near 204.50 level and if its break then possibly it will test 200,196,193 level.
Considering this ill buy Natural Gas near 205 and ill keep stop loss as 201 level. Target 211,214
Only For educational Purpose.
Expecting Bulls Will take Control As per Technical analysis and Fibonacci Retractarcment Natural Gas Looks Bullish. Considering this buy Natgas mini August Future Near 208 stop loss 204 Target 215,218,222,225
Investment Required 21000
Maximum Loss - 1000
Profit Upto -4250
Only For Educational Purpose.
Base metalsBase Metal Technical Report, 30/06/2023 : BEST COMMODITY
30 Jun 10:17 BEST COMMODITY
Technical Outlook
The daily technical chart for Copper futures is forming a "Megaphone Pattern", where copper is facing heat, and in the last session it shredded 0.75%, where it closed at 704.95, it giving expectation of bearish movement if 700 is breached, which is the strong support for the commodity, where it is broken we may see 690 levels, and in the last session, it touched a high of 706.90, hence we may see a range of 700-710 in the upcoming session, meanwhile, for the current session the resistance is at 709 and key support is at 698.
Research Report Call
Buy if able to sustain above 707 targets 710-711, keeping an SL of 705. sell if it breaks 702, for targets 700-698, keeping an SL of 703.
Technical Outlook
Zinc Futures in the last session was flat and closed at 211.20, where it has been correcting from the last couple of sessions, in the range of 207-213, where it is taking support at 210, and zinc is technically forming a "Falling Wedge", where the contracting demands are hindering the gains, and it in the last session gave a range of 211.85-210.25, where it might try to move in the range of 210-213 levels in the upcoming sessions, for the current session zinc's key resistance, is placed at 213.55 and key support is placed at 208.50.
Research Report Call
Sell if it breaks 210 below, then sell for targets 209-207 keeping an SL of 211.20, and buy if it sustains above 212 for targets 213-215 keeping a trail SL of 211.
As Reported By BEST COMMODITY
NATURALGAS Long for Wave 3/C UP!Attached: Natural Gas Mini Futures Hourly Chart Live
- Morning Star Candlestick Reversal Pattern activated
- Bounce off 200 DEMA (black line)
- Breakout from Wedge
- Price action can be Channelized suggestive that the Fall was a Corrective and not an Impulse
- So W3/ WC upside to play📈
1st Target on Upside = 223
2nd Target on Upside = 229
SL can be based on Morning Star Candlestick Pattern Low
natural mcx breif update blwas per chart reading--- natural gas eys on daily chart upper trend line of top side 243-45 will react solid hurdle if stya abv or close abv 2 days than expect up side tgt 282--320+++ soon have patience or eyes on lvl as [er chart looks bottom out happened will more update with entry or trail sl stay tuned
A possible long trade in Natural GasNatural gas has been rallying over the last week and it has broken above some key pivot levels, in this video I discuss the key level and what the potential entry point can be for the commodity when it corrects further and the potential upside target. Coupled with the fact that this commodity is also below the long term mean prices mean that the long trade has a higher probability of being right. The trade has a potential 20% upside based on the charts and perhaps it will be easier if we as traders look at holding the mini lots. Of course every trader will make a different decision based on the capital in the account.
MCX Natural Gas – Impulsive Wave SetupA new impulsive structure has emerged from the low of 265.5 in natural gas. Price has accomplished wave (5) and started the zigzag correction at 801.
Currently, Natural gas is forming sub-wave 5 of impulsive wave C. Natural gas has also broken down 200 EMA and the base channel of 2 – 4 wave, which signals bearish momentum. It has faced strong support of 515 , but the price didn’t respect the level and ended up losing bullish momentum.
Wave C has traveled the same distance as wave A. Hence, Wave A = Wave C. If the price sustains below 516, traders can trade for the following targets: 486 – 462 – 440 .
I will update further information soon.
#Natural gasNatural gas corrected from $9.2/MMBtu to $2.2/MMBtu.
The latest EIA report showed US utilities added 75 bcf of gas into storage last week, more than market expectations of a 69 bcf increase, as mild weather kept heating demand low
Technically, now Natural gas is forming narrow wedge with some diversions seen in RSI. Despite fundamentally it is negative, diversions on weekly charts shows Natural gas can touch $3.4/MMBtu by May
#Natural gas #Cup&HolderProduction continues to fluctuate in the high 90s Bcf/d to low 100s Bcf/d as pipeline maintenance events temporarily curb gas flows
Preliminary data showed gas output fell to a three-week low of 100.8 billion cubic feet per day on Thursday.
At the same time, gas demand is expected to increase from 91.3 bcfd this week to 91.6 bcfd next week as warmer weather is making more people turn on their air conditioners.
Technically
Forming Cup & Holder formation on Daily chart breaking above 194 can take NG to 220 levels


