Unlock India’s Derivatives Power1. The Rise of Derivatives in India
Derivatives—such as futures, options, and swaps—derive their value from underlying assets like stocks, indices, commodities, currencies, and interest rates. India’s derivatives journey began in the early 2000s when SEBI introduced index derivatives to modernize c
Sorry, this is only available to registered users
MCX provides data to our registered users only, so to get it you'll need to sign up for a TradingView account.
Related commodities
Naturalgas 395 to 405 range trade after breaking 🔑 Key Highlights
- Price Action: Natural Gas trading at ₹400, holding above ₹395 support.
- Trend: Active Long Build‑Up confirmed.
- Supports: ₹395 / ₹388 / ₹382.
- Resistances: ₹405 / ₹412 / ₹420.
- Bias: Bullish continuation if above ₹395; corrective pullback risk below ₹388.

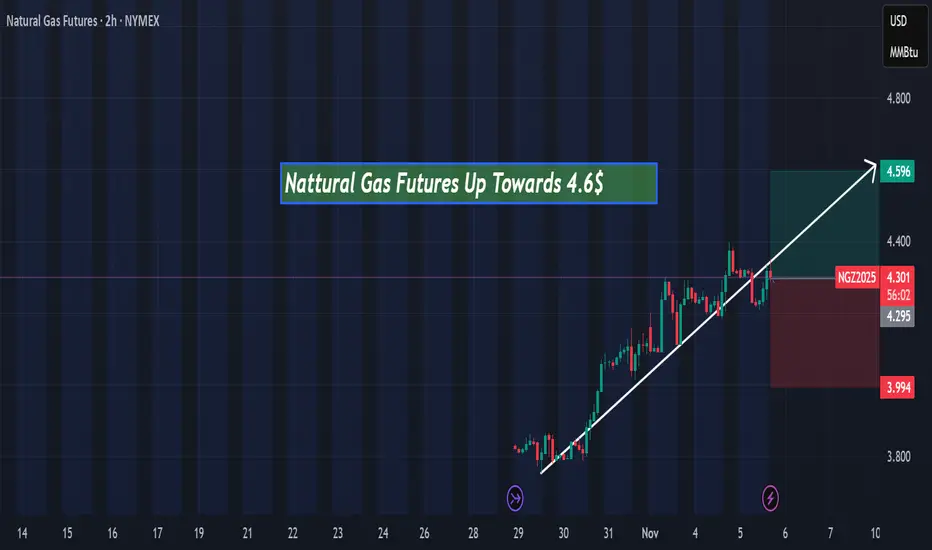
Natural Gas Futures Up towards 4.6$Hi everyone, today Natural Gas Futures is expected to rise toward $4.60 in the next few hours according to my technical analysis.
AITool showing Natural gas 395 until not break upmove continue 🔑 Key Highlights
- Price Action: Natural Gas is holding steady above ₹402, showing mild bullish momentum.
- Trend: Long Build‑Up (Price↑ + OI↑), suggesting fresh long positions.
- Supports: ₹399 / ₹395 / ₹389.
- Resistances: ₹406 / ₹412 / ₹420.
- Bias: Bullish continuation if ₹399 holds; cor
Long NaturalgasNatural gas is looking good in current scenario.
If it will do breakout from 430 zone then we can see 432 and 468
1st Dec is date for 432 and 24 dec 468
This is as per my sqroot calculation from previous top formation.
For downside you must hedge the trade by buying Bullish Put spread or bullish ca

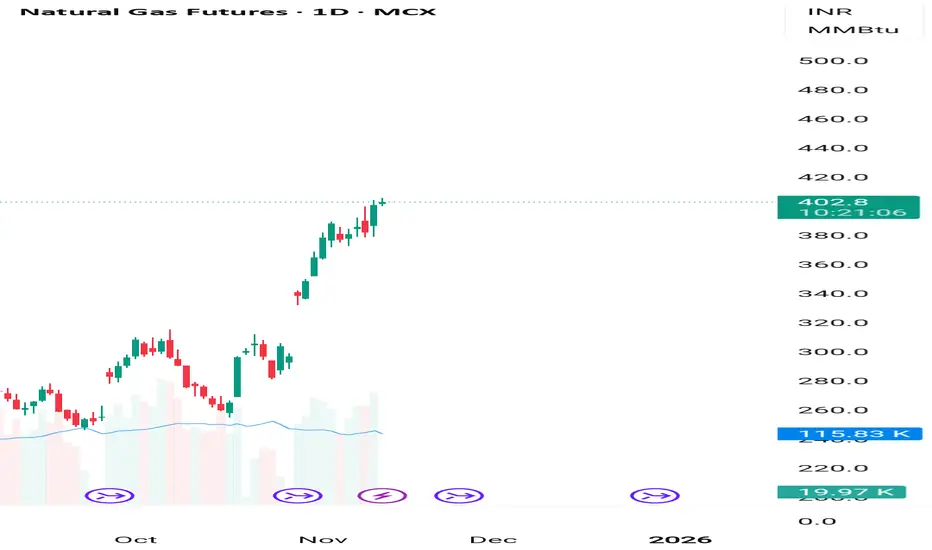
NG profit booking ossible above 415-418, avoid buy trade AI dataParameters Data
Asset Name Natural Gas MCX
Reason 🟩 Strong breakout above ₹400 level, supported by colder weather forecasts in the US and high LNG demand.
R:R 🟩 1:1.50 (T3 target ke liye favorable. SL 400 ke major support ke niche rakha gaya hai.) / Threshold: Breakout above - & Breakdown below

Holding sell trade on natural gas from 397 target 375-374🔑 Key Highlights (Locked Permanently)
- Supports/Resistances: 385 is the critical support; breach flips bias.
- Indicators: ADX >25, RSI 65, PCR 0.95 — all thresholds confirmed.
- Liquidity: VWAP 398 confirmed; turnover ₹7,980 Cr slightly below ₹8,000 Cr threshold ⚠.
- Volatility: IV 15.6%, RV

Natural gas avoid buying at current price 345-340 best buy areaNatural gas avoid buying at current price levels given on chart .
How My Harmonic pattern projection Indicator work is explained below :
Recent High or Low :
D-0% is our recent low or high
Profit booking zone ( Early / Risky entry) : D 13.2% -D 16.1 % is
range if break them profit booking

Option Buying vs Option Selling in the Indian Market1. Understanding Options in Brief
An option is a financial derivative contract that gives the buyer the right, but not the obligation, to buy or sell an underlying asset (such as Nifty, Bank Nifty, or stocks) at a predetermined price (strike price) before or on a specific date (expiry date).
Call

Part 4 Learn Institutional TradingAdvantages of Option Trading
Leverage:
Options allow control over large quantities of an asset with a small investment (premium). This magnifies potential profits.
Limited Risk for Buyers:
When buying options, the maximum loss is limited to the premium paid.
Hedging Capability:
Options can offset

See all ideas
A representation of what an asset is worth today and what the market thinks it will be worth in the future.
Sorry, this is only available to registered users
MCX provides data to our registered users only, so to get it you'll need to sign up for a TradingView account.
Displays a symbol's price movements over previous years to identify recurring trends.