AUD/PLN Technical Analysis – Reversal Opportunity AUD/PLN Chart Analysis (1H) on TradingView 📊 🔴 Overall Trend: ➡️ The price is following a bearish trend 📉, trading below the 200 EMA (🔵 2.45308) and the 30 EMA (🔴 2.43309). ➡️ The market is showing selling pressure, but the price has reached a key support zone 🟣. 🟣 Support Zone (Possible Reversal)
Related currencies

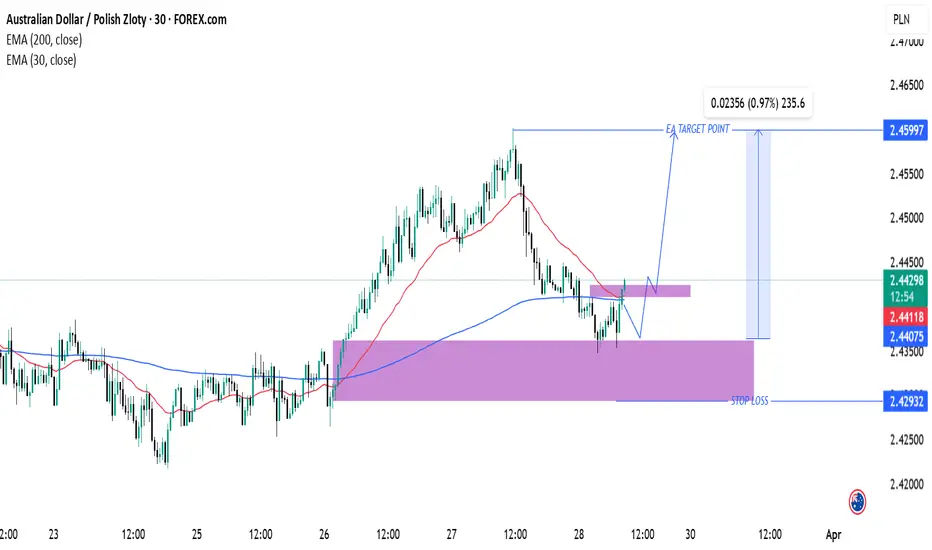
AUD/PLN Trade Setup: Bullish Reversal & Target ProjectionAUD/PLN Technical Analysis & Trade Setup
Chart Overview:
Currency Pair: Australian Dollar (AUD) / Polish Zloty (PLN)
Timeframe: 30-minute chart
Indicators:
200 EMA (Blue): 2.44075
30 EMA (Red): 2.44113
Key Levels & Strategy:
Support & Resistance:
Major Support Zone: Around 2.42932 (Stop Loss A
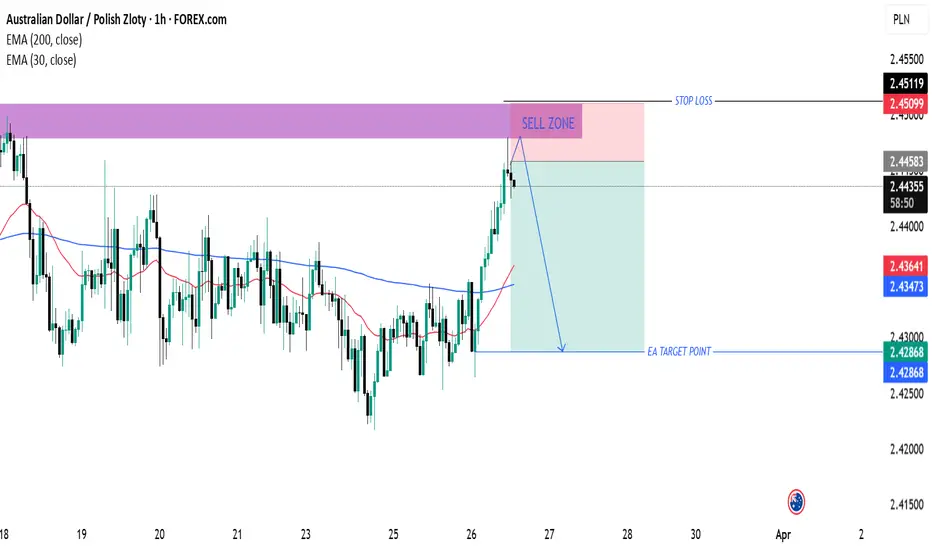
"AUD/PLN Technical Analysis – Potential Sell Setup (March 26, 20Sell Zone (Purple Area)
This area marks a strong resistance level, where price is expected to reverse downward.
Price has entered this zone, which might indicate a potential short-selling opportunity.
Stop Loss (Above Sell Zone)
The stop-loss level is set at 2.45119, just above the resistance zo
See all ideas
Summarizing what the indicators are suggesting.
Oscillators
Neutral
SellBuy
Strong sellStrong buy
Strong sellSellNeutralBuyStrong buy
Oscillators
Neutral
SellBuy
Strong sellStrong buy
Strong sellSellNeutralBuyStrong buy
Summary
Neutral
SellBuy
Strong sellStrong buy
Strong sellSellNeutralBuyStrong buy
Summary
Neutral
SellBuy
Strong sellStrong buy
Strong sellSellNeutralBuyStrong buy
Summary
Neutral
SellBuy
Strong sellStrong buy
Strong sellSellNeutralBuyStrong buy
Moving Averages
Neutral
SellBuy
Strong sellStrong buy
Strong sellSellNeutralBuyStrong buy
Moving Averages
Neutral
SellBuy
Strong sellStrong buy
Strong sellSellNeutralBuyStrong buy
Displays a symbol's price movements over previous years to identify recurring trends.