HDFCBANK 1D Time frameCurrent Market Snapshot
Current Price: ₹954.05
Opening Price: ₹945.10
Day's Range: ₹939.10 – ₹953.00
Previous Close: ₹945.05
🔑 Technical Indicators
Relative Strength Index (RSI): 35.08 – indicating a neutral to bearish condition.
Moving Average Convergence Divergence (MACD): -6.02 – suggestin
Next report date
—
Report period
—
EPS estimate
—
Revenue estimate
—
650 ARS
8.89 T ARS
59.60 T ARS
15.34 B
About HDFC Bank Limited
Sector
Industry
CEO
Kapila Deshapriya
Website
Headquarters
Mumbai
Founded
1994
ISIN
ARDEUT114022
FIGI
BBG000PZ25Y3
HDFC Bank Ltd. engages in the provision of banking and financial services including commercial banking and treasury operations. It operates through the following segments: Treasury, Retail Banking, Wholesale Banking, and Other Banking Business. The Treasury segment is involved in net interest earnings from the investment portfolio, money market borrowing, and lending, gains, or losses on investment operations and on account of trading in foreign exchange and derivative contracts. The Retail Banking segment focuses on serving retail customers through the branch network and other channels. The Wholesale Banking segment provides loans, non-fund facilities, and transaction services to large corporates, emerging corporates, public sector units, government bodies, financial institutions, and medium scale enterprises. The Other Banking Business segment includes income from parabanking activities such as credit cards, debit cards, third party product distribution, primary dealership business, and the associated costs. The company was founded by Aditya Tapishwar Puri in August 1994 and is headquartered in Mumbai, India.
Related stocks
Part 1 Support and Resistance 1. Introduction to Option Trading
Option trading is a type of derivatives trading where traders buy and sell options contracts rather than the underlying asset itself. An option is a financial contract that gives the holder the right, but not the obligation, to buy or sell an underlying asset at a

Part 2 Support and Resistance1. Time Decay (Theta) in Action
Time decay erodes option premiums daily, faster near expiry. Example: An option priced ₹50 with 10 days left may lose ₹5 daily if underlying doesn’t move. This favors option sellers (who benefit from decay) and hurts option buyers (who need timely moves).
2. Volatil

Introduction: Crafting the Trade Narrative1. The Essence of a Trade Narrative
At its core, a trade narrative is the story you tell yourself about the market and your position within it. Just as a novelist constructs a plot with characters, conflicts, and resolutions, a trader constructs a narrative that includes:
Market context: Understan
Importance of Option Greeks in Trading and Risk Management1. Understanding Options and Their Intrinsic Complexity
Options are contracts that provide the holder with the right, but not the obligation, to buy or sell an underlying asset at a predetermined price (strike price) on or before a specific date (expiration). There are two primary types of options:
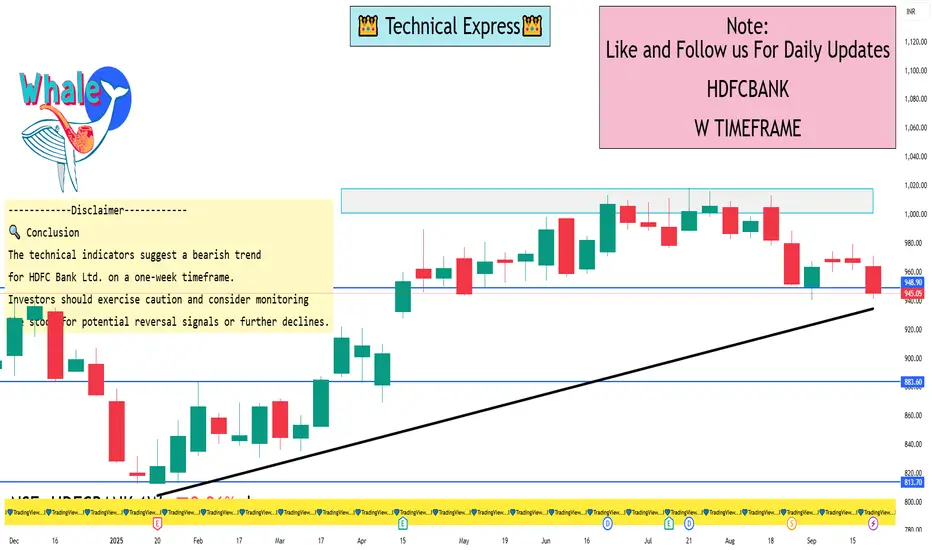
HDFCBANK 1 Week View📉 Technical Indicators
Relative Strength Index (RSI): Approximately 35.08, indicating the stock is nearing oversold conditions but not yet in the oversold zone.
Moving Average Convergence Divergence (MACD): Around -6.02, suggesting a bearish trend.
Moving Averages:
5-day EMA: ₹957.70 (Sell)
10
HDFCBANK 1D Time frame📊 Daily Snapshot
Closing Price: ₹949.20
Day’s Range: ₹947.40 – ₹958.00
Previous Close: ₹957.20
Change: Down –0.52%
52-Week Range: ₹806.50 – ₹1,018.85
Market Cap: ₹14.6 lakh crore
P/E Ratio: 20.66
Dividend Yield: 2.32%
EPS (TTM): ₹45.97
Beta: 0.92 (indicating lower volatility)
🔑 Key Techni
HDFCBANK 1D Time frame📍 Current Price & Range
Current price: ₹964.20
Day’s High / Low: ₹968.20 / ₹955.50
52-week High / Low: ₹1,018.85 / ₹806.50
🔍 Key Levels (with current context)
Immediate support: ₹955-₹958
Stronger support: ₹945-₹950
Immediate resistance: ₹970-₹975
Next resistance: ₹980-₹985
Major psychologi

HDFC Bank: Three Decades of Excellence Continues🔍 Technical Analysis
HDFC Bank represents one of the most remarkable wealth creation stories in Indian equity markets. The stock has delivered an extraordinary super bullish rally over three decades, transforming from ₹1 to the current trading level of ₹955 - representing an astounding 955x growth
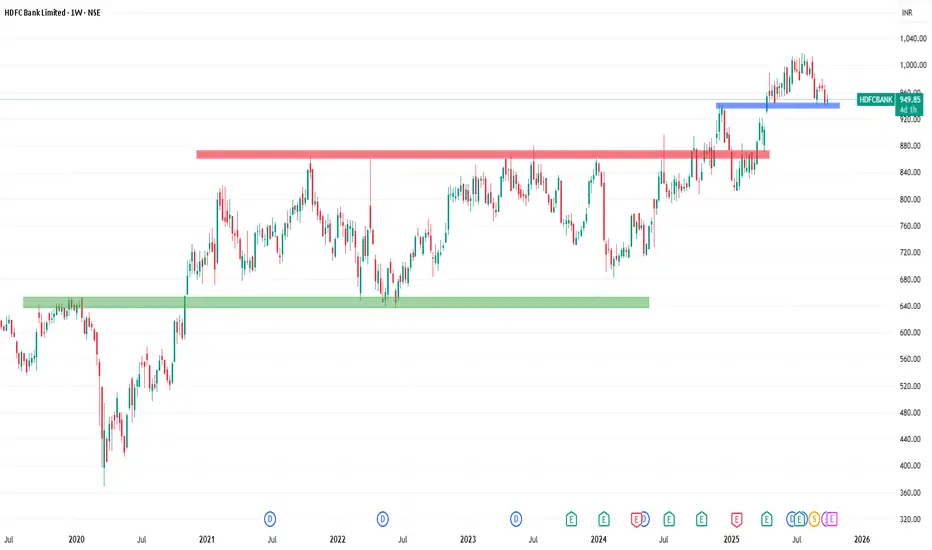
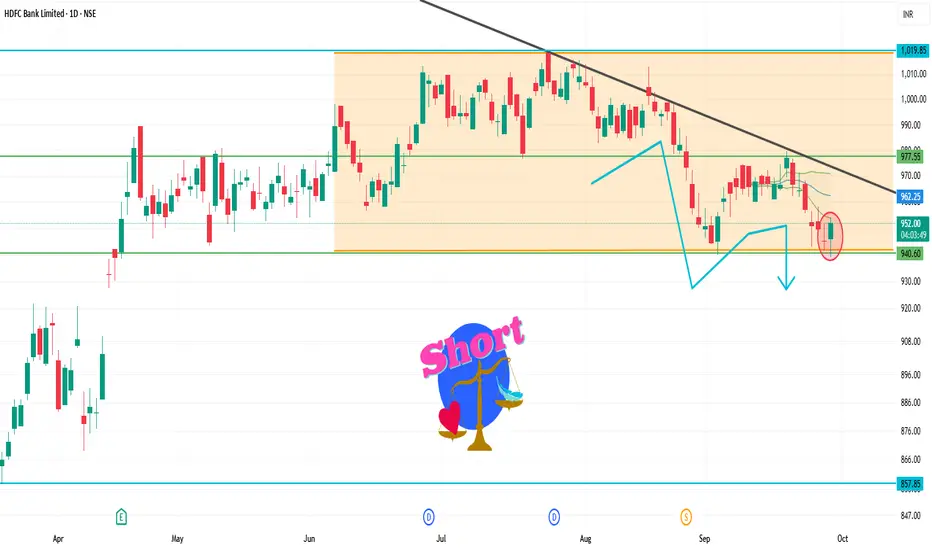
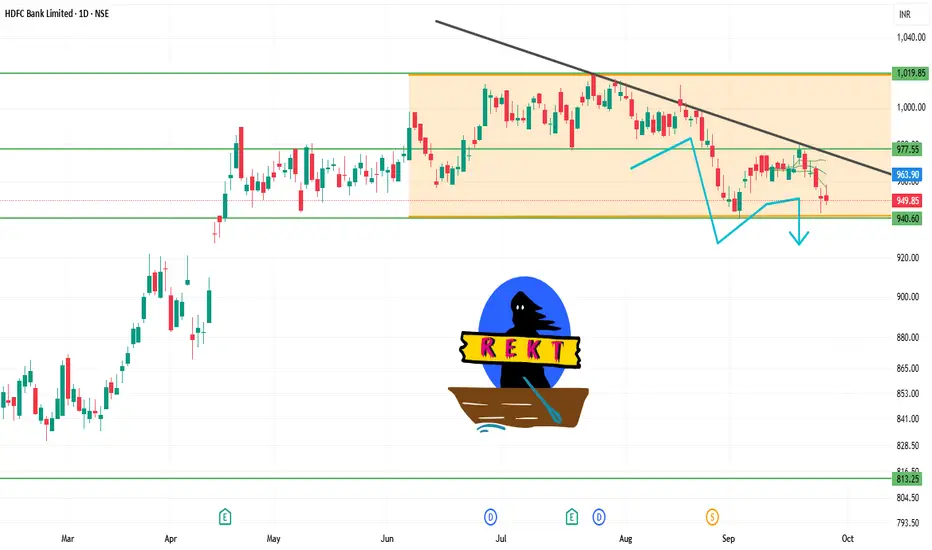
HDFC BANK LONG TERM PICTURE AS PER MY VIEWon daily tf price changed character and turned -ve
There are some support areas on weekly tf from where we can expect a reversal

See all ideas
Summarizing what the indicators are suggesting.
Oscillators
Neutral
SellBuy
Strong sellStrong buy
Strong sellSellNeutralBuyStrong buy
Oscillators
Neutral
SellBuy
Strong sellStrong buy
Strong sellSellNeutralBuyStrong buy
Summary
Neutral
SellBuy
Strong sellStrong buy
Strong sellSellNeutralBuyStrong buy
Summary
Neutral
SellBuy
Strong sellStrong buy
Strong sellSellNeutralBuyStrong buy
Summary
Neutral
SellBuy
Strong sellStrong buy
Strong sellSellNeutralBuyStrong buy
Moving Averages
Neutral
SellBuy
Strong sellStrong buy
Strong sellSellNeutralBuyStrong buy
Moving Averages
Neutral
SellBuy
Strong sellStrong buy
Strong sellSellNeutralBuyStrong buy
Displays a symbol's price movements over previous years to identify recurring trends.
H
772HEGIC32
HDFC ERGO General Insurance Company Limited 7.72% 19-SEP-2032Yield to maturity
—
Maturity date
Sep 19, 2032
H
820HEGIC35
HDFC ERGO General Insurance Company Limited 8.2% 17-MAR-2035Yield to maturity
—
Maturity date
Mar 17, 2035
See all HDB bonds
Curated watchlists where HDB is featured.

Indian stocks: Racing ahead
46 No. of Symbols
See all sparks