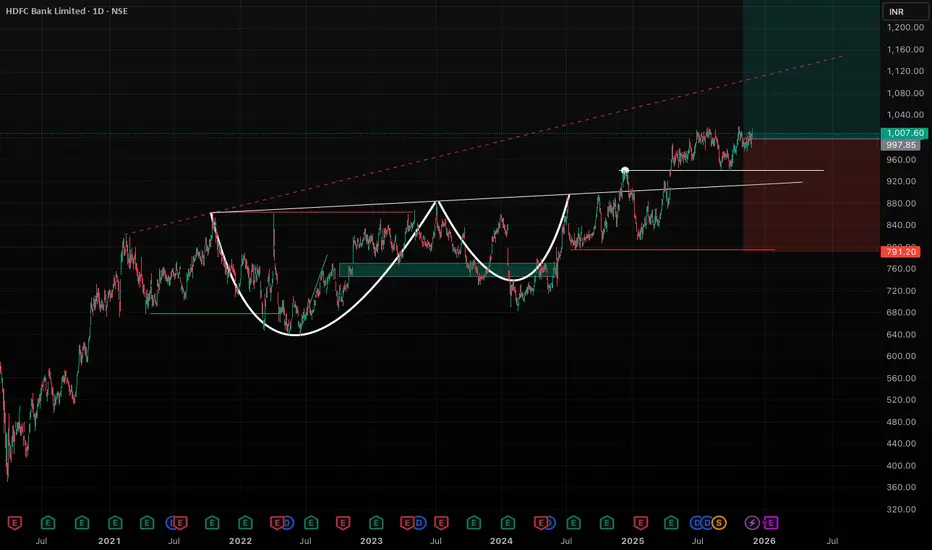
HDFC BANK LTD PARALLEL CHANNEL BREAKOUTHDFC BANK was traded in channel from past few years and made a breakout with good volume. Entry price at ₹990, with a STOPLOSS ₹940 and TARGET ₹1,190
HDFC Bank Limited ADR
No trades
Next report date
—
Report period
—
EPS estimate
—
Revenue estimate
—
725 ARS
8.89 T ARS
59.60 T ARS
15.36 B
About HDFC Bank Limited
Sector
Industry
CEO
Kapila Deshapriya
Website
Headquarters
Mumbai
Founded
1994
ISIN
ARDEUT114022
FIGI
BBG000PZ25Y3
HDFC Bank Ltd. engages in the provision of banking and financial services including commercial banking and treasury operations. It operates through the following segments: Treasury, Retail Banking, Wholesale Banking, and Other Banking Business. The Treasury segment is involved in net interest earnings from the investment portfolio, money market borrowing, and lending, gains, or losses on investment operations and on account of trading in foreign exchange and derivative contracts. The Retail Banking segment focuses on serving retail customers through the branch network and other channels. The Wholesale Banking segment provides loans, non-fund facilities, and transaction services to large corporates, emerging corporates, public sector units, government bodies, financial institutions, and medium scale enterprises. The Other Banking Business segment includes income from parabanking activities such as credit cards, debit cards, third party product distribution, primary dealership business, and the associated costs. The company was founded by Aditya Tapishwar Puri in August 1994 and is headquartered in Mumbai, India.
Related stocks

HDFC Bank: Massive Multi-Year Cup-and-Handle BreakoutHDFC Bank is showing a very bullish multi-year Cup-and-Handle breakout. Price has finally broken above the long-term horizontal resistance zone and is now retesting it as support. This stock is also in majority of mutual fund's top holdings, so this makes it a safer bet.
HDFC Bank is long consolidatingAbove 1415 if this share starts holding. We can target the resistance line for the first target. Other targets are open as the share has corrected a lot.

HDFCBANK 1 Week Time Frame 🔹 Quick Snapshot
1. The current share price is about ₹ 1,015.
2. 52‑week range: Low ≈ ₹ 812.15, High ≈ ₹ 1,020.50.
3. Recent weekly momentum and technicals appear neutral-to‑slightly bullish: short‑term indicator signals mostly “buy”, and momentum oscillators (like MACD) are supportive.
🔄 What t

Relationship Between Open Interest and VolatilityIntroduction
In the world of derivatives trading, particularly in futures and options markets, understanding open interest and volatility is crucial for traders and investors. Both metrics provide critical insights into market sentiment, liquidity, and potential price movements. While open interest
Algo, Quant & Data-Driven Trading1. What is Algorithmic Trading?
Algorithmic trading (algo trading) is the execution of trades automatically using pre-defined rules or instructions coded into a computer system. These rules may involve price, time, volume, technical indicators, or market conditions.
Key Characteristics of Algo Tra
Price Action Trading1. What is Price Action Trading?
Price action trading is the analysis of raw price movement on a chart. It involves studying candlestick patterns, support and resistance zones, trendlines, breakouts, volume behavior, and the psychology behind market participants’ actions. Instead of using lagging i

A Comprehensive Guide to Managing Trading Risk1. Understanding Trading Risk
Trading risk refers to the possibility of losing part or all of the capital invested due to market movements, volatility, or other unforeseen events. Risk can be classified into different types:
Market Risk: The risk that market prices will move unfavorably.
Liquidit
Part 10 Trade Like Institutions Option Trading in India (NSE)
In India, the National Stock Exchange (NSE) is the largest options market globally in terms of contracts traded.
Features of Indian Options:
Cash-settled for indices (NIFTY, FINNIFTY, BANKNIFTY)
Stock options are physically settled
Weekly expiries every Thursday (f

Part 8 Trading Master Class With Experts Role of Volume & Open Interest
These indicators help understand market participation:
Volume shows activity
Open Interest shows fresh positions
Rising OI + rising price → strong trend
Rising OI + falling price → trend strength in opposite direction
Falling OI → position unwinding
Options with

See all ideas
Summarizing what the indicators are suggesting.
Oscillators
Neutral
SellBuy
Strong sellStrong buy
Strong sellSellNeutralBuyStrong buy
Oscillators
Neutral
SellBuy
Strong sellStrong buy
Strong sellSellNeutralBuyStrong buy
Summary
Neutral
SellBuy
Strong sellStrong buy
Strong sellSellNeutralBuyStrong buy
Summary
Neutral
SellBuy
Strong sellStrong buy
Strong sellSellNeutralBuyStrong buy
Summary
Neutral
SellBuy
Strong sellStrong buy
Strong sellSellNeutralBuyStrong buy
Moving Averages
Neutral
SellBuy
Strong sellStrong buy
Strong sellSellNeutralBuyStrong buy
Moving Averages
Neutral
SellBuy
Strong sellStrong buy
Strong sellSellNeutralBuyStrong buy
Displays a symbol's price movements over previous years to identify recurring trends.
H
772HEGIC32
HDFC ERGO General Insurance Company Limited 7.72% 19-SEP-2032Yield to maturity
—
Maturity date
Sep 19, 2032
H
815HEGI33A
HDFC ERGO General Insurance Company Limited 8.15% 20-FEB-2033Yield to maturity
—
Maturity date
Feb 20, 2033
See all HDB bonds
Curated watchlists where HDB is featured.

Indian stocks: Racing ahead
46 No. of Symbols
See all sparks