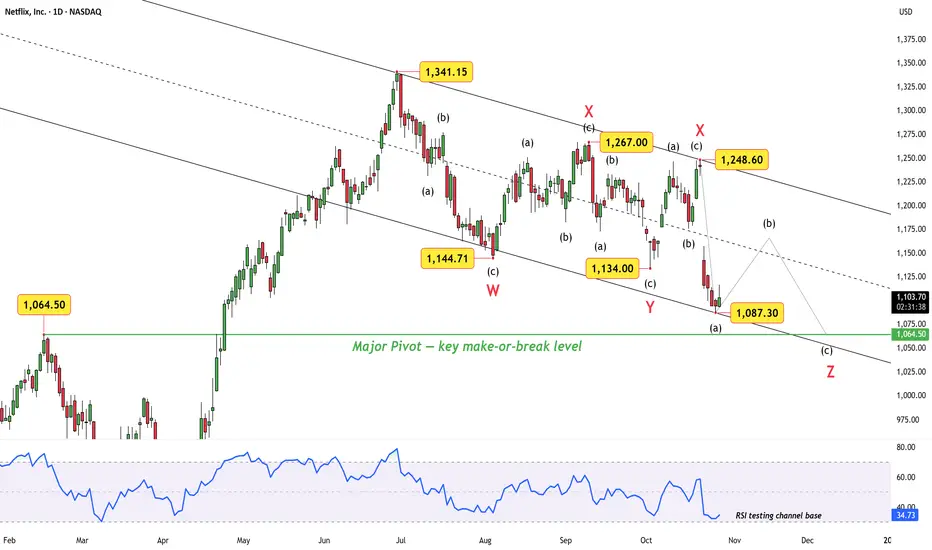
Netflix: Wave Z or a Surprise Truncation Ahead?After a textbook W–X–Y–X structure, Netflix now appears to be sketching the final leg “Z” inside a well-defined descending channel. Each corrective wave has respected the parallel boundaries — a sign of structural discipline rather than chaos.
The latest drop to $1,087.30 tagged the channel’s lower rail and the Major Pivot near $1,064.50, precisely where the RSI has also reached its long-term support zone. This alignment hints that the market may be nearing exhaustion — but whether it’s the end of “Z” or just a pause before one more flush remains the key question.
A sustained break below the pivot confirms completion of the triple correction, while a sharp rebound from here could mark a truncated Z, setting the stage for a larger recovery.
Disclaimer: This analysis is for educational purposes only and does not constitute investment advice. Please do your own research (DYOR) before making any trading decisions.
Netflix, Inc. Shs ert Deposito Arg Repr 0.0208333 Sh
No trades
Trade ideas
NFLX STOCK ANALYSISnetflix stock = liquidity sweeped (grab)- 1183 $
two order blocks found - 1160$ , 1171$
MSS - 1171 $
equal highs - 1266 $ = target 1
2nd target found fvg and order block - 1319 $

Netflix short term NASDAQ:NFLX
Look like again ready for move upside.
Buyer absorb selling pressure.
Current price - 1205 around
Demand zone: 1185- 1140
Sl - below demand zone (6-7%risk)

Bearish Setup on NFLX: Correction Wave (C) UnfoldingTF: 4h
NFLX appears bearish at the moment. The corrective structure on the 4-hour timeframe suggests a potential decline. The current formation indicates that wave B likely completed at 998.61, and the stock has now begun its descent into wave (C) of the correction.
The correction may extend to the 100% projection of wave A at 788.67, or potentially deepen to 659.06, aligning with the 1.618 Fibonacci extension of wave A. After the completion of wave (C), traders can buy for the target up to wave B at 998.61.
I will continue to update the situation as it evolves.


NFLX to 700/800NFLX is looking good and steady. All the other big names have been making all-time highs, why wouldn't NFLX?
NOT ADVICE OR RECOMMENDATION


Possible Short NFLXI am looking NFLX to short. Current trading below 20 DMA. If it stays below 20 DMA, then can decline.
Stop would be today's high.

Long $NFLXOne of the most powerful patterns in the making - The Cup n Handle.
This is confirmed if prices stay above 482-85 range for 30 mins.
Pattern targets are 100 points higher


Investment_ NetflixNamaste!
Netflix has corrected almost 74% from the all time (swing) highs. This isn't new for Netflix. It had happen in the year 2011-12, when it corrected 82% from swing highs. It had moved >9000% since then (up to the latest swing high from Rs 7-8 price). Investing after a correction is a good idea, because it gives us more room for potential gains. And, there is no SL. In the worst case scenario, (if the company goes bankrupt), we don't sell. It's just the cost of execution (we lose 10% of our capital).
1. Do not invest more than 10% of your whole capital in this stock.
2. It is a good price to buy (invest) now. The current price is Rs 183 approx.
Thank you for your time.
Disclaimer: The analysis and idea I have shared is of my own. Please do your own due diligence before investing. The reward always comes with a risk.

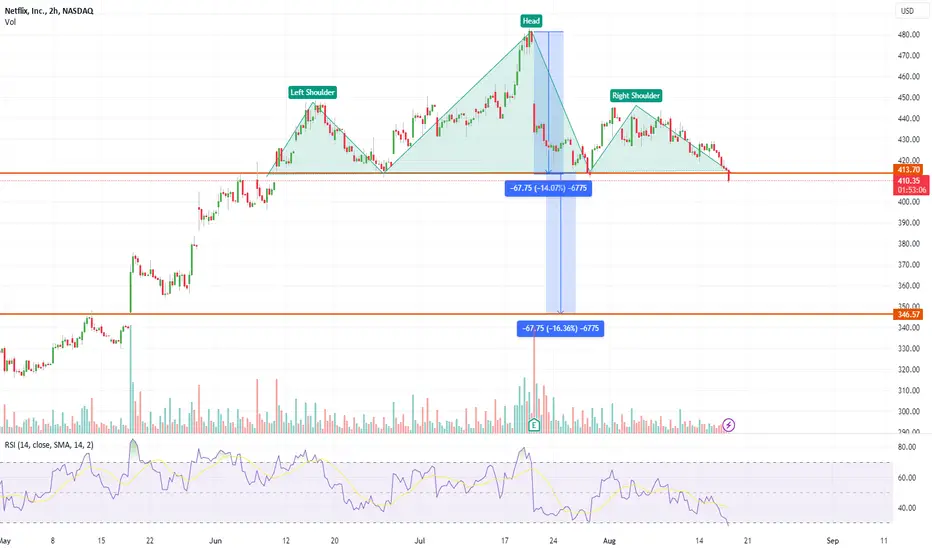
NETFLIX – Head n Shoulder breakdown – 16% downside potentialNetFlix has given Head and Shoulder pattern break down from 412 support zone.
Target: 385, 348
SL: Hrly candle close above 418
Note: Head and shoulder pattern usually indicates trend reversal pattern, so better avoid longs unless it reclaims 445 levels.
LONG NETFLIXNASDAQ:NFLX providing a good RR for long. Its at channel support with swing low of 315 as SL.
IF sl is not hit, high probability of hitting channel high

#NFLX bullishDespite NASDAQ:NFLX beating its earnings across the board, its stock came across some bearish moment. Here I believe we might see a reversal in trend, as noticeable a divergence signal from MACD & RSI both. Also, Considering today’s price action, a jump of almost 1.5% intraday from its 200 MA, we might continue to be bullish and breakout from the triangle as well.

netflix another example of curved patternhere i am publishing my idea on curved pattern
hope could be example for all

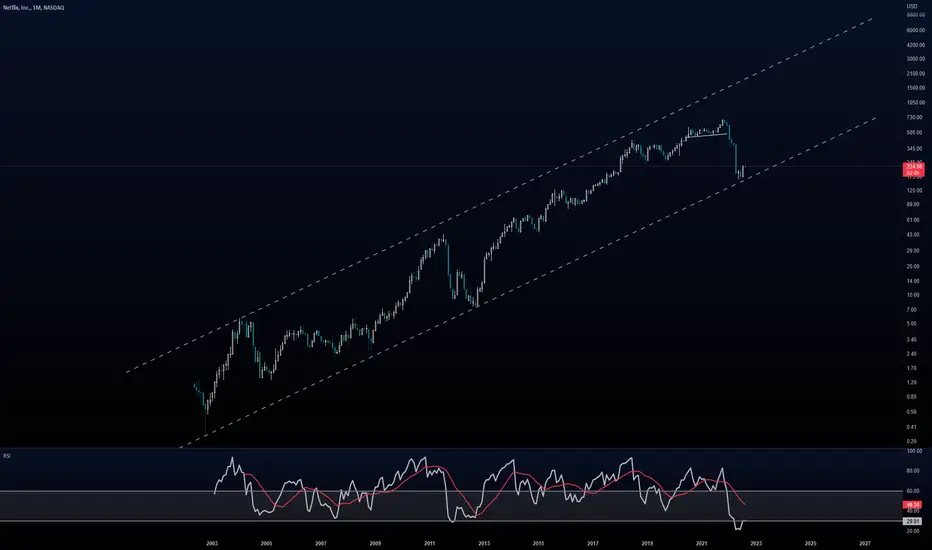
Next big moves in NFLXIt fell more than 70% from its high, and recovered more than 80% from the low, then again it is falling.
Case 1
In Jan 2004, the same thing happened. First fell more than 60%, rose 40% and again fell 54%. Then started to rally again.
Case 2
In July 2011. First fell 75%, rose 110%, fell 60%. Then a strong rally.
Case 3
Current situation. Fell 75%, rose 85%. Now might fall again. But if you believe in the company, it can be a period of accumulation.
From the past we can observe. Stock falls in 3 waves before making a new low. Using this I have done this analysis.
Disclaimer
This is not financial advice. Sumanyu Aggarwal is not an expert.

NETFLIX A very low list and high reward setup, next target 271At the downward channel, following the ascending channel with a small SL one can go long positionally for good returns in my opinion.
NETFLIX is a buy. Looks good for long term.Yes. Netflix even after such a fall it's in an ascending channel so I would think twice before shorting it. It can help its investors make good bucks if held for long term.

WILL NFLX COVER THE GAP ?What Is a Gap?
A gap is an area discontinuity in a security's chart where its price either rises or falls from the previous day’s close with no trading occurring in between. Gaps are common when news causes market fundamentals to change during hours when markets are typically closed, for instance an earnings call after-hours.
NFLX This rising wedge is at tight as it gets! 👀 Get your popcorn ready 🍿 📽️
Perf YTD 🔴 -61.84%
Perf Quarter 🟢 +2.70%
Perf Month 🟢 +24.91%
Perf Week 🟢 +1.72%

Netflix (NFLX) Stage Analysis Netflix (NFLX) weekly chart with Stage Analysis - Stage 4 stock.
Only for educational purposes, Not a buy/sell recommendation.

Netflix - Will it take U-Turn? Wave A in progress, Wave (5) of Wave A extending is unfolding and - bad news is, it is also extending
Looks like moving towards 107
Lets wait and see

Falling Knife Do Not Catch This #NetFlixHow sweetly it followed This indicator,
May be people got reward who followed this.
Will not recommend anything But I would Not suggest any longs here unless it makes price action again, till than please move safely here and for me any rise should be for sell only.
please refer to the chart.
Gratify if you appreciate the practice then you can like it, share it and
If you want me to investigate any chart for you then would cherish doing that for you.
Thank you for your time and support.
Stay safe.

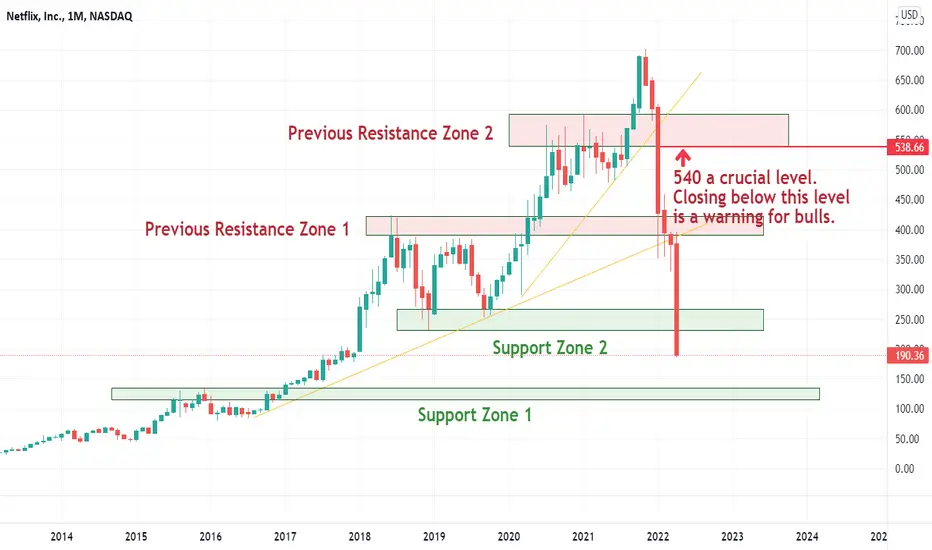
Is Netflix headed towards 120?This analysis is on Netlifx ($NFLX) which made a ATH of around 700 and now is present trading at 190 levels. Everything happened so fast, in a matter of just under a month of trading, that many investors lost big money. So what was the crucial level? And where were the supports? Why didnt the support work? Did Earnings alone spoil everything? Markets discount everything and charts have a way of telling the same because they represent unbaised price action. According to my analysis, 540 was a crucial level. A day closing below this triggered a major sell off. The next support was at 340 levels according to Fibonnaci retracement at 61.8%. But it didnt hold. So the next level is around 120!