Trade ideas
Amazon.com (AMZN) technical analysisHello, This is my first ever published Technical Analysis.
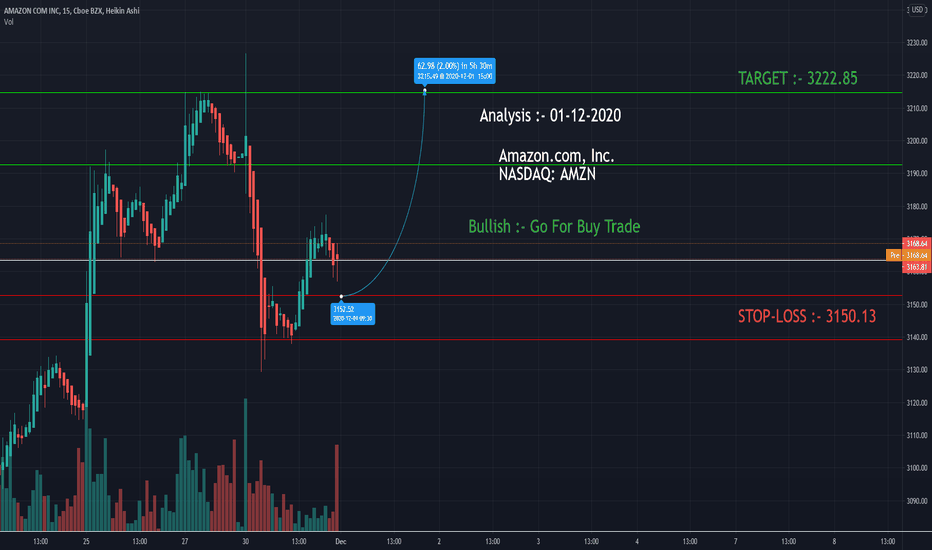
According to my analysis the price will go up.
We should take entry at 3262
The target should be at 3340
Stop Loss at 3234.
Note: This is just a Technical Analysis if by any chance my target doesn't become reality and you lose money then I will not be the liable person for your investment on any particular asset that you have made, only you will be the responsible for your trade/investment.
How to ride on a swing trade ??? Ex :AMZNHow to ride on a swing trade?
One good strategy in price action is to use 21 EMA and ride on swing trades for short or long terms. 21-day EMA can be called as the Goldilocks of all moving averages. 5,8,13 can be too tight and 50,100,200 are too loose for looking at moving averages, hence 21 EMA can be considered as a powerful average.
In this strategy 21 EMA LOW and 21 EMA HIGH are plotted on the graph forming a channel. Any channel breakout up or down triggers a buy or sell respectively. The bar which detaches with the bar which pierced out of channel can be used as a buy or sell. Please remember this bar should be in the trend up or down respectively to the earlier bar which is piercing out of the channel and not at same levels. In uptrend, high of that second bar can be used to buy and in downtrend, low of the second bar can be used to sell.
Put stop loss of one bar below for uptrend and one bar above for downtrend. Keep trailing as per the risk appetite. We can add during the trend when the candlestick bars touches the channel line and again detaches itself to follow trend, same second bar high should be used as explained earlier for buy or sell respectively.
Keep raiding this trend until the bars touch lower channel in uptrend and upper channel in downtrend respectively. There are many ways to take profit as per your money management. Book profit at 1:2 or 1:3 or 1:4 etc as per the risk. One best way is to put trailing stop loss at high of every bar, it can also be at low but if the size of bar is big and in case of reversal of trend, that bar length of profit would be lost. If the bars are too big then half of the bar can be used for stop loss to average out of profit on reversal. If the bars are far away from channel profits can be booked.
This works very well for 1 hour and above time period. Certain stocks may not fall into this strategy due to way they operate or may very rarely follow the above 21 EMA channel pattern.
Above chart is an example and we tried to put strategy as simple as we can. Exceptions to strategies will always be there, so please back test as much as you can to understand this method.
Hope this helps to gain a bit of knowledge!
Please press like or thumbs up button, if you like this strategy, Thanks
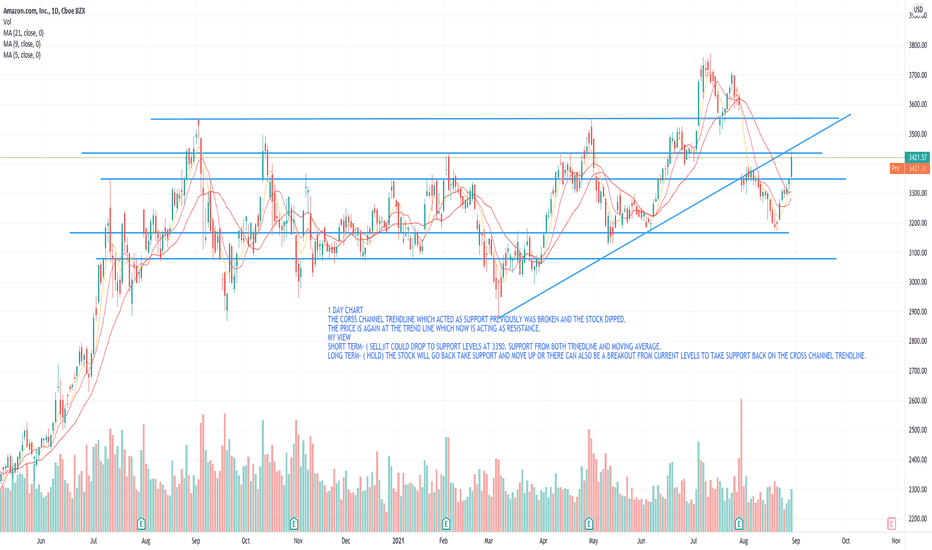
AMAZON VIEW AT CURRENT PRICE LEVELS1 DAY CHART
The cross channel trendline which acted as support previously was broken and the stock dipped.
The price has reached the cross channel again which can now act as resistance for a few days.
My view
Short term- (Sell) it can drop down to support levels back at 3350. Support from both moving averages and trendlines.
Long-term= (hold) as it is a Jan ce. It could go back, take support and have a strong up move.
AMZN MOVIN ON UPAMZN
BOX JUMPER. pretty boring chart pattern. box and jump. box and.... recaptured averages...can she stay above and fill the gap...if so thats >10%. that gets her above the box. maybe a nice jump up to the next trading range. macd is your friend on the daily; weekly still a little behind -- paytience .......
AMZN 1 Year Old Resistance Broken and Pullback Level TestedAMZN was Testing this level since Sep 2020, which recently had a Breakout @3575 Level. The Pull Back is also Complete and the @3575 Levels are tested.
This level was very strong Resistance for AMZN Price, which after breakout technically got converted into a Strong Support.
Might Think of going long with Stops around @3500.
Do follow for more trading setups like these
Thanks, if you have any queries/suggestions related to above pattern, feel free to type below in the comment section.
Amazon.com, Inc. viewPreviously in the chart, 3488.66 level has acted as a resistance, the recent candle gave closing above that level and expecting a good upside movement. For short term/intraday can expect a 3552.25 level as a 1st target. Ignore the trade if the upcoming candle opens below 3488 level. It'll be a good trade if candle opens above the 3488 level and also can be bought at 3488 level if visit this level (from above).
THIS VIEW OF MINE IS PURELY BASED ON TECHNICAL CHART, BEWARE OF NEWS AND OTHER FACTORS WHICH CAN AFFECT THE MARKET SENTIMENT.
Amazon a new high again in coming days!***Trade at your own risk** educational purpose only***
1. Looking good on RSI 1hr structure and daily higher high if volume kicks in then it'll be a great
2. price should hold 3240-3250 range then it's a bull sign, SL 3220-3225
3. Target T1 - 3284, T2 - 3300-3332, T3 - 3360 in short term


