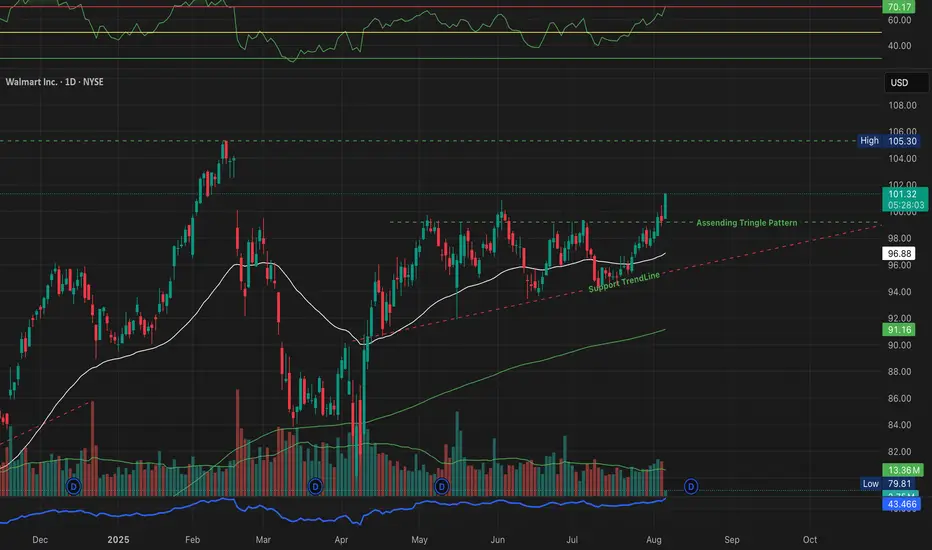
Has Walmart’s Ascending Triangle Breakout Been Confirmed?Walmart Inc. (Ticker: WMT), listed on the U.S. stock exchange (NYSE), appears to have formed a classic Ascending Triangle Pattern on the daily chart. As of August 6, 2025, the price has broken above the horizontal resistance near $100.60, closing at $101.16 with decent volume and strong bullish cand
Next report date
—
Report period
—
EPS estimate
—
Revenue estimate
—
2,602 CLP
19.17 T CLP
671.58 T CLP
4.36 B
About Walmart Inc.
Sector
Industry
CEO
C. Douglas McMillon
Website
Headquarters
Bentonville
Founded
1962
ISIN
US9311421039
Walmart, Inc. engages in the retail and wholesale business. The company offers an assortment of merchandise and services at everyday low prices. It operates through the following business segments: Walmart U.S., Walmart International, and Sam's Club. The Walmart U.S. segment operates as a mass merchandiser of consumer products, operating under the Walmart and Walmart Neighborhood Market brands, including walmart.com. The Walmart International segment includes operations of wholly-owned subsidiaries in Canada, Chile, China, and Africa, and majority-owned subsidiaries in India, as well as Mexico and Central America. The Sam's Club segment manages membership-only warehouse clubs and operates samsclub.com. The company was founded by Samuel Moore Walton and James Lawrence Walton on July 2, 1962 and is headquartered in Bentonville, AR.
Related stocks
WMTIn last 10 yr WMT has given handsome bull run. Recent profit booking may be start of profit booking which everyone may be looking.
80 is imp level to decide

Walmart Slow & Strong MovementThis year till date walmart is up in the 50% this movement is slow but the strong and simple trend, But Don"t worry this is not the first or not the last...

Wall Mart This Char Is Looking Beautiful The Wallmart Chart is showing in the Stready chart patter this chart is simple show Slow steady return.
This is fundamental good company, with Cashflow


Walmart Inc. - readying for a leapWalmart Inc. - Seems readying for a leap. Levels mentioned on the chart and as below:
Entry @ CMP 127
SL @ 120
Target @ 144

WALMARTBook profits or reduce position or exit long
some time back it was oversold which was the opportunity on back of negative news.
Now on the rise till new peak is not made book profits as it move near peak.
Expect near term correction or sideways volatility

WMT SHORTAfter a lot of time of DISDOS /
we want to see brake and close lower then 134
if the market prove to us that he want to go down .
we love this short
Target OMEK DISDOS /

$WMT Daily Target price 127 by 11/27. After potential next year around 216.
What is 216?
What is expansion and contraction of the universe?

See all ideas
Summarizing what the indicators are suggesting.
Neutral
SellBuy
Strong sellStrong buy
Strong sellSellNeutralBuyStrong buy
Neutral
SellBuy
Strong sellStrong buy
Strong sellSellNeutralBuyStrong buy
Neutral
SellBuy
Strong sellStrong buy
Strong sellSellNeutralBuyStrong buy
An aggregate view of professional's ratings.
Neutral
SellBuy
Strong sellStrong buy
Strong sellSellNeutralBuyStrong buy
Neutral
SellBuy
Strong sellStrong buy
Strong sellSellNeutralBuyStrong buy
Neutral
SellBuy
Strong sellStrong buy
Strong sellSellNeutralBuyStrong buy
Displays a symbol's price movements over previous years to identify recurring trends.
US931142EC3
Walmart Inc. 4.05% 29-JUN-2048Yield to maturity
5.25%
Maturity date
Jun 29, 2048
US931142DW0
Walmart Inc. 3.625% 15-DEC-2047Yield to maturity
5.25%
Maturity date
Dec 15, 2047
WMT5472137
Walmart Inc. 4.5% 09-SEP-2052Yield to maturity
5.20%
Maturity date
Sep 9, 2052
WMT5571329
Walmart Inc. 4.5% 15-APR-2053Yield to maturity
5.20%
Maturity date
Apr 15, 2053
US931142EV1
Walmart Inc. 2.65% 22-SEP-2051Yield to maturity
5.19%
Maturity date
Sep 22, 2051
WMT4887055
Walmart Inc. 2.95% 24-SEP-2049Yield to maturity
5.14%
Maturity date
Sep 24, 2049
WMT4055720
Walmart Inc. 4.75% 02-OCT-2043Yield to maturity
5.13%
Maturity date
Oct 2, 2043
WMT4117478
Walmart Inc. 4.3% 22-APR-2044Yield to maturity
5.11%
Maturity date
Apr 22, 2044
WMT3991377
Walmart Inc. 4.0% 11-APR-2043Yield to maturity
5.08%
Maturity date
Apr 11, 2043
US931142EU3
Walmart Inc. 2.5% 22-SEP-2041Yield to maturity
5.04%
Maturity date
Sep 22, 2041
US931142DB6
Walmart Inc. 5.625% 15-APR-2041Yield to maturity
5.00%
Maturity date
Apr 15, 2041
See all WALMARTCL bonds
Curated watchlists where WALMARTCL is featured.


Frequently Asked Questions
The current price of WALMARTCL is 97,238 CLP — it hasn't changed in the past 24 hours. Watch Walmart Inc. stock price performance more closely on the chart.
Depending on the exchange, the stock ticker may vary. For instance, on BCS exchange Walmart Inc. stocks are traded under the ticker WALMARTCL.
WALMARTCL stock has fallen by −0.39% compared to the previous week, the month change is a 2.57% rise, over the last year Walmart Inc. has showed a 31.05% increase.
We've gathered analysts' opinions on Walmart Inc. future price: according to them, WALMARTCL price has a max estimate of 123,789.05 CLP and a min estimate of 98,943.32 CLP. Watch WALMARTCL chart and read a more detailed Walmart Inc. stock forecast: see what analysts think of Walmart Inc. and suggest that you do with its stocks.
WALMARTCL reached its all-time high on Aug 11, 2025 with the price of 100,860 CLP, and its all-time low was 31,209 CLP and was reached on Mar 19, 2021. View more price dynamics on WALMARTCL chart.
See other stocks reaching their highest and lowest prices.
See other stocks reaching their highest and lowest prices.
WALMARTCL stock is 1.36% volatile and has beta coefficient of 0.76. Track Walmart Inc. stock price on the chart and check out the list of the most volatile stocks — is Walmart Inc. there?
Today Walmart Inc. has the market capitalization of 783.73 T, it has increased by 1.48% over the last week.
Yes, you can track Walmart Inc. financials in yearly and quarterly reports right on TradingView.
Walmart Inc. is going to release the next earnings report on Nov 20, 2025. Keep track of upcoming events with our Earnings Calendar.
WALMARTCL earnings for the last quarter are 664.06 CLP per share, whereas the estimation was 715.58 CLP resulting in a −7.20% surprise. The estimated earnings for the next quarter are 575.39 CLP per share. See more details about Walmart Inc. earnings.
Walmart Inc. revenue for the last quarter amounts to 173.24 T CLP, despite the estimated figure of 171.81 T CLP. In the next quarter, revenue is expected to reach 170.33 T CLP.
WALMARTCL net income for the last quarter is 6.86 T CLP, while the quarter before that showed 4.27 T CLP of net income which accounts for 60.56% change. Track more Walmart Inc. financial stats to get the full picture.
Yes, WALMARTCL dividends are paid quarterly. The last dividend per share was 227.27 CLP. As of today, Dividend Yield (TTM)% is 0.89%. Tracking Walmart Inc. dividends might help you take more informed decisions.
Walmart Inc. dividend yield was 0.85% in 2024, and payout ratio reached 34.51%. The year before the numbers were 1.38% and 39.73% correspondingly. See high-dividend stocks and find more opportunities for your portfolio.
As of Sep 22, 2025, the company has 2.1 M employees. See our rating of the largest employees — is Walmart Inc. on this list?
EBITDA measures a company's operating performance, its growth signifies an improvement in the efficiency of a company. Walmart Inc. EBITDA is 41.48 T CLP, and current EBITDA margin is 6.21%. See more stats in Walmart Inc. financial statements.
Like other stocks, WALMARTCL shares are traded on stock exchanges, e.g. Nasdaq, Nyse, Euronext, and the easiest way to buy them is through an online stock broker. To do this, you need to open an account and follow a broker's procedures, then start trading. You can trade Walmart Inc. stock right from TradingView charts — choose your broker and connect to your account.
Investing in stocks requires a comprehensive research: you should carefully study all the available data, e.g. company's financials, related news, and its technical analysis. So Walmart Inc. technincal analysis shows the buy rating today, and its 1 week rating is strong buy. Since market conditions are prone to changes, it's worth looking a bit further into the future — according to the 1 month rating Walmart Inc. stock shows the strong buy signal. See more of Walmart Inc. technicals for a more comprehensive analysis.
If you're still not sure, try looking for inspiration in our curated watchlists.
If you're still not sure, try looking for inspiration in our curated watchlists.