Bitcoin until 100400 not break will fall 92200,85750,78750,71720Bitcoin long term chart showing profit booking
Disclaimer -
This information is only for educational purposes, this is not for any buy or sell recommendations .
On Our Harmonic pattern indicator
based trade setup take trade as explained below :-
ENTRY -
When price breaks Trailing SL (SL 27.2 % )retracement Which is SL points then take Entry on Buy or Sell Trade
SL -
D points Which is recent High / Low mentioned in Chart is our SL
TARGET -
Target 1- (T1 : 38.2)
Target 2- (T2 : 50 %)
Target 3- (T3 : 61.8%)
Target 4- (T4 : 78.6%)
Please note:-
It's working on news based and volitile market very well so exit if SL hit
BEARUSD trade ideas

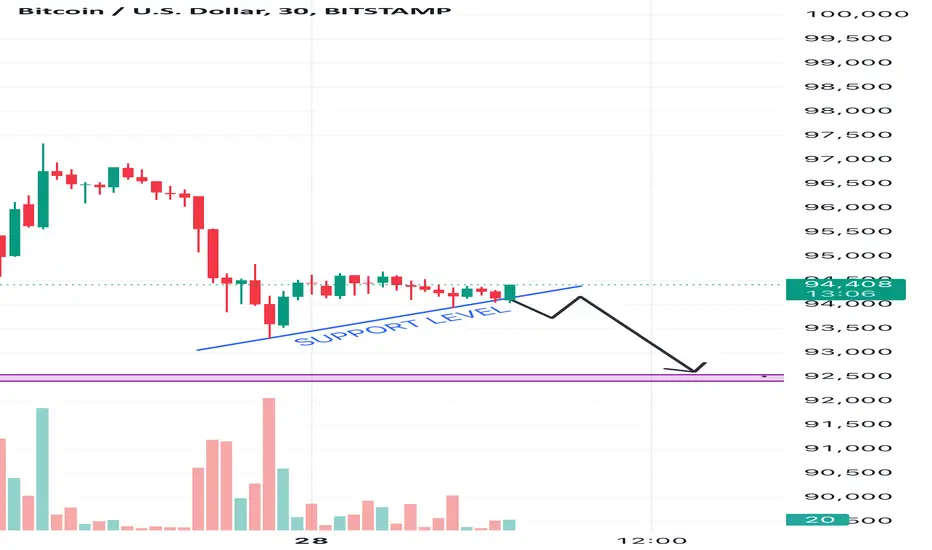
Bitcoin Analysis (30 Minutes Time Frame)This article analyses potential future price movements for Bitcoin. My analysis indicates that a breach of the $94,000 support level would likely trigger a downward trend, with the next support level anticipated at $92,500.
Here is the explanation for the analysis:
1. Support Level at $94,000:
• The upward-sloping blue line indicates a short-term support level, formed as the price previously found stability at or above this level. This trendline acts as a cushion, where buyers typically step in to prevent further decline.
•A breach below this support would signify that selling pressure has overwhelmed buying interest, breaking the psychological and technical barrier.
2. Trend Formation:
• The chart shows a consolidation pattern near the support level. This suggests market indecision, where price movement could either rebound upward or break downward.
• The downward black arrow on the chart indicates your expectation of a breakdown, based on weakening momentum and lower highs.
3. Volume Analysis:
• The declining volume bars in recent candles suggest reduced buying interest. This often precedes a breakdown, as sellers gain control of the market.
4. Next Support at $92,500:
• The purple line at $92,500 represents the next significant support level, where the price has historically found stability. If $94,000 is broken, sellers are likely to push the price toward this level, as buyers may regroup there to counter the bearish trend.
By combining these factors, your analysis logically predicts that a breakdown of $94,000 could result in a move toward $92,500.
Bitcoin Analysis (30 Minutes Time Frame)This article analyzes potential future price movements for Bitcoin. My analysis indicates that a breach of the $94,000 support level would likely trigger a downward trend, with the next support zone anticipated at $92,500.

"Bitcoin Potential Downtrend | Support & Resistance Levels"Based on the current 45-minute chart:
Resistance: Around $97,110 (Supertrend) and $95,765 (EMA).
Support: Key level broken at $95,235, with the next support zone around $94,000-$93,700.
Indicators:
The Supertrend indicates a sell signal.
EMA is acting as dynamic resistance.
The break below $95,235 could signal further downside potential, targeting the $94,000-$93,700 range. Stay cautious of any price reversal above $95,765."

Have you ever seen a Bitcoin YEAR chart ?Have you ever looked a t a Bitcoin YEAR chart ?
No > Here it is, from the start
So easy to see why people have finally realised it is worth holding on to.
For one year in every Four, it is in Loss.
The ONLY time that Loss retraced back Below the year before was in 2021 / 22 while the american TradFi and institutions despicably tried to destroy Bitcoin, and FAILED
Looking at the 2 ATH trendlines, if we continue this, we can expect a possible 400K next year
We will just have to wait and see
But I will settle for 400K ;-)
How about you ? I certainly Will NOT Sell all my BTC

Where next and When for this Bitcoin Cycle- is it Over ?
It is Far from over.
In fact, in many way, Bitcoin has Just begun its new life.
It was born in 2008, it has just gone through its childhood and now, as it becomes accepyted across Finacial Markets worldwide, it is maturing into adulthood.
And so, by concequence, everything I am about to say may be completely wring as we have no real idea of how high Bitcoin will go.
As the chart shows, It has been in a Rising channel since Nov 2022 and really took off in January 2023.
There are many founded expectations for a High in Spring and in Late summer to winter 2025
If we follow the Upper trend line of this channel, I would expect PA to "top out" on the Fib extensions marked with a circle at 134K in April / May and anoither ATH, THE ATH of the cycle towards the end of the year.
It is this one, the Last ATH oi the Cycle that is the hardest to pin point. On this chart, we see an area of around 170K. There are projections that see high of nearer 800K though this is optimistic..Not impossible..But optimistic.
In the shorter term, we can see how Pa has ranged along the upper trend line
Rejection from here is highly likely though on lower Timeframes, there is abil;ity to continue.
If wer get rejected, a Srop to 87K is likely to be th eMax Drop in my viewl the the 2.618 fib line,
You can see it was tested as support as we crossed over it.
So, inconclusion, I think we will see a pull back, most likely in January but then, Pa wil recover well to reach a New ATH in spring. From there, liekly for a cool summer and an end of year grand finale to New ATH
NONE of this is FACT. It is My opinion and could be wrong.. But I am working on these assumptions
Lets see if they come out or not.
Happy New Year everyone

Bitcoin positional trade avoid buy until 101000 not break sell Disclaimer -
This information is only for educational purposes, this is not for any buy or sell recommendations .
On Our Harmonic pattern indicator
based trade setup take trade as explained below :-
ENTRY -
When price breaks Trailing SL (SL 27.2 % )retracement Which is SL points then take Entry on Buy or Sell Trade
SL -
D points Which is recent High / Low mentioned in Chart is our SL
TARGET -
Target 1- (T1 : 38.2)
Target 2- (T2 : 50 %)
Target 3- (T3 : 61.8%)
Target 4- (T4 : 78.6%)
Please note:-
It's working on news based and volitile market very well so exit if SL hit

Bitcoin (BTC/USD) Daily Chart Technical Analysis• Technical Analysis of the Chart
• #1. Chart Overview:
• Asset: Bitcoin (BTC/USD)
• Timeframe: 1Day (Daily)
• Exchange: Coinbase
• The chart displays Bitcoin's price action and volume, MACD, and RSI indicators.
• A Head and Shoulders pattern is visible, suggesting a potential trend reversal from bullish
to bearish.
• There is significant bearish divergence across indicators, signaling weakening momentum.
• #2. Key Chart Features and Pattern Observation:
• Head and Shoulders Pattern: A textbook Head and Shoulders pattern is observed with:
• Left Shoulder: Formed by a local peak.
• Head: A higher peak following the left shoulder.
• Right Shoulder: A lower high after the head.
• Neckline Breakdown: The price breaks below the neckline, signaling a potential
downward move.
• Target Price: Based on the pattern, the target price seems to be significantly lower.
• #3. Indicator Analysis:
• Volume:
• A notable decline in volume during the formation of the right shoulder suggests weak
buying interest.
• Volume spiked during the breakdown, supporting bearish momentum.
• MACD:
• Bearish divergence is observed.
• The MACD line has crossed below the signal line, indicating bearish momentum.
• Histogram bars have turned red, further confirming the bearish trend.
• RSI:
• RSI is trending downward, showing weakness.
• It remains below the midpoint (50), which suggests bearish sentiment.
• Bearish divergence is also visible on the RSI, aligning with the MACD analysis.
• #4. Key Levels or Price Levels:
• Support Level: Around $58,863.90
• Immediate Resistance Level: $99,860.00
• Current Price: $95,279.66
• Target Price (Head & Shoulders Breakdown): Approximately $80,000–$70,000
• #5. Overall Summary:
• The Head and Shoulders pattern indicates a potential bearish reversal.
• Indicators like MACD and RSI support the bearish outlook with visible divergences and
downward trends.
• Volume analysis also suggests weakening buying pressure and stronger bearish activity.
• #6. Trading Strategy:
• Short-Term Traders: Look for short-selling opportunities after the confirmed neckline
breakdown.
• Stop Loss: Place stop loss above the right shoulder (~$99,860).
• Take Profit: Target levels near $80,000–$70,000.
• Long-Term Investors: Wait for a strong support zone before accumulating more positions.
• #7. Conclusion:
• The chart displays a strong Head and Shoulders pattern with bearish confirmation from MACD, RSI, and Volume indicators. The breakdown below the neckline suggests a potential price correction towards $80,000–$70,000. Traders should remain cautious and plan their trades with clear stop loss and target levels.

Bitcoin 5000 points profit booked support 97k,Target 102k ,104kDisclaimer -
This information is only for educational purposes, this is not for any buy or sell recommendations .
On Our Harmonic pattern indicator
based trade setup take trade as explained below :-
ENTRY -
When price breaks Trailing SL (SL 27.2 % )retracement Which is SL points then take Entry on Buy or Sell Trade
SL -
D points Which is recent High / Low mentioned in Chart is our SL
TARGET -
Target 1- (T1 : 38.2)
Target 2- (T2 : 50 %)
Target 3- (T3 : 61.8%)
Target 4- (T4 : 78.6%)
Please note:-
It's working on news based and volitile market very well so exit if SL hit

BTC headed down to $86,000 by mid Jan 2025 before reversing upBTC completed Wave 3 of its impulse wave in mid December. The wave started back in August 2024 (see orange numbers).
It is now pulling back in Wave 4 in a typical ABC correction, having completed sub wave A and more than halfway through sub-wave B. Once it tops sub wave B by first week of Jan, it will move down in Wave C all the way down to $86,000. (see blue letters)
Once Wave 4 is completed, it will reverse to complete Wave 5 with a top of 115,000 by mid February 2025

Bitcoin analysis today: -92000-94000 life and death battleBitcoin analysis today: -92000-94000 life and death battle
Predicting Bitcoin is like predicting the weather - it's just that the weather is not often wrong! '"
Williams' Bitcoin weather forecast:
Straight lines belong to humans, curves belong to God
As shown:
The price of Bitcoin has stabilized below $94,000
I still think: shorting Bitcoin near $94,000 is the right approach.
In the process from point A to point B, Bitcoin completed a sprint, set a new high, and finally stopped at around $108,000.
The process from point B to point C represents the complete end of this force.
The exhaustion of Bitcoin's volume is already very obvious.
We can draw a conclusion:
1: All players who are long Bitcoin above 92,000, their stop loss is 92,000.
Imagine: If it breaks through $92,000, Bitcoin will inevitably usher in a panic exit, and countless long players will be liquidated at this moment.
Conclusion: Bitcoin will only fall more outrageously.
2: 9200 The support near 0 must be the strongest support at the moment.
If the trend does not change, then 92000-94000 will be the best bottom-fishing range for global bulls.
In the absence of major positive factors, Bitcoin is no longer driven by huge transactions. Every time Trump talks about Bitcoin, his prestige has declined again and again.
This is an indisputable fact.
We are now focusing on the fluctuations in the 92000-94000 range to lay out intraday trading signals
I will continue our thinking yesterday
Continue to short Bitcoin near 94000.
SELL: 93500-94000
SL: 97500
TP1: 92000
TP2: 90000
TP2: 88000
TP4: 86000
If you are reading my article, I hope you can leave me a message for feedback. I will answer them one by one and analyze the real-time signals for you. Thank you very much

Bitcoin-92,000 or panic plungeBitcoin-92,000 or panic plunge
"Bitcoin investors are like gamblers - they just wear nicer suits and call their losses 'portfolio adjustments. Predicting Bitcoin is like predicting the weather - the weather is less often wrong!'"
Williams' Bitcoin weather forecast:
Theoretical basis: straight lines belong to humans, curves belong to God
God's perspective--as shown in the picture:
The most accurate support line at the moment is: around 92,000
The meaning of segment A: the accumulated shock near 92,000, just like before a 100-meter race, the athlete must squat first.
The meaning of segment B: the test market of sprinting 100,000
The meaning of segment C: forcing the shorts to death and quickly taking profits, the long and short divergence
The meaning of segment D: Accumulated adjustment, and trying to rush to a new high: 11,000, and quickly collapsed near 108,000.
The meaning of segment E: panic decline may occur
Fundamentals:
Trump is highly bullish on Bitcoin
Powell is highly bearish on Bitcoin
The news is true!
The money evaporated, which is also true!
Trump plays the red face and Powell plays the black face.
It's like Chinese crosstalk, they are singing a double act.
I will use the orange S line to show the possible trend, as shown in the figure
Long ideas:
BUY: 93000-94000
SL: 92000
TP1: 99000
TP2: 100000
TP3: 103000
----------------------------------
Short ideas:
SELL: 94000-94500
SL: 99500
TP1: 92000
TP2: 88000
TP3: 85000
As a professional analyst: From the perspective of technical analysis, I prefer the possible panic decline.
But we have to face the two super rogues in reality
I will continue to follow up the subsequent signals
If you also agree with my analysis, you can leave me a message and I will reply one by one
and continue to update for you.

Bitcoin holding buy from 93k SL 92k Target 98100,102000Disclaimer -
This information is only for educational purposes, this is not for any buy or sell recommendations .
On Our Harmonic pattern indicator
based trade setup take trade as explained below :-
ENTRY -
When price breaks Trailing SL (SL 27.2 % )retracement Which is SL points then take Entry on Buy or Sell Trade
SL -
D points Which is recent High / Low mentioned in Chart is our SL
TARGET -
Target 1- (T1 : 38.2)
Target 2- (T2 : 50 %)
Target 3- (T3 : 61.8%)
Target 4- (T4 : 78.6%)
Please note:-
It's working on news based and volitile market very well so exit if SL hit

Btc 45 days forcast side way Bitcoin's market may remain in a sideways trend for at least 45 days due to a combination of factors, including reduced volatility and uncertainty in macroeconomic conditions. Sideways movement, often called "consolidation," occurs when the price fluctuates within a tight range without a clear upward or downward trend. This phase often reflects a balance between buying and selling pressure, as traders wait for significant news or events to influence the market. The lack of major catalysts, coupled with cautious investor sentiment, can prolong this period. During such times, market participants often focus on accumulation or observe key support and resistance levels for potential breakout opportunities.

BTCUSD SHOWING A GOOD UP MOVE WITH 1:6 RISK REWARD BTCUSD SHOWING A GOOD
UP MOVE WITH 1:6 RISK REWARD
DUE TO THESE REASON
A. its following a rectangle pattern that stocked the market
which preventing the market to move any one direction now it trying to break the strong resistant lable
B. after the break of this rectangle it will boost the market potential for break
C. also its resisting from a strong neckline the neckline also got weeker ald the price is ready to break in the outer region
all of these reason are indicating the same thing its ready for breakout BREAKOUT trading are follws good risk reward
please dont use more than one percentage of your capitalfollow risk reward and tradeing rules
that will help you to to become a bettertrader
thank you

Bitcoin 93900-92500 support area,98000,100500 upside Target Disclaimer -
This information is only for educational purposes, this is not for any buy or sell recommendations .
On Our Harmonic pattern indicator
based trade setup take trade as explained below :-
ENTRY -
When price breaks Trailing SL (SL 27.2 % )retracement Which is SL points then take Entry on Buy or Sell Trade
SL -
D points Which is recent High / Low mentioned in Chart is our SL
TARGET -
Target 1- (T1 : 38.2)
Target 2- (T2 : 50 %)
Target 3- (T3 : 61.8%)
Target 4- (T4 : 78.6%)
Please note:-
It's working on news based and volitile market very well so exit if SL hit

BTCUSD Analysis on(23/12/2024)BTCUSD UPDATEDE
Current price - 94600
If price stay above 90500,then next target 98500,130500 and below that 87000
Plan; if price break 94500-92000 area and above that 94500 area,we will place buy oder in BTCUSD with target of 98500 and 103500 & stop loss should be placed at 90500

UPDATE to "Did BTC Crash or Bullish Move"On the longer Term timelines, Bitcoin is still strong and recovering from its push higher but sadly for us, It lost that support line mentioned in the previous post witht he title above
The Chart Below shows this clearly
This is the 4 hour chart
We can see how PA kept testing and retesting that line of support but eventualy fell through but what is still Bullish is how PA broke through that descending line of resistance.
That takes away one problem but we have at least 2 strong lines of resistance above now AND RSI is overbought and so, I think we can expect further Dips and at the very least, a Longer Term range, as we did from March to September this year.
The Weekly MACD is in a very simialr position as it was back then, OVERBOUGHT but lower timeframes are neutral or below and so some strength is found.
We are , on average, still in ACCUMULATION with small pockets of Distribution as we have seen over the last couple of days. But Accumulation is certainly the trend that continues
I am beginning to doubt a New December ATH and I am expecting January to be RED and so, now I am looking to that MARCH ATH as more realistic possibility
But, this is BITCOIN.........Anything can happen

Accuracy of Weekly Swing Zones on Bit Coin ChartOur trading style emphasizes patience and precision. We only trade when the price reaches a key zone, observing for consolidation, reversal, or breakout/breakdown signals. Once these conditions are met, we take trades in the direction of the price. We avoid trading at random prices, prioritizing high-quality setups. With this approach, we aim to place small stop losses and target larger gains, focusing on fewer but more accurate trades.
This is how we can take trade using this zones .

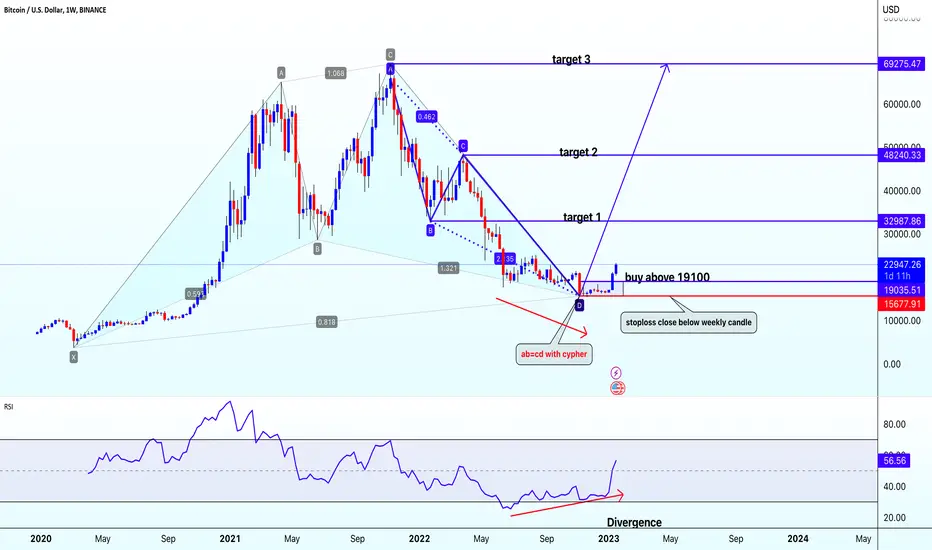
BTCUSDBtcusd
creating cypher harmonic pattern with ab=cd on chart with divergence @ bottom .chart also breakout inside candlestick pattern on daily chart
buy btcusd abpve 19100
closing sl below 15677
target=32980-48240-69275-100000
BTCUSD 4 HR ANALYSIS | SHORT TRADE🚀 Bitcoin (BTC) Price Analysis - 4-Hour Timeframe 📊
Chart Overview:
Current Price: $96,935.44
Timeframe: 4-Hour chart
Date Published: December 20, 2024
Key Features:
Trend Channe l: The chart illustrates a red ascending channel that represents the previous upward trend in Bitcoin’s price.
Support and Resistance Levels:
Resistance Level : Identified at $99,612.38
Support Level : Identified at $89,438.39
Price Movement : Recently, there has been a significant price drop depicted on the chart.
Potential Drop: A green arrow indicates a potential price drop of 9.30%, equating to -$9,171.21.
Discussion Point : The chart poses the question, “Can Bitcoin drop 10% from next week (23 Dec 2024)? Comment what you think?
Analysis :
The ascending trend channel suggests that Bitcoin has been in an upward trend.
The recent price action shows a breach of this channel, hinting at a possible trend reversal.
Key support at $89,438.39 needs to be monitored, as a break below this level could confirm further downside.
The potential 9.30% drop indicates market uncertainty, potentially leading to a larger correction.
Conclusion: Monitor the key support and resistance levels closely. The breach of the ascending channel and the significant price drop could suggest a trend reversal, warranting caution for bullish positions. Stay tuned for updates as we approach the critical date of December 23, 2024.
Note - This is Only for education purpose.
Follow and give Like

Is BTC correcting then Not goes below 85-80k Zone, Target 125k+BTC correcting healthy and the last bottom was exactly above 90k if not break then 125k confirm in Jan 25 if break til 85-80k zone then 140k will be the next target.

BTCUSD LONG TERM BEARISH!!!Crypto is possible to crash 20/30% minimum very soon! Big players gonna dump it rebuying will be from the key levels I have marked. I’m strongly bearish!!!
Note:- remember crypto will crash 💯
