BTC bullishBITCION is making its way up to fish off the retracement, but could possibly keep going on up too!
BEARUSD trade ideas

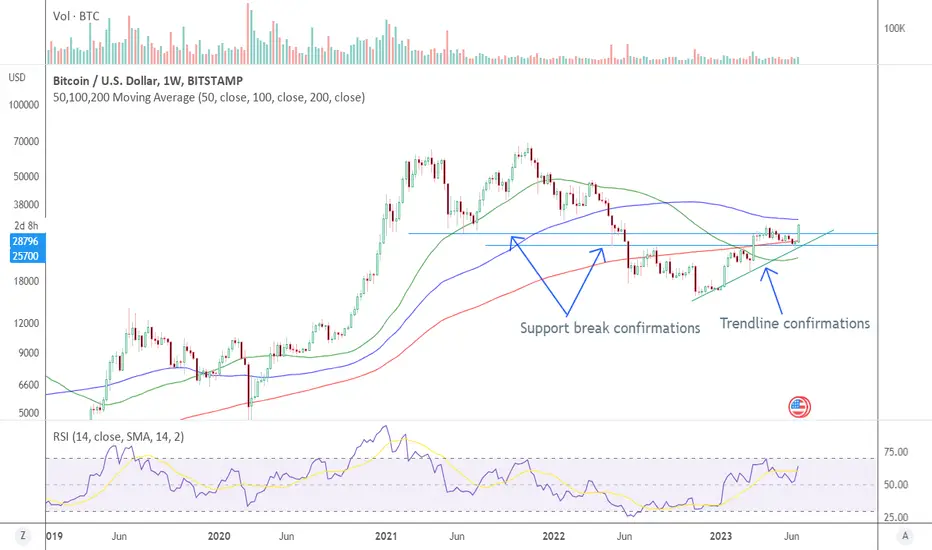
Bitcoin trend confirmations it's on track for all time highsThe key to reversal of a trend is price structure and progressive confirmation
Bitcoin created triple bottoms in november 2022 followed that up with an uptrend, then created another bottoming price action in march
The trendline created using these bottoms got further confirmed in june as it broke above 31k after 1 year
Along the way it managed to break important levels that further strengthen the view that worst is over
This trend reversal now is good enough for Bitcoin to be taken to new ATHs. Also this view gets a lot of room because now Bitcoin can afford a deep correction and still maintain a bullish trend
If it manages to see a weekly closing above 31k, it can post more gains immediately, if not we may see a rally after some correction
Disclosure: Views shared for educational purposes
BTC new ATH by the end of 2023 or in 2024?Hi dear community and my lovely followers.
As you see all my analyses published in May played out ideally. /Check my previous publications with comments/. I told you many times I don't expect BTC to go below 25K with candle close, BTC btttomed at 24.8K and pumped in an aggressive way towards previous high 30-31K.
I'm looking at monthly chart of BTC and have drawn all major zones and levels that will have vital role in coming weeks and months. Definitely BTC will become very sensitive at 36-37K zone and react at that zone which is Monthly Bearish Breaker, FVG, lowest point of daily and 2W bearish OB. If it manages breaking 37K more likely it will be rejected at 40-42K which is not only daily and 2W bearish OB with mean threshold 41K but also Inverse H & S target and upper target of inverted descending triangle. To tell the truth it is less liekly that BTC will break through the mentioned zones without rejection and some period of consolidation below it.
When BTC reaches to the mentioned zone BTCD will reach 58-60% major resisatance zone and we'll see deep retrace with mini altseason before new ATH and Legendary alt season after new ATH.
Check all charts and comments below this analysis/.
Above mentioned levels, the last major resisatnce before new ATH is 48-53K. As you see there is monthly bearish OB at 43-45.5K but I don't expect price to react at that zone coz there is monthly IDM+ BSL above 48K which will be taken out and price will hit monthly FVG at 48-53K/Mean threshold 50.8K/. After reaching 48-53K I expect deep correction towards 28-30K. MM who have been accumulating huge amount of BTC at 24-28K, they will distribute their accumulated BTC at 48-53K when dumb money starts screaming new ATH is coming and FOMO into it MM will dump price to 28-30K. Which will prolong new ATH by Q1-Q2 2024 maybe a little bit longer. /Green & Blue scenario with targets 160-180K/
If we don't see deep retrace or correction at above mentioned zones and BTC reacts with short term shallow pullbacks, we can see new ATH by the end of 2023 with parabolic move/Orange scenario/ with the target 72-85K/.
Dear community stay level headed, keep patience and don't be shaken out new ATH is coming either by 2023 or in 2024. Be prepared for both scenarios, As soon as BTC reaches to the mentioned zones I will update my ideas and let you know what will come next and which scenario has higher probability to play out.
If you look through all my publications since June 2022, I nailed out the first bottom of BTC at 18.5K/a real bottom/ in June 2022, then 2d bottom at 15.5K/Spring-bear brap/ in November 2022, Pump from 15.5K to 25K, dump to 19-19.5K, pump to 28-30K, dump to 25K and coming pump to at least 36-37K.
If you like my ideas and analyses don't forget to like, comment, retweet and show your support. Have a good day with winning trades. I wish you health and welth)).

BITCOIN Weekly Parabolic ChartBITCOIN weekly Chart Analysis
As per previous HYIP growth into last 5-7 days by Market news of Bitcoin ETF, BTC created growth of surprising bullish via market News Trap, but at this situation it never break-out this year high of $31.1k and revert from $30.8k.
So, at this situation of trapping, max. chances it will retest $24k-25k soon up to July 2023, and then from august it will be goes Bullish again and that time Altcoins goes Bullish too and major chances of break BTC $50k will be in Dec 2023 approx. with this year #ATH of $75-80k.
Always #DYOR before investing in Crypto currency at this volatile situation and Trade wisely by using of Stop Loss.
Must LIKE & SHARE.

BITCOIN BULLISH STRUCTURE 1 HOUR This is BTCUDT 1 hour frame long position. As per my setup it has given a long entry breaking previous swing high and now that is acting as support. Targets are marked with yellow lines upside. The structure is simple with finding Demand & supply zone. I always prefer horizontal support as I do not find trendline useful my style of trading. The RR is always 1:5 + in every trade I take.

Elliot Wave Supply Suplly and Demand BTCPlease find the Next set of Target BTC with Supply and Demand ticks and Elliot wave 5 Pattern

Bitcoin bybit chart analysis June 21
Hello
It's a Bitcoinguide.
If you have a "follower"
You can receive comment notifications on real-time travel routes and major sections.
If my analysis is helpful,
I would like one booster button at the bottom, please.
Bitcoin 30 minute chart.
It is a light blue finger one-way long position strategy.
Today at Tetherdominance
Since the conditions are a bit tricky, I finished it with a little shaking motion.
There is a Nasdaq indicator announcement at 11:00 pm, so please refer to it.
*At the time of the light blue finger movement path
long position strategy
1. Entry into long position at $28343.5 / stop loss when breaking the green support line
2. $29507.5 1st target -> Top section 2nd target
28702.5 dollars Intermediate wave can be operated in real time
I hope you can refer to it and use it.
From the current position, if it is maintained without breaking away from the green support line
in the spot exchange
Job Alt -> In order of the final major altcoin
Fire fields can be connected.
My analysis is for reference only.
I hope you operate safely with principle trading / stop loss essential.
thank you

BTC FORMED BEARISH SHARK PATTERN Btc clearly formed bearish shark pattern and lot of resistance facing here, Most of the miners started selling Btc and exchange inflow also increasing, All this factors supporting btc having 31500 has huge resistance zone and next support levels are 28500, 24800, 24200, 23800, 20000.
#Bitcoin #nft #bnb #eth #btc #BSC #Binance #trading #altcoins #cryptocurrency #crypto

Get ready for BTC breakout BTC - After bouncing from 25000$ Trendline support and horizontal support zone, it is testing falling wedge (upper yellow Trendline) . Keep an eye on falling wedge breakout and retest.
Entry, SL, Target given in chart
Thanks

Bitcoin at a key pivot level on the daily chart Bitcoin took support at the neckline of the head and shoulder pattern and now is back to the former resistance levels from where it fell. This is a key pivot level and any break above this will open up a substantial upside for the crypto currency. We have also been getting a good rally in the equities and is there now a case when the riskier assets are being favored? There is the powell testimony today and that will move the counter for sure. But for now and from a technical perspective this rally on the daily chart means the uptrend is intact and that we are more likely to get a breakout than get a breakdown from here on. So wait for any break above the level and then go long.

BTCUSDT at the Gann Rejection point Perfect Gann Rejection point lets see toffee SL & taking a reasonable risk for 1:10X gains


BTCUSD 1dtf good news for crypto inverstorsBtcusd 1dtf solid Breakout from daily time frame chart
Upcomming days will be intresting coz market is at peak btc is starting its rally
Lets wait and watch

Quick Scalp BTCRisker trade, as we are taking counter trend.
We have reacted our Volume Imbalance, Expect to reach other Volume Imbalance.
Short Scalp from the OB with Aggressive SL

BITCOIN at Broadening Wedge Top PatternBITCOIN 1-Hr. CHART ANALYSIS
As per hourly chart of Bitcoin, its moving at Broadening Wedge Pattern for again a bullish trends towards FWB:29K , but still as per Daily chart pattern, its final cut-off point is near about $28.5k to $29.5k for another Divergence cycle of Downtrend too...
so, invest & trade wisely by using #StopLoss and #DYOR always.
must LIKE & SHARE

BTC Back to $10k?? The BTC is trading the 6month in Bullish Fair Value Gap, thats why it is bullish right now.
But if it the 6month Candle Stick Fails to Close above the 6month Fair Value Gap, then we can see the Bear Market for 2024, 10more days to go to form a new 6month Candle.
Also there is a Volume Imbalance, which market has to Balance before going up.
Higher Volume Imbalance Act as Magnet in the Market.
NOTE -
Big Panic Sell might happen in BTC.
Be-careful while Investing Longterm in BTC, Market maker are taking Liquidity to Short and play Against to your Long Position.
DON'T FALL IN THERES TRAP.

Get ready for BTC pumpBTC -after bouncing from 25000$ Trendline and horizontal support zone, keep an eye on Falling wedge (upper yellow Trendline)
Entry can be taken buy side Once breakout and retest is done as shown in chart

Bitcoin bybit chart analysis June 19Hello
It's a Bitcoinguide.
If you have a "follower"
You can receive comment notifications on real-time travel routes and major sections.
If my analysis is helpful,
I would like one booster button at the bottom, please.
Bitcoin 30 minute chart.
It is a one-way long position strategy.
I made a strategy by focusing on the 1+4 rebound section.
In the case of tether dominance, there is a strong rebound section from the 12+ daily bar.
Move sideways moderately from the current position, and after tomorrow
Scenarios with strong declines look best.
The beat touched the 3-hour support line of the Bollinger Band.
Even if there is a rebound from the current position, it will be difficult to break through the orange resistance line.
There are no significant indicators on the NASDAQ.
I've trimmed it down to a reasonable level.
*At the red arrow path
long position strategy
1. Entry into long position at $26330 / stop loss when breaking the light blue support line
2. $26622 long position target -> Great section 2nd target
Because today there is a high possibility of sideways
I took a little more leeway on purpose.
Please pay attention to the movement of tether dominance.
My analysis is for reference only.
Please operate safely as principle trading / stop loss is essential.
thank you

BTC is really Hot right now!!!!There is a Volume Imbalance in the BTC, We can see a short sell from this POI.
keep the SL above my supply Zone (risky one).
Right now the market has reacted to sellside OB,
if this OB fails to hold, then the price will come up to my Supply POI,
after grabbing liquidity from the OB we can see a good reacting from the Supply POI.
Let's see how market deliver the price.

BTC/USDT ~ Weekly Overview The past week for Bitcoin was full of volatility and recovery as the current price level stands at a 2.39% gain on a weekly basis.
As the overall market conditions got heated up due to the regulatory environment, BTC broke below the crucial level of FWB:25K in the past week. However, there was a strong bounceback after it crossed the 0.786 FIB level.
EMA-20 which acted as the support level for the past week might be turning into resistance mode as highlighted in the chart.
Considering technical indicators, the RSI level is struggling to cross above the neutral zone. The DMI suggests there is still negative sentiment prevailing for BTC as -DI (23.80) is moving above +DI (13.92) and ADX (20.56).
Overall, the resistance levels can be placed at FWB:27K and $29K. On the contrary, support levels can be placed at FWB:25K and $23K.

Bitcoin break out coming 38000$ 🚀🚀🚀Bitcoin bounce from trend line/horizontal support as per my previous analysis and as soon as BTC price break EMA & Falling wedge. then we can see good upward movement in BTC...
if it fails to break then we see BTC 20k$.
Lets seen what BTC offers to us.


BTCUSD 1d time frameit looking like flag and pol pattern and also take support from 200ema on day time frame if it break above than it gives good returns.
