Gold Trade Plan - Nov ExpirtyMCX:GOLDM1! Might give entry once again. Booked more than 10R in last trade. Let's see how it goes.
Trade ideas

XAUUSD: 25/09/25 - TP HITMarket is side ways in Asian session
1hr, 4 hr no clarity in direction ,( In such cases look for rejections in lower TF,
We have candle rejections in 30 min at down side , probability of price moving upside in more )
Anticipated upside move during London session
Entered during pullback , once candle broke the resistance

Part 1 Candle Stick Pattern Understanding Option Trading
Option trading is a segment of financial markets that allows investors to buy or sell the right to buy or sell an underlying asset at a predetermined price within a specific time frame. Unlike traditional stock trading, options provide leverage, flexibility, and risk management tools, making them appealing for both hedging and speculative purposes.
Options are derivatives, meaning their value is derived from an underlying asset, such as stocks, indices, commodities, or currencies. An option does not grant ownership of the asset itself but gives the holder the right to engage in a transaction involving the asset.
Types of Options
Options are broadly categorized into two types:
Call Options
A call option gives the buyer the right (but not the obligation) to buy the underlying asset at a specified price, called the strike price, before or on the expiration date.
Buyers of call options generally expect the underlying asset’s price to rise, allowing them to purchase the asset at a lower price than the market value.
Sellers (writers) of call options receive the option premium upfront but take on the obligation to sell the asset if the buyer exercises the option.
Put Options
A put option gives the buyer the right (but not the obligation) to sell the underlying asset at the strike price before or on the expiration date.
Buyers of put options generally expect the underlying asset’s price to fall, allowing them to sell the asset at a higher price than the market value.
Sellers of put options receive the premium but face the obligation to buy the asset if exercised.
Key Components of Options
To understand option trading, one must know the following components:
Underlying Asset – The security or asset on which the option is based (e.g., a stock like Apple or an index like Nifty 50).
Strike Price (Exercise Price) – The predetermined price at which the option can be exercised.
Expiration Date – The date on which the option expires. After this date, the option becomes worthless.
Premium – The price paid by the buyer to the seller for the rights conferred by the option.
Intrinsic Value – The difference between the underlying asset’s current price and the strike price, representing the real, immediate value of the option.
Time Value – The portion of the premium that reflects the possibility of the option gaining value before expiration. Time decay reduces this value as the expiration date approaches.
How Options Work
Let’s illustrate with an example:
Suppose a stock is trading at ₹1,000, and you buy a call option with a strike price of ₹1,050, expiring in one month, paying a premium of ₹20.
If the stock rises to ₹1,100 before expiration, you can exercise the option to buy at ₹1,050, making a profit of ₹50 per share minus the premium, i.e., ₹30 per share.
If the stock stays below ₹1,050, you would not exercise the option, losing only the premium of ₹20.
This example highlights two key advantages of options:
Leverage: You control more assets with less capital compared to buying the stock outright.
Limited Risk: The maximum loss for the buyer is the premium paid, unlike stock trading where losses can be higher.

XAUUSD : 24/09/25 - SL HIT 1. Entered a pullback trade at sell side during NY session
2. Anticipated price to fall once resistance candle has formed
3. Took Sell side entry once running candle low was broken after making top wick
4. SL was hit ( Managed risk )
Mistakes:
1. The resistance confirmed candle body is not big, Also , the resistance candle wick is over extended
2. The running candle ( Entry candle ) first formed directly bottom wick with 15 pips , the price has moved down 15 pips already and i have entered on break of low of that running candle , which is over extended

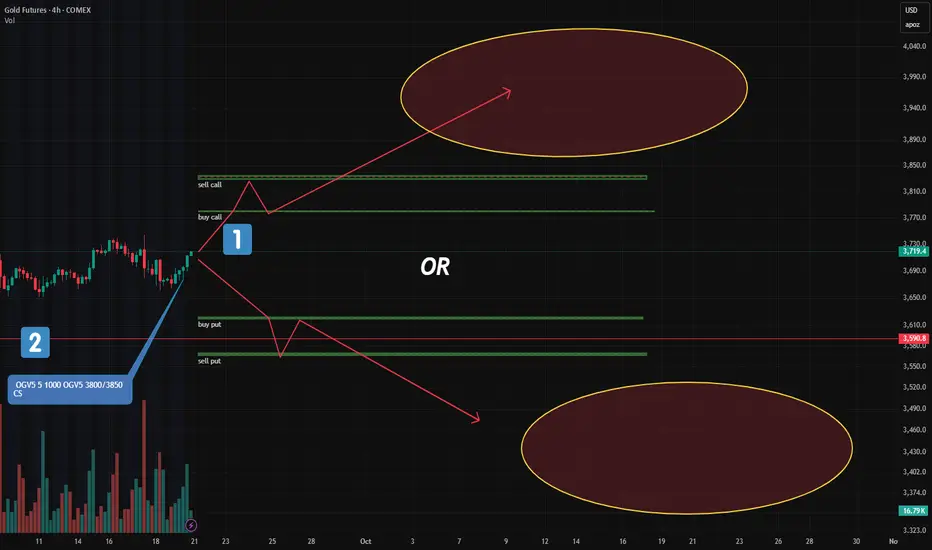
Gold: Major New Option Portfolios Signal Strong Moves AheadFriday’s CME report showed a surge in large option blocks in gold — two of them stand out.
🔹 1. "Long Condor" on December Futures (GCZ24)
This is the most significant structure added:
Targets a move below $3,620 or above $3,780
In other words: a breakout is expected, not consolidation
📌 Key point:
A "Long Condor" profits from volatility, not direction.
It wins if price moves sharply — up OR down — but loses if it stays flat.
🔹 2. Bull Call Spread (Oct Series): $3800–$3850
Another key play:
A classic bullish call spread at 3800/3850
Target: upside beyond current levels
But here’s the difference:
Unlike the "Long Condor", this one needs a clear upward move — and soon. Within a few days.
This isn’t about volatility.
It’s a directional bet that gold will rise.
🧠 Bottom Line:
One portfolio says: "Breakout coming — no matter which way."
Another says: "Gold goes up — and soon."
Are they aligned?
Contradictory?
Or could both win?
Trade smarter, not harder! Looking to boost your profits with valuable market insights and data-driven entry points? Join us or keep moving!
Gold start sell on rise until 3705 nit break on comex Gold mcx start sell on rise until 3705 not break on gold comex , if gold comex break 3615 then short term downtrend will start .
3560,3515, 3480 downside target
Comex and mcx price may differ because of USDINR price movement
XAUUSD - 19/09/25 - BEP1. Breakout happened during Asian session
2. Expected price to retarce during the Asian session
3. Support confirmed during London session
4. Entered on BPCH
5. Candle flipped to red after my entry
6. Closed 70% of the position during flip
7. Remaining 30% closed at 1:1

Part 2 Support and ResistanceHow Options Work
Options allow traders to speculate or hedge in different market conditions. For example:
Buying a Call Option: If an investor expects a stock’s price to rise, they can buy a call option. If the stock price exceeds the strike price, the option holder can either sell the option at a profit or exercise it to buy the stock at a lower price.
Buying a Put Option: If an investor anticipates a decline in the stock price, they can buy a put option. If the stock price falls below the strike price, the option holder can sell the stock at a higher-than-market price or sell the option for a profit.
Options can also be sold/written, allowing traders to earn the premium as income. However, selling options carries significant risk because the seller may have unlimited loss potential if the market moves against them.
Options Pricing and Valuation
The value of an option is influenced by intrinsic value and time value:
Intrinsic Value: The difference between the underlying asset’s current price and the strike price. For example:
Call Option: Intrinsic Value = Max(0, Current Price – Strike Price)
Put Option: Intrinsic Value = Max(0, Strike Price – Current Price)
Time Value: The portion of the premium that accounts for the time remaining until expiry and the expected volatility of the underlying asset. Options with more time until expiration generally have higher premiums because there’s a greater chance for the underlying asset to move favorably.
Additionally, models such as the Black-Scholes model are used by traders and institutions to estimate theoretical option prices, considering factors like the underlying price, strike price, time to expiration, volatility, and interest rates.
Benefits of Options Trading
Options trading offers several advantages compared to traditional stock trading:
Leverage: Options allow investors to control a large number of shares with a relatively small investment. This amplifies potential gains (and losses).
Flexibility: Traders can use options to speculate, hedge, or generate income, offering multiple strategic possibilities.
Risk Management: Options can act as insurance for existing positions. For instance, buying a put option can protect a stock holding from a sharp decline.
Profit in Any Market Condition: Options strategies can be designed to profit in bullish, bearish, or even neutral markets.

XAUUSD - 18/09/2025 - Tp Hit 1. Price broke support during London session
2. Expected price to retrace ( pullback ) during Pre NY
3. Resistance confirmed during Ny session
4. once price broke the newly formed support and closed below it ,
expected fall
5. NYSE open volume push happened

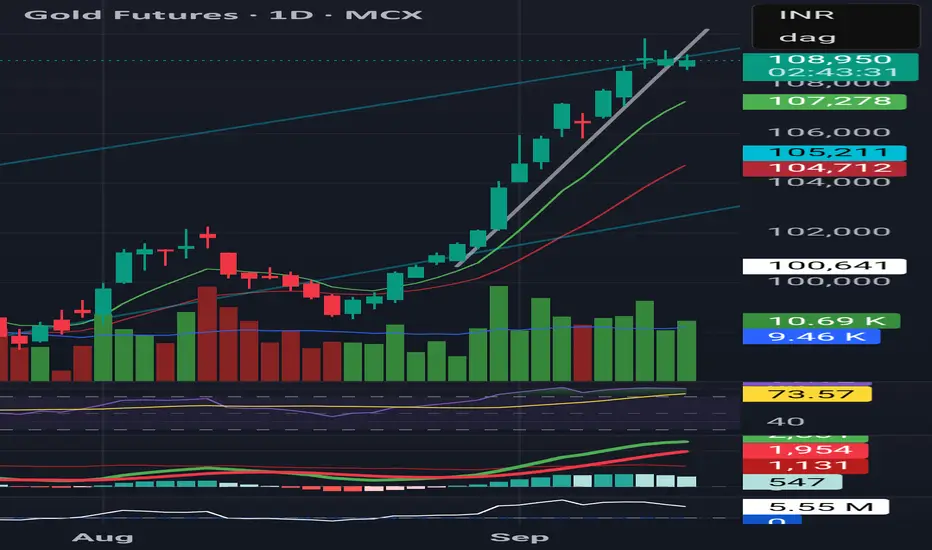
Gold – Reversals to TrendsOur system thrives on dual strength — catching reversals at the turn and riding the trend that follows.
MCX:GOLDM1! has been the perfect example.
Precision entries on reversals, disciplined trailing on momentum.
This edge has delivered multiple double-digit “R” trades.
Risk stays small, reward compounds big.
That’s the power of rules executed with patience.

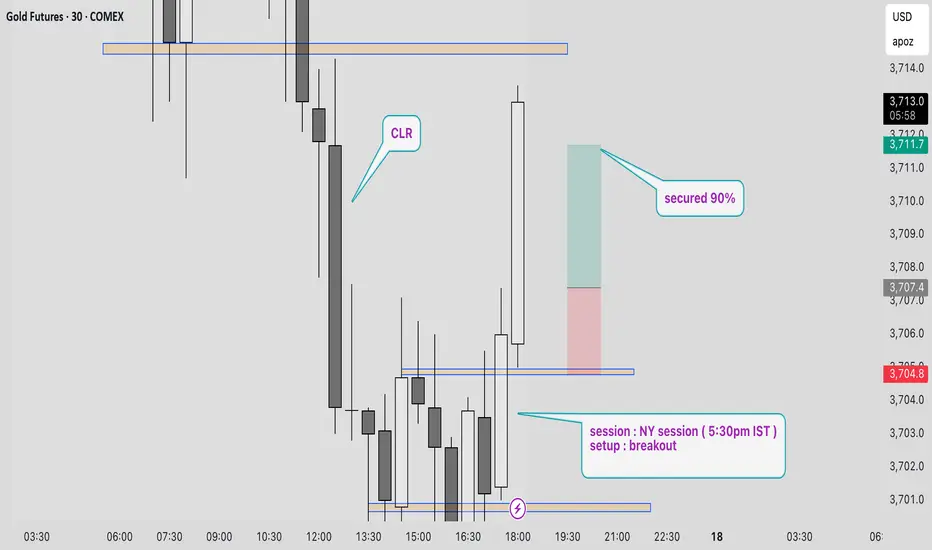
XAUUSD : 16th Sept 25 - TP HIT1. Fakeout formed during Pre NY session
2. Price broke support and price retraced back to support during NYSE open session
3. Once resistance confirmed , entered sell side on BPCL
4.Fake out , Breakdown ( Pre NY ) + Retrace ( NYSE open )
5. Secured 90% partials @ 1:1

XAUUSD : Sept 17th - TP HIT1. Planned a reversal trade
2. Clean range is present to the left side
3. Breakout happened at NY session above resistance
4. Anticapated volume push during NY session
5.Secured 90% partials at 1:1.5
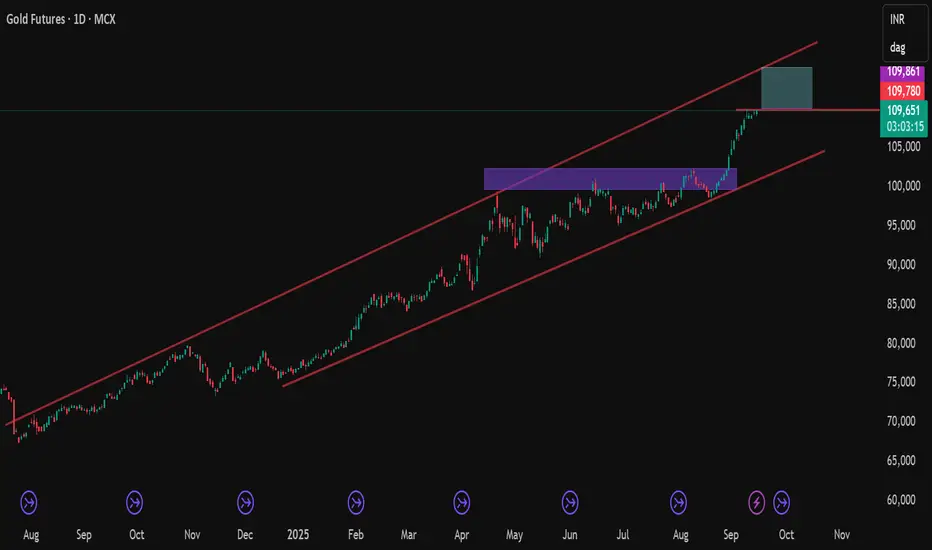
Gold Futures (MCX) – Breakout Towards Upper ChannelDescription:
Gold Futures (MCX) has broken out of the 100–102k consolidation zone and is trending inside a strong ascending channel. Price is approaching the upper channel resistance near 110–112k, while supports lie at 108.6k and 107.4k.
Liquidity in MCX gold contracts remains healthy, supported by strong ETF inflows, central bank buying, and expectations of Fed rate cuts. While the broader structure stays bullish, short-term consolidation or pullbacks may occur near the channel top.
Key Levels:
Resistance: 110k–112k (upper channel)
Support: 108.6k / 107.4k, major zone 100–102k
Bias: Bullish above 100k
[MCX] Gold Short IdeaNote -
One of the best forms of Price Action is to not try to predict at all. Instead of that, ACT on the price. So, this chart tells at "where" to act in "what direction. Unless it triggers, like, let's say the candle doesn't break the level which says "Buy if it breaks", You should not buy at all.
=======
I use shorthands for my trades.
"Positional" - means You can carry these positions and I do not see sharp volatility ahead. (I tally upcoming events and many small kinds of stuff to my own tiny capacity.)
"Intraday" -means You must close this position at any cost by the end of the day.
"Theta" , "Bounce" , "3BB" or "Entropy" - My own systems.
=======
I won't personally follow any rules. If I "think" (It is never gut feel. It is always some reason.) the trade is wrong, I may take reverse trade. I may carry forward an intraday position. What is meant here - You shouldn't follow me because I may miss updating. You should follow the system I share.
=======
Like -
Always follow a stop loss.
In the case of Intraday trades, it is mostly the "Day's High".
In the case of Positional trades, it is mostly the previous swings.
I do not use Stop Loss most of the time. But I manage my risk with options as I do most of the trades using derivatives
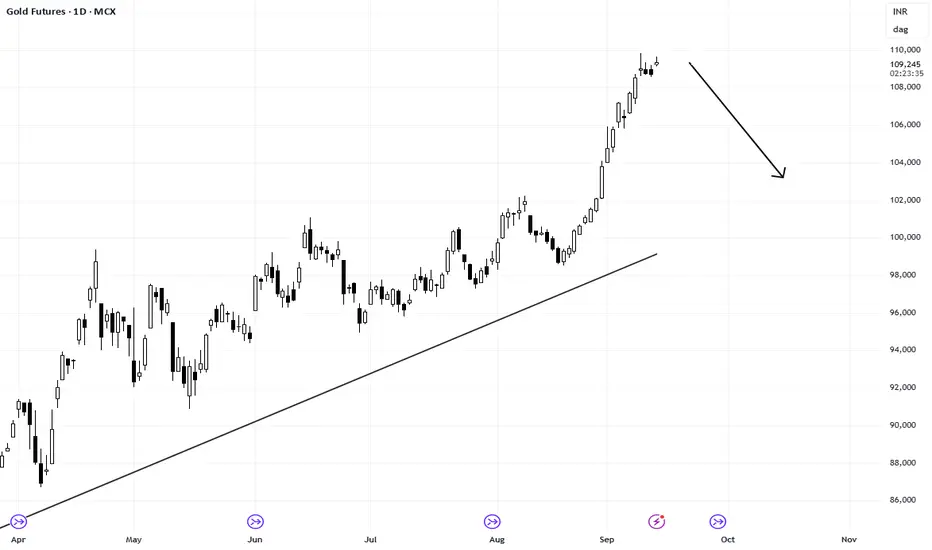
Technical View – Gold Futures (MCX)Trend: Sharp rally extended, but now showing pause with doji candles at the top.
Volume: Trendline breakout earlier came with strong participation; latest candles show reduced conviction.
Momentum: RSI near 74 → overbought, but stabilizing. MACD still positive, histogram flattening → signs of momentum cooling.
Support Levels: ₹107,250 (short-term EMA), ₹105,200 (swing support).
Bias: Rally intact, but risk of sideways/consolidation phase unless fresh volume confirms continuation.
Opportunities in PSU Stocks1. Historical Context of PSU Stocks in India
PSUs were originally created with the objective of building India’s industrial and economic base after independence. Since the private sector lacked resources and experience in heavy industries, the government stepped in to build enterprises in key sectors:
Oil & Gas: ONGC, IOC, HPCL, BPCL
Banking & Finance: SBI, PNB, BoB, LIC
Power & Energy: NTPC, NHPC, Power Grid, SJVN
Metals & Mining: Coal India, NMDC, Hindustan Copper
Engineering & Infrastructure: BHEL, NBCC, IRCON, RITES
Defense: HAL, BEL, BDL, Mazagon Dock
Initially, PSUs were seen as the backbone of the economy. Over time, inefficiencies, overstaffing, and political interference reduced their competitive edge. Private sector companies began to outperform them. This led to a long period where PSU stocks underperformed compared to private companies.
However, recent changes in government strategy, digital reforms, capital market participation, and global commodity cycles have shifted the outlook.
2. Why PSU Stocks are Back in Focus
Several factors have brought PSU stocks back into investor interest:
(a) Attractive Valuations
For many years, PSU stocks traded at low price-to-earnings (P/E) multiples compared to private peers. This made them undervalued despite strong fundamentals. Recent re-rating has unlocked opportunities.
(b) High Dividend Yields
PSUs are known for distributing high dividends, as the government is the largest shareholder and depends on dividend income. Some PSU stocks give 4%–10% annual dividend yield, making them attractive for long-term investors.
(c) Government Reforms & Disinvestment
The government has actively promoted disinvestment and privatization (e.g., Air India’s sale, BPCL privatization plans). This increases efficiency, improves market perception, and boosts stock prices.
(d) Revival in Core Sectors
Energy demand, infrastructure growth, and defense modernization are boosting PSU earnings. For example, Power Grid benefits from rising electricity demand, while HAL and BEL gain from India’s defense indigenization push.
(e) Improved Corporate Governance
Many PSUs have adopted better transparency, digital systems, and profit-focused strategies, reducing inefficiency and improving investor confidence.
3. Opportunities Across Different PSU Sectors
3.1. Banking & Financial PSUs
Key Players: SBI, PNB, BoB, Canara Bank, LIC, GIC, REC, PFC
Opportunity:
Public sector banks have cleaned up their balance sheets after years of bad loans (NPAs).
Credit growth is rising as the Indian economy expands.
SBI, the country’s largest bank, has become a strong wealth creator.
LIC, the insurance giant, is expanding beyond traditional markets and can benefit from India’s growing insurance penetration.
NBFCs like REC and PFC benefit from power sector financing demand.
Why Attractive: PSU banks trade at lower valuations than private banks but are witnessing strong earnings growth.
3.2. Oil & Gas PSUs
Key Players: ONGC, IOC, BPCL, HPCL, GAIL, Oil India
Opportunity:
India is heavily dependent on oil & gas imports, making PSUs critical players.
Rising energy demand ensures long-term growth.
GAIL’s gas distribution and pipeline network is expanding with the government’s push for a gas-based economy.
Strategic privatization of BPCL can unlock massive value.
Why Attractive: High dividend yields, global energy price cycles, and government support.
3.3. Power & Energy PSUs
Key Players: NTPC, NHPC, Power Grid, SJVN, Coal India
Opportunity:
India’s power demand is growing rapidly due to urbanization and industrialization.
NTPC is expanding into renewable energy.
Power Grid is a monopoly in transmission with stable cash flows.
Coal India benefits from being the largest coal producer in the world.
Why Attractive: Stable earnings, strong dividend payouts, and long-term demand visibility.
3.4. Defense PSUs
Key Players: HAL, BEL, BDL, Mazagon Dock, GRSE, Cochin Shipyard
Opportunity:
India is pushing for defense indigenization under the Atmanirbhar Bharat initiative.
Defense budget allocation is rising each year.
Export opportunities for Indian defense equipment are growing.
HAL and BEL are showing strong order books with multi-year growth visibility.
Why Attractive: Strategic importance, government support, and long-term contracts.
3.5. Infrastructure & Engineering PSUs
Key Players: BHEL, NBCC, IRCON, RITES, Engineers India
Opportunity:
India’s infrastructure push (roads, railways, housing, smart cities) benefits these companies.
IRCON and RITES are beneficiaries of railway modernization and export of rail technology.
NBCC plays a crucial role in government construction projects.
Why Attractive: Government-backed contracts, order book strength, and growth in infrastructure spending.
3.6. Metals & Mining PSUs
Key Players: NMDC, Hindustan Copper, MOIL, NALCO
Opportunity:
Commodity supercycles and rising demand for minerals (iron ore, copper, manganese, aluminum) benefit these PSUs.
NMDC is a low-cost iron ore producer, while NALCO is expanding aluminum production.
Electric vehicle (EV) growth increases demand for copper and aluminum.
Why Attractive: Global commodity upcycle, cost advantage, and strong government backing.
4. Key Strengths of PSU Stocks
Stable Business Models – Many PSUs enjoy monopolies or dominant positions in their industries.
Dividend Income – Attractive for long-term investors seeking passive income.
Government Support – Financial backing, bailout potential, and favorable policies.
Strategic Importance – PSUs play critical roles in defense, energy, and infrastructure.
Value Unlocking via Privatization – Upcoming privatizations can lead to stock re-rating.
5. Risks in PSU Stocks
While opportunities are strong, investors must be aware of risks:
Government Intervention – Policy decisions can affect profitability (e.g., fuel price controls for OMCs).
Competition from Private Sector – Private banks, energy companies, and defense startups pose challenges.
Global Commodity Price Volatility – Affects PSU metal, mining, and oil companies.
Disinvestment Delays – Political opposition or market conditions can slow privatization.
Efficiency Concerns – Despite improvements, some PSUs still face bureaucratic inefficiencies.
6. Investment Strategies in PSU Stocks
Dividend Investing – Focus on high-yield PSU stocks like Coal India, NTPC, Power Grid.
Value Investing – Buy undervalued PSUs trading at low P/E or P/B ratios.
Thematic Investing – Play sectors like defense indigenization (HAL, BEL) or renewable energy (NTPC, SJVN).
Disinvestment Opportunities – Monitor privatization candidates for potential re-rating.
Balanced Portfolio – Mix of stable dividend PSUs and growth-oriented defense/infra PSUs.
7. Outlook for PSU Stocks in India
The next decade could be transformational for PSU companies. Key trends driving growth:
India’s $5 trillion economy target will need massive energy, infrastructure, and defense spending.
Privatization push will unlock value and reduce inefficiencies.
Renewable energy expansion will benefit NTPC, NHPC, and SJVN.
Defense exports will grow as India becomes a global supplier.
Digitalization in PSU banks will improve competitiveness.
Foreign institutional investors (FIIs) and domestic investors are increasingly allocating capital to PSU stocks, indicating confidence in their long-term prospects.
Conclusion
PSU stocks in India are no longer “sleeping giants.” They have evolved into strong wealth-creating opportunities, backed by government reforms, improved efficiency, sectoral growth, and undervaluation compared to private peers.
Opportunities exist across multiple sectors: banking, energy, defense, infrastructure, and commodities. While risks remain in terms of government interference and competition, the overall outlook is positive.
For long-term investors, PSU stocks offer a unique combination of dividend income, stability, and growth potential. With India’s economic rise, PSU stocks can play a central role in wealth creation for investors who are willing to stay patient and selective.

Breakouts & Fakeouts in Trading🔹 Introduction
Financial markets are like living organisms – constantly moving, adjusting, and reacting to news, emotions, and liquidity. For traders, one of the most exciting moments is when a stock, currency pair, commodity, or cryptocurrency seems to break out of its range. Breakouts often lead to big, sharp moves, offering opportunities for quick profits.
But here’s the catch: not every breakout is real. Many are fakeouts (false breakouts) designed by market dynamics, liquidity hunters, or big players to trap traders. The difference between making money and losing money often lies in identifying whether a breakout is genuine or false.
This article dives into:
What breakouts are
Why fakeouts happen
Chart examples (conceptually explained)
Tools to confirm breakouts
Trading strategies to avoid traps
Risk management for breakout traders
🔹 Part 1: What is a Breakout?
A breakout occurs when the price of an asset moves outside a defined support or resistance level with increased momentum.
✅ Common Types of Breakouts
Resistance Breakout – Price moves above a previously strong ceiling.
Support Breakout – Price falls below a previously strong floor.
Trendline Breakout – Price breaks out of a rising or falling trendline.
Chart Pattern Breakout – Price escapes from patterns like triangles, flags, rectangles, or head & shoulders.
Volatility Breakout – When price explodes after a period of consolidation (Bollinger Band squeeze).
Why traders love breakouts?
They indicate a new trend may begin.
They provide clear entry and exit levels.
They often come with higher volume, confirming market interest.
Example: If Nifty is stuck between 19,500–20,000 for weeks and suddenly crosses 20,000 with heavy volume, that’s a bullish breakout.
🔹 Part 2: What is a Fakeout?
A fakeout (false breakout) happens when price temporarily breaks a level, lures traders into positions, but then reverses back into the range.
Fakeouts are dangerous because:
Traders enter aggressively expecting a trend, but get stopped out.
Big players use fakeouts to hunt stop-losses of retail traders.
They often happen during low liquidity or news events.
Example: Price breaks above 20,000, attracts buyers, but quickly reverses to 19,800. That’s a bull trap fakeout.
🔹 Part 3: Why Do Fakeouts Happen?
Fakeouts are not random; they are part of market psychology and structure.
Liquidity Hunting (Stop Loss Hunting)
Smart money knows retail traders place stop-losses above resistance or below support.
They push prices just beyond those levels, trigger stop-losses, then reverse.
Low Volume Breakouts
If breakout happens without strong participation, it’s usually unsustainable.
News & Events
A sudden announcement can cause sharp moves, but once news fades, price falls back.
Algorithmic Manipulation
High-frequency traders may push price beyond levels to create artificial breakouts.
Market Sentiment & Greed
Traders chase breakouts blindly, creating temporary momentum before exhaustion.
🔹 Part 4: Spotting Genuine Breakouts vs Fakeouts
✅ Clues for Real Breakouts
High Volume: Breakouts with above-average volume are stronger.
Retest of Levels: After breakout, price pulls back to test old support/resistance, then resumes trend.
Strong Candle Closes: Large body candles closing beyond the level.
Market Context: Aligns with larger trend or macroeconomic strength.
❌ Signs of Fakeouts
Breakout with low or declining volume.
Long wicks (shadows) beyond resistance/support but weak closes.
Breakouts during off-market hours or thin liquidity.
Price immediately snaps back into range after breakout.
🔹 Part 5: Chart Patterns & Fakeouts
Range Breakouts
Markets consolidate between two levels.
Breakouts beyond range are powerful but also prone to fakeouts.
Triangle Breakouts
Symmetrical/ascending/descending triangles show compression.
Fakeouts are common before the “real” breakout.
Head & Shoulders Pattern
A breakdown below the neckline should confirm trend reversal.
Many times, price breaks below neckline but quickly recovers.
Flag & Pennant Patterns
Strong continuation patterns, but fake breakouts happen if volume is missing.
🔹 Part 6: Strategies to Trade Breakouts & Avoid Fakeouts
1. Wait for Candle Close Confirmation
Don’t jump in immediately; wait for the candle to close above/below the level.
2. Use Volume as Filter
Only trade breakouts with above-average volume.
3. Retest Strategy
Enter on pullback to old support/resistance (safer entry).
4. Multi-Timeframe Confirmation
If breakout is visible on both 1-hour and daily charts, it’s stronger.
5. Combine with Indicators
RSI divergence can warn of false breakout.
Moving averages can confirm trend direction.
6. Avoid News-Driven Breakouts
Trade technical breakouts, not temporary news spikes.
🔹 Part 7: Risk Management in Breakout Trading
Even the best trader cannot avoid fakeouts completely. That’s why risk management is key.
Position Sizing: Risk only 1–2% of account per trade.
Stop Loss Placement:
For upside breakout: place SL below breakout level.
For downside breakout: place SL above breakdown level.
Use Partial Profits: Book some profit early, trail the rest.
Don’t Chase Breakouts: If you miss the first entry, don’t enter late.
🔹 Part 8: Real-Life Examples
Example 1: Stock Breakout
Stock consolidates between ₹500–₹520 for 2 weeks.
Breaks ₹520 with high volume, rallies to ₹550. (Real breakout)
Example 2: Crypto Fakeout
Bitcoin breaks $30,000 resistance but fails to sustain.
Falls back to $29,000 within hours. (Bull trap fakeout)
Example 3: Forex False Breakdown
EUR/USD breaks below 1.1000, triggering short trades.
Reverses sharply to 1.1050. (Bear trap fakeout)
🔹 Part 9: Psychology Behind Breakouts & Fakeouts
Retail Traders: Chase price blindly.
Institutions: Create liquidity zones by triggering retail stop-losses.
Fear & Greed: Traders either fear missing out (FOMO) or panic at reversals.
Patience vs Impulsiveness: Successful traders wait for confirmation, while impulsive ones fall for fakeouts.
🔹 Part 10: Advanced Tips for Professionals
Volume Profile Analysis
See if breakout aligns with high-volume nodes (strong support/resistance).
Order Flow Tools (Level II Data, Footprint Charts)
Helps spot whether breakout is supported by real buying/selling.
Breakout with Trend Alignment
Always trade in direction of higher-timeframe trend.
Market Timing
Breakouts during main sessions (like US market open) are more reliable.
🔹 Conclusion
Breakouts & fakeouts are two sides of the same coin. While real breakouts can deliver powerful moves, fakeouts are equally common and dangerous. The key lies in:
Confirming with volume, retests, and candle closes.
Avoiding emotional FOMO trades.
Protecting capital with risk management.
If you understand the psychology behind breakouts and fakeouts, use confirmation tools, and trade with patience, you can avoid traps and capture the big trend moves that follow genuine breakouts.
GOLDTENU2025 Trend Reversal CapturedRiding strength in MCX:GOLDTENU2025 since 20th August.
Entry clear, risk minimal.
Trend unfolding, stops trailing.
Discipline over impulse.
Protecting downside, letting upside breathe.
This is how winners compound.
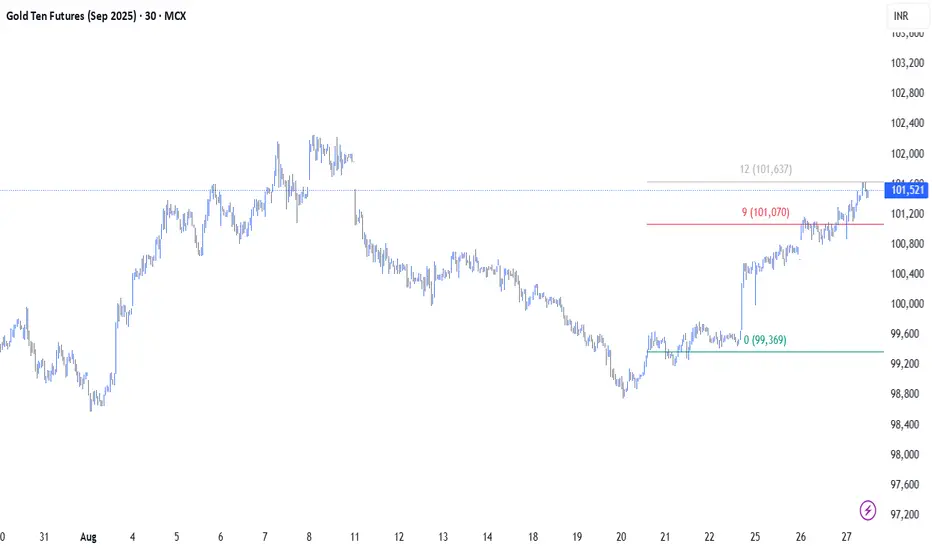
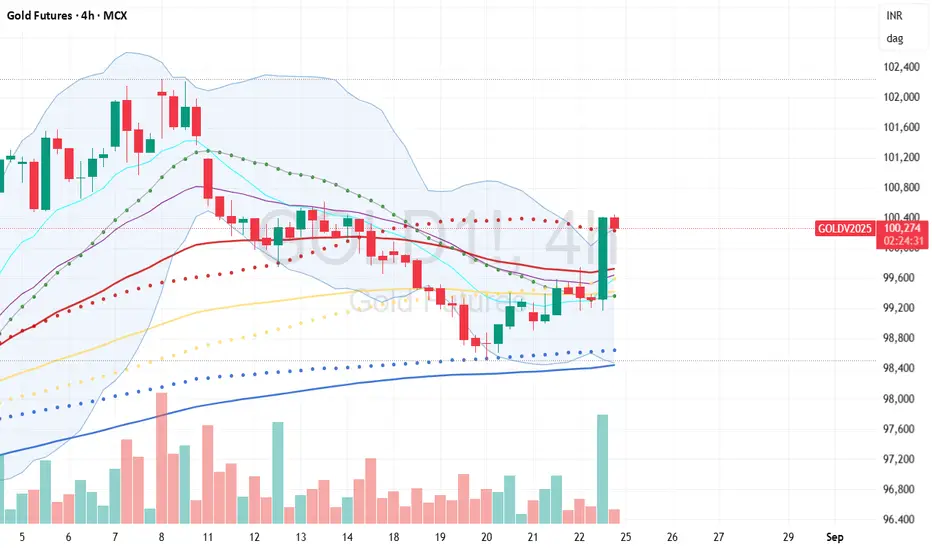
Sell Gold with SL 100800📌 MCX Gold Technical Outlook (₹/10g)
Context: Despite Jackson Hole and fresh rate-cut chatter, gold hasn’t managed a decisive breakout. The USD resistance near $3,390 is capping price; on MCX that maps to ₹100,800.
View
Bias tilts neutral-to-bearish unless price closes above ₹100,800. Failure to clear that cap keeps the door open for a pullback.
Key Levels (mapped with USD/INR = 87.20)
Resistance / Bull trigger: ₹100,800 (≈ $3,390)
Support 1 / First target on weakness: ₹99,100 (≈ $3,330)
Support 2 / Deeper target: ₹97,300 (≈ $3,270, approx)
Scenarios
Base case (bearish drift): Rejections below ₹100,800 → slip toward ₹99,100. If that breaks on a closing basis, extension toward ₹97,300 is likely.
Invalidation: A strong close above ₹100,800 flips momentum back up; then reassess for higher targets.
Tactics (example):
Look for retest + rejection near ₹100,800 for risk-defined shorts.
Stops just above the rejection high; targets ₹99,100 → ₹97,300 in steps.
If price bases at ₹99,100 and reclaims higher lows, consider trimming shorts or tightening risk.
Note: Levels are directly mapped from USD spot/futures anchors using your FX assumption (USD/INR 87.20):
$3,390 → ₹100,800 · $3,330 → ₹99,100 · $3,270 → ₹97,300 (approx).
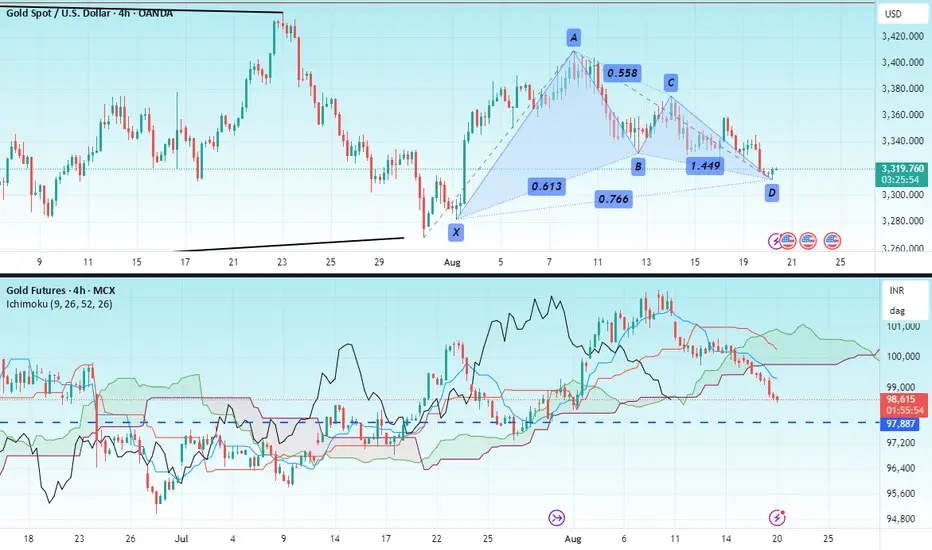
GOLDHello & welcome to this analysis
Gold at COMEX has formed a bullish Harmonic Gartley pattern in 4hr time frame suggesting a reversal in trend.
As long as it sustains above $3295 it could give a bounce/rally till $ 3345 - 3370 - 3400 - 3450.
Gold at MCX appears to be ending its pullback but due to INR $ fluctuations a bullish Harmonic pattern has not formed. One could look for bullish trades as long as its above 97900 for upside levels of 99400 - 100000 - 101000 - 102500. Keep in mind levels could alter due to forex changes
Overall GOLD is strong and has an upside triangle breakout target of $3700 open as long as it is above $3250 (refer to my earlier view published on Gold in the link)
All the best
Trading Master Class With ExpertsReal-Life Applications of Options
Options are not just trading tools; they have practical uses:
Insurance companies use options to hedge portfolios.
Exporters/Importers hedge currency risks using options.
Banks use interest rate options to manage risk.
Investors use protective puts to safeguard their stock portfolios.
Psychology of Options Trading
Trading options requires discipline. Many beginners blow up accounts because:
They buy cheap OTM options hoping for jackpots.
They ignore time decay.
They overtrade due to low cost of entry.
A successful option trader thinks like a risk manager first, profit seeker second.

GOLD trade ideaGOLD 100391 is in bullish trend and heading to 101738 with support Support 98898.. It expected to find resistance there and reverse to 96490.

Gold Futures hits monthly VWAP Gold futures (Dec) hits monthly VWAP and 3 standard deviations from weekly VWAP. Possible double top in play on daily. Confirmation for lower prices 3405.
Previous swing high 3423.8
Current High 3423.4
Note : 1.625 (5/8 level) =3309 Where we have old bottom of 3307.4
