BTC/USD analysis - 04 Nov 2024BTC has grabbed the liquidity at around 67,500 level.
Our recommendation;
Buy BTC @ 68,700
Stop loss at 67,400
Take Profit @ 75,000
BITCOIN trade ideas

Monday, November 4 , 2024, here is a Bitcoin trading setupAs of November 4, 2024, Bitcoin is trading around $69,530. For intraday trading, consider the following strategy:
Buy Position:
Entry Point: If Bitcoin rises above $70,000, indicating bullish momentum.
Target: $71,000, aligning with recent resistance levels.
Stop-Loss: $69,000, to limit potential losses if the price reverses.
Sell Position:
Entry Point: If Bitcoin falls below $69,000, suggesting bearish momentum.
Target: $68,000, near recent support levels.
Stop-Loss: $70,000, to protect against unexpected upward movements.
These levels are based on recent price data and technical analysis. Always use appropriate risk management strategies and stay updated with market news, as cryptocurrency markets are highly volatile.

BTC getting ready for big fallWhile doing my btc live trading analysis I've found that in big picture time frame there is a superb inverted cup and handle. Also making a consolidation on daily time frame trendline marked green.
So if it works like as planned then there is a high probability with a big risk reward.
Lets discuss about your views too.
Its just my personal view no buy sell recommendations.
You can like it, comment it, share it and follow me for btc live marketet updates.

BTC more fall down possibilityAs we've seen big fall and now btc trading in back in daily time frame channel.
This shows that more fall may be coming soon. This is good possibility with high probablity of trade.
Its a really good trade if hits gives good risk to reward.
This is my personal view no buy sell advice.

BTC RETEST OR FAKE BREAKDOWNAs we've seen long consolidation into BTC now any where it is going to shoot either breakout above green or breakdown below red.
Lets give your views into comment section.
Here only money management snd high risk reward can keep you in profitable for long run.
Its not a buy or sell recommendations just my view to discuss with you all.

BUY AND SELL LEVEL FOR 11/2/2024As of November 2, 2024, Bitcoin (BTC/USD) is trading at approximately $69,487. For intraday trading, consider the following levels
Support and Resistance Levels:
Support Levels:
First Support (S1): $68,000
Second Support (S2): $66,500
Resistance Levels:
First Resistance (R1): $70,000
Second Resistance (R2): $71,500
Trading Recommendations:
Buy Entry:
Entry Point: Near $68,000 (S1)
Target: $70,000 (R1)
Stop-Loss: Below $66,500 (S2)
Sell Entry:
Entry Point: Near $70,000 (R1)
Target: $68,000 (S1)
Stop-Loss: Above $71,500 (R2)

Bitcoin bought - 1 hour Bearish Butterfly will complete @ 73500-Bitcoin bought - 1 hour Bearish Butterfly will complete @ 73500-73800 $ range
CMP 69679
Targets looking for 71472- 72645- 73700-74500+
SL below 68400 (Candle closing basis 1 hour)
Holding period - 1-2 week
Only for Education Purpose

BTC sideways two possibilitiesHere a good consolidation since many hours. This will make sideways market.
So this will always gives good returns when we have a breakdown or breakout.
1) we've cup and handle pattern if breakout green line.
2) we've M pattern breakdown if red line breaks.
Lets see this is my personal view no buy sell recommendations.

Bitcoin's outlook depends heavily on maintaining above $69KBitcoin’s price has pulled back as it tests a significant supply zone, creating strong pressure on the short-term trend. Volatility remains high, with Bitcoin recently attempting to surpass its yearly high. In order to reach beyond $74,000 to set a new all-time high. However, this push met resistance, indicating possible exhaustion in the rally.
Currently, Bitcoin's outlook depends heavily on maintaining support above $69,000. A breakdown below this level could worsen the market outlook. Yet, online discussions reveal optimism, as analysts present various theories suggesting Bitcoin might still reach new highs.
At this point, with the price in uncertain territory, investors should avoid FOMO and focus on thorough research.
BTC seems like a breakdown furtherAs per my favorite pattern it is forming head and shoulder pattern.
But not yet confirmed the neckline breakdown.
So lets see do we get more correction in BTC or buyers can combat once again.
Lets comment down your views.
This is just my personal view no buy sell recommendations.

Bitcoin may Breakout!!!Looks like there was a shakeout in Bitcoin chart and it may give a nice breakout now. One can enter by keeping the low of breakout candle as stop loss.

BTC moving as plannedAfter retest of daily flag breakout trendline.
Btc consolidated and as we can see here w pattern works very fine.
As I've already discussed next move BTC hits out targetand with big bull candle.

BTC trend reversal possibilities in 30minsHello, I've just seen the probability of trend reversal in btc usd trade.
But it will be only valid if it gives good breakout.
Here after taking support from daily trendline. Price tries to consolidate and making higher lows. Will wait for breakout then it can be good opportunity with good risk reward.
Money management is key in trading.
Its not advice to buy or sell. Its my personal view. For btc movement.

Bitcoin Bybit chart analysis October 31
Hello
It's a Bitcoinguide.
If you have a "follower"
You can receive comment notifications on real-time travel routes and major sections.
If my analysis is helpful,
Please would like one booster button at the bottom.
Here is the Bitcoin 30-minute chart.
The Nasdaq index will be announced at 9:30 shortly.
On the upper left,
Yesterday's short position entry point of 72,746 dollars
I connected it to today's strategy.
*Red finger
One-way long position strategy.
1. 71,493.5 dollars long position entry point / stop loss price when the sky blue support line breaks
(The sky blue support line is the green support line in the analysis article on the 30th yesterday.)
2. 73,169.5 dollars long position 1st target -> Top 2nd target
If the strategy is successful,
Look for an additional long position entry point in the daily closing section as you have been practicing.
If the purple support line is maintained,
If it reaches the Whipsaw (73.2K) section indicated at the top right from the current position,
it may plummet sharply because it is the previous high.
Today's long position entry section 71.4K was as tight as possible for fear of missing the entry point.
Please check the central line of the 4-hour candle of the Bollinger Band after 9 o'clock, which is generated shortly.
The maximum long position entry section today is number 2.
Since the bottom section is the 6-hour central line,
a slight rebound may occur,
but if the 1+4 section is deviated, the mid-term pattern will be broken,
and the bullish train may be delayed.
If possible, it would be good to maintain the sky blue support line today.
Up to this point, please use my analysis article only for reference and use,
and I hope you operate safely with principle trading and stop loss prices.
Thank you.

Bitcoin Bybit chart analysis October 30Hello
It's a Bitcoinguide.
If you have a "follower"
You can receive comment notifications on real-time travel routes and major sections.
If my analysis is helpful,
Please would like one booster button at the bottom.
This is the Bitcoin 30-minute chart.
There will be a NASDAQ indicator announcement at 9:30 in a little while.
As the short-term pattern has been broken so far,
I think the bullish train today will stay for a while.
Overall, the strategy was carried out as a downward sideways movement,
and if you look closely, there is a bullish train that will depart after tomorrow hidden in the strategy.
*When the blue finger moves,
It is a short position strategy.
To be exact, it is a short->long switching strategy.
1. 71563.5 dollars long position entry section / stop loss price when purple support line is broken
(Since the rebound has already touched the 2-hour chart center line while writing the analysis,
there is a possibility that the rebound will not occur,
so do not aim for a long position, and check whether it reaches the current position of the pink resistance line or section 1 until 10:30 when the market opens,
and you can operate it focusing on short positions.)
2. 72073.5 dollars short position switching / stop loss price when orange resistance line is broken
(After chasing the current position, check whether the pink resistance line is broken,
and operate it as stop loss price when the final orange resistance line is broken)
3. 70283.5 dollars long position switching / stop loss price when green support line is broken
2, 3-hour chart MACD dead cross in progress
Because it touched the 2-hour chart center line of Bollinger Band
Today It is judged that a strong rise or surge is difficult.
In the current position,
In case of breaking through the pink resistance line, please take a short position at 1.
Please note that it may touch 71.5K at the bottom and continue to be pushed.
The movement within the orange resistance line / purple support line is a sideways movement.
In any case, if the green support line is not broken today,
There is a possibility that it will continue to rise.
Those who have been with us for a long time
Can you roughly see where the bullish train is?
Depending on today's movement, the final entry point tomorrow may change,
Please note and I hope you operate well in real time.
Up to this point, please use my analysis articles only for reference and use,
I hope you operate safely with principle trading and stop loss prices.
Thank you.

Bitcoin Bybit chart analysis October 29Hello
It's a Bitcoinguide.
If you have a "follower"
You can receive comment notifications on real-time travel routes and major sections.
If my analysis is helpful,
Please would like one booster button at the bottom.
Here is the Bitcoin 30-minute chart.
Nasdaq indicators will be announced at 11 o'clock shortly.
Since the price of Gimp has risen a lot, the goal of breaking through 100 million has already been achieved,
but isn't the margin exchange important?
If Bitcoin goes up a little more, it will skyrocket,
but I had a lot of trouble today because of the entry point.
Well, if Nasdaq doesn't crash today,
Bit has slightly surpassed its all-time high,
so it's a double top, right? (Bearing condition)
First of all, today is not a sweeping condition, and the possibility of a crash is not high,
so we operated very aggressively.
If perfect doesn't come out today,
I will take a day off tomorrow to reflect.
*When the red finger moves,
it is a one-way long position strategy.
1. 70990.5 dollars long position entry section / cut-off price when purple support line breaks
2. Top section 1st target -> Good 2nd target -> Great 3rd target
If you just touch the 1st section at the top, 71694 dollars,
it is an overshooting position, a position where an upward trend is connected,
and if it reaches the Top section, it can be connected to Good right away,
but I tried to be perfect.
If the strategy succeeds and the Top or Good section target price is reached,
it would be good to use the last red finger 1st section as an additional long position entry section.
It is a strong upward condition until the purple parallel line support line is maintained.
Then, the long position entry point is section 2,
and the range is around 700 dollars, so I set the cut-off price short. If the rebound doesn't come out strongly in the 2nd section today,
Since the 3rd section below is roughly the 1+4 section,
I think it would be good to remember this place.
Today, I will leave it short and thick like a man and go in.
Up to this point,
Please use my analysis as a reference and only to the extent of use,
I hope you operate safely with the principle trading + stop loss price.
Thank you.

Btc pumping target break soon!?On the daily chart, BTC is expected to break its high soon, targeting the 89,000 to 90,000 range, but target (major appromately 120k).
Next target 4h chart analysis approximately 76500-79800
Gooluck holders.

Bitcoin Bybit chart analysis October 25Hello
It's a Bitcoinguide.
If you have a "follower"
You can receive comment notifications on real-time travel routes and major sections.
If my analysis is helpful,
Please would like one booster button at the bottom.
This is a Bitcoin 30-minute chart.
There is no Nasdaq indicator announcement
If you look at the captured image at the top,
The trend is coming out while I am writing the analysis.
In the upper left corner, the purple finger is 68,498 dollars
I proceeded with today's strategy from the final short of the top section yesterday.
*When the blue finger moves,
It is a short position
Long->short switching strategy.
1. 67,963.5 dollars, chase purchase entry section / cut-off price when the purple support line is broken
2. 69,069 dollars, short position switching / cut-off price when the red resistance line is broken
The reason for the chase purchase at 67.9K is that the entry point can be missed
The resistance line is open
On the other hand, I bet on the vertical decline of Tether dominance.
As a trading tip, a rebound from the 1-hour chart support line touch
Can be a condition that can shake things up big. (6-hour, 12-hour chart center line retouch)
Orange resistance line 1 section at the top / Green support line 3
Movement within the convergence section is sideways.
69069 dollars is the Bollinger Band 12-hour chart resistance line.
If the mid-term pattern is broken and the 12-hour chart support line -> resistance line is touched,
I judged that it can be restored to a normal pattern again.
If the strategy is successful,
Try to match the rebound section at the bottom during the weekend.
If you look at the chart carefully,
I left a hidden picture game with technical analysis. Haha
Please use my analysis up to this point as a reference only
I hope you operate safely with principle trading and stop loss prices.
You worked hard this week too.
Thank you.

BITCOIN SHOWING A GOOD UP MOVE WITH 1:8 RISK REWARDBTCUSD SHOWING A GOOD UP MOVE WITH 1:8 RISK REWARD
DUE TO THESE REASON
A. its following a rectangle pattern that stocked the market
which preventing the market to move any one direction now it trying to break the strong resistant lable
B. after the break of this rectangle it will boost the market potential for break
C. also its resisting from a strong neckline the neckline also got weeker ald the price is ready to break in the outer region
all of these reason are indicating the same thing its ready for breakout BREAKOUT trading are follws good risk reward
please dont use more than one percentage of your capitalfollow risk reward and tradeing rules
that will help you to to become a bettertrader
thank you

The Symmetrical Triangle: Real Success Rates + Breakout.The Symmetrical Triangle: Real Success Rates + Breakout.
The symmetrical triangle is an important chart pattern in technical analysis, deserving special attention from professional traders.
This formation is characterized by a convergence of prices between two trendlines, one descending and the other ascending, creating a consolidation zone where indecision between buyers and sellers is palpable.
Statistical Analysis
Empirical data reveals that the success rate of the symmetrical triangle for a trend continuation is approximately 54%. This percentage, although higher than 50%, underlines the importance of a cautious approach and rigorous risk management in using this pattern.
Breakout Point
The breakout of the symmetrical triangle usually occurs when the price has traveled approximately 75% of the distance to the apex. This point is crucial for traders, as it often represents the moment when volatility increases and a new trend can be established.
Risks and False Exits
It is essential to note that the symmetrical triangle has a relatively high rate of false exits. Statistics indicate that approximately 13% of cases in a bear market can result in a false exit to the bottom. This phenomenon underlines the need for additional confirmation before entering a position.
Strategy of use
To effectively exploit the symmetrical triangle, professional traders must:
-Identify the formation accurately.
-Wait for the breakout near the point of convergence of the trendlines.
-Confirm the breakout with other technical indicators or an increase in volume.
-Put in place strict risk management to protect against false exits.
In conclusion, the symmetrical triangle, although being a valuable tool in the trader's arsenal, requires a methodical approach and a thorough understanding of its characteristics to be used effectively in a trading strategy.

Btc bitcoin all time high new target long term horizonHi traders as you can see we've flag pattern in weekly time frame in btc usd
Bitcoin seems to be more and more in news nowadays as it is almost all time high level. And consolidation in this area is very good for fruitful breakout.
As new buyers won't got their desired profit and sellers are afraid of thier big loss so when they squareoff their positions there is good breakout always.
Lets see this view is my personal and educational purpose only.

"BTCUSD Sell Setup: Precise Entry with Multiple Target Levels"This is a selling trade with the entry at 67,597.76, marked in white on the chart. The yellow levels below represent your target points:
First Target: 67,261.29
Second Target: 66,972.07
Final Target: 66,653.81

Bitcoin: BTCUSD bulls eye $68,700 resistance as key week beginsBitcoin's (BTCUSD) recent gains are under pressure as traders await important data this week, including the US Q3 GDP, Fed Inflation, and Nonfarm Payrolls (NFP). However, optimism about post-US election industry regulations and strong ETF inflows continue to support buyers.
BTCUSD braces for major upside
Although Bitcoin (BTCUSD) buyers take a breather, the prices remain above the key resistance-turned-support, and the oscillators are positive, too, suggesting the cryptocurrency pair’s further advances. That said, the quote’s sustained trading beyond the 100-SMA and month-old horizontal support join bullish MACD signals and an upbeat RSI (14) line, keeping the buyers hopeful.
Key technical levels to watch
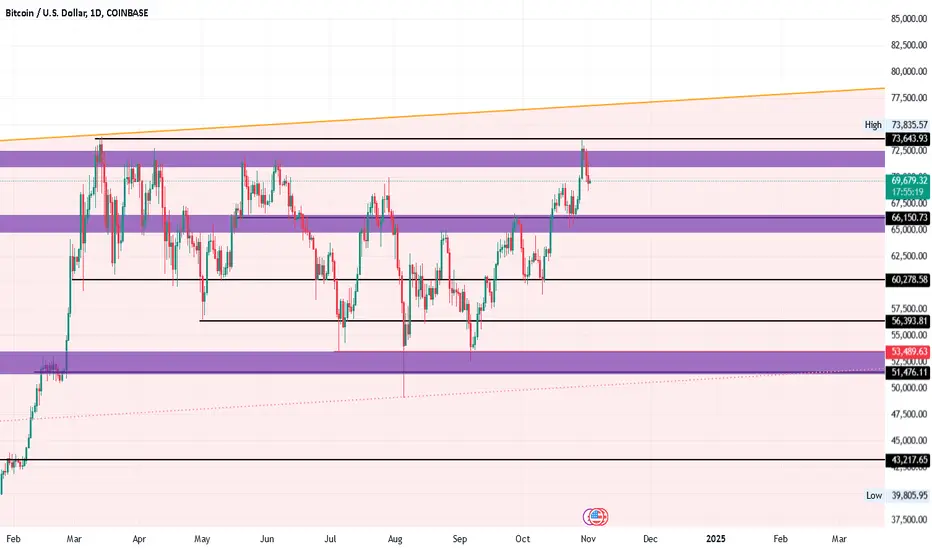
Among the important technical levels, a one-week-old descending resistance line surrounding $68,700 gains immediate attention. Following that, the monthly high surrounding $69,490 and the $70,000 threshold will be in the spotlight. It should be noted that the BTCUSD pair’s successful trading beyond the $70,000 hurdle enables the buyers to aim for the yearly high of around $73,800.
Meanwhile, the 100-SMA and aforementioned horizontal support restrict the short-term downside of Bitcoin to around $66,600 and $66,100 respectively. In a case where the BTCUSD prices remain bearish past $66,100, an upward-sloping trend line from early September, close to $63,000 at the latest, will be the final defense of the buyers.
An interesting week for buyers
Despite positive technical and fundamental signals for Bitcoin buyers, key data and events could introduce volatility, leading to month-end consolidation. Bulls should stay cautious, as they are likely to maintain control of the market.
