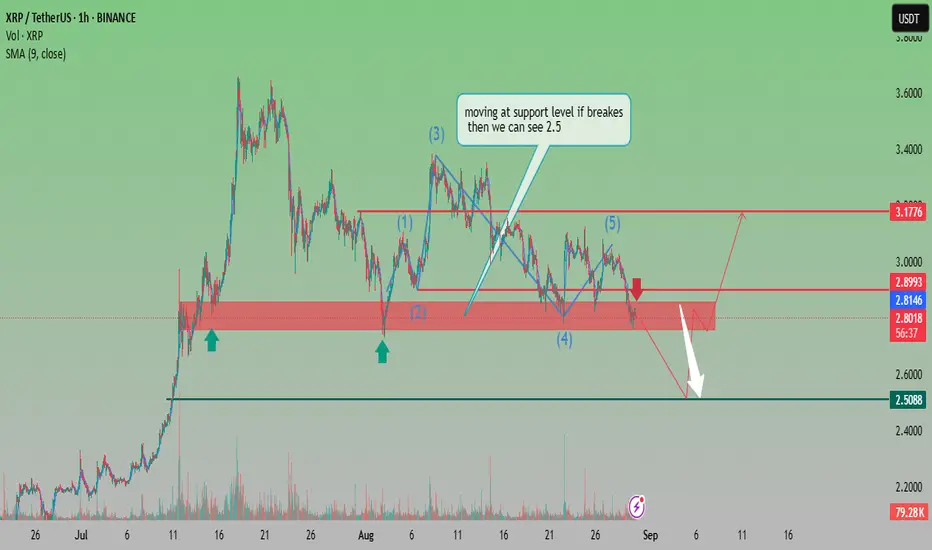
XRP Testing Key Support Zone – Potential Drop Toward $2.50 if ?Analysis:
XRP is currently trading around $2.80, right at a critical support level. The chart highlights a 5-wave Elliott structure, with the recent wave (5) completing near resistance. Price action is now consolidating in a key demand zone around $2.80 – $2.90.
If the support holds, we could see a
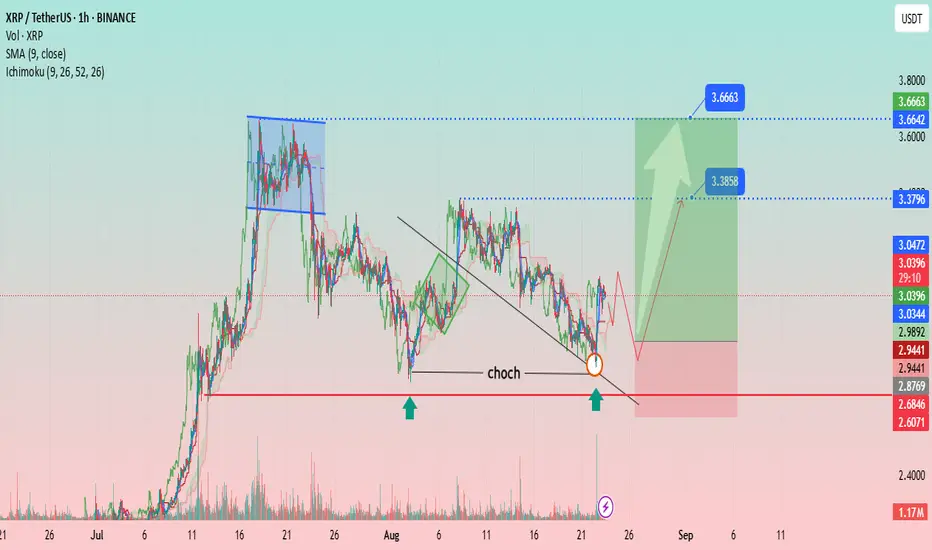
XRP/USDT – Bullish Reversal Setup After CHoCH BreakoutAnalysis:
The chart shows XRP/USDT (1H timeframe) developing a bullish structure after a Change of Character (CHoCH) confirmation near the $2.94 support zone. Price respected the key demand area (highlighted by green arrows) and broke above the descending trendline, signaling potential reversal mom
$XRP – Inverse Head & Shoulders CRYPTOCAP:XRP – Inverse Head & Shoulders
Price is trading at $3.07 after bouncing from $2.66 (recent low).
The 4Hr chart is forming a classic Inverse Head & Shoulders pattern → a strong bullish reversal setup.
🔹 Inverse H&S often signals a trend reversal from bearish to bullish.
🔹Price is sta

XRPUSDT Consolidation Within Ascending Support – The chart shows higher lows forming along an ascending trendline, suggesting underlying bullish pressure despite previous lower highs.
Price is currently consolidating inside a rectangle pattern (green zone), sitting above the key support near $2.98.
The red resistance zone around $3.57 is a major

[SeoVereign] RIPPLE BEARISH Outlook – August 10, 2025In this idea, I would like to present a bearish outlook on Ripple.
There are three main reasons on which this perspective is based.
First, an arbitrary wave X forms a 1.272 ratio with another arbitrary wave X.
Second, a 1.414 BUTTERFLY pattern has formed.
Third, if the consistently formed trendlin

$XRP 2Hr Chart Analysis CRYPTOCAP:XRP 2Hr Chart Analysis
Price is consolidating within a bullish pennant formation after a strong prior impulsive leg. This type of pattern generally reflects a pause in trend before potential continuation, but confirmation is still needed.
🔹Support zone: $3.15 – $3.17 (lower pennant tre

$SOL — Weekly Chart Analysis
BINANCE:SOLUSDT
CRYPTOCAP:SOL — Weekly Chart Analysis
On the 1Week timeframe, Solana is forming a potential Head & Shoulders (H&S) pattern — a structure often associated with medium-to-long-term trend reversals when confirmed.
Left Shoulder: Built around $180–$200 before a corrective dro

$XRP is currently exhibiting a clean Elliott Wave structureCRYPTOCAP:XRP is currently exhibiting a clean Elliott Wave structure on the 1Hr chart
Waves (1)–(4) are already completed, with Wave (4) forming a healthy consolidation above the 3.25–3.30 zone.
Price has now begun shaping Wave (5), which is typically the final bullish push before a larger correc

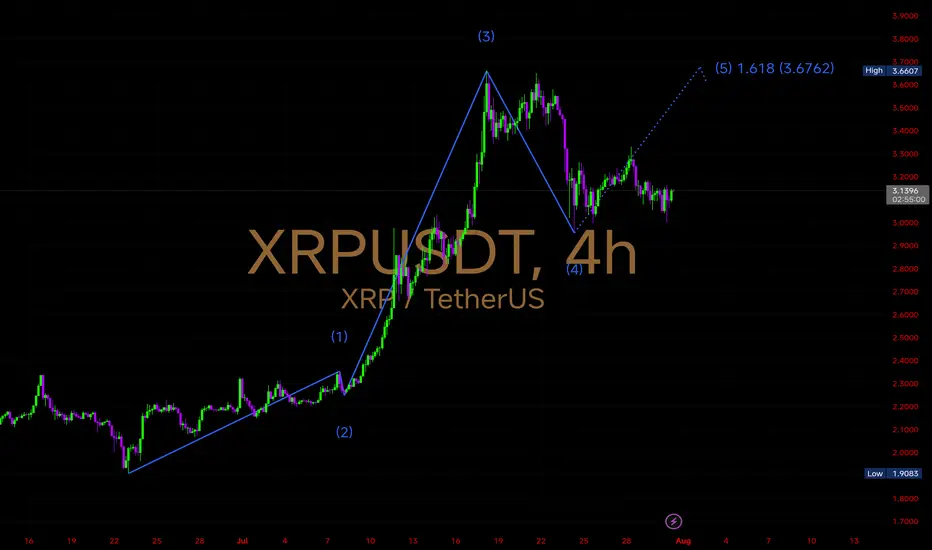
$XRP 4Hr Chart Outlook – Elliott Wave in Play
BINANCE:XRPUSDT
#XRP's 4Hr chart is painting an Elliott Wave sequence, finishing wave (4) and hinting at a move into the final wave (5)! 🚀
🌀 Wave Count Breakdown:
1️⃣ Wave (1): Initiated from sub-$2.00 range with clean momentum
2️⃣ Wave (2): Healthy corrective dip, maintaining bullish struc
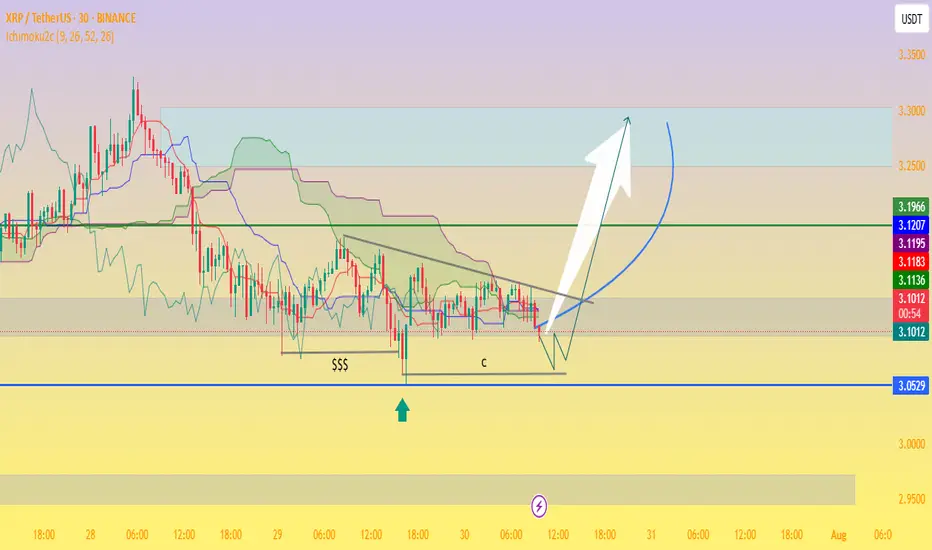
XRP/USDT Potential Reversal Zone — “Bottom Tested, Bullish!📉 Chart Analysis Summary
The divided chart indicates XRP trading between a critical support zone near $3.05–$3.09 and overhead resistance around $3.19–$3.23, forming what could be a bullish pennant or descending wedge setup on the 30-minute timeframe:
Support Zone (~$3.05–$3.09):
Price retested th
See all ideas
Summarizing what the indicators are suggesting.
Oscillators
Neutral
SellBuy
Strong sellStrong buy
Strong sellSellNeutralBuyStrong buy
Oscillators
Neutral
SellBuy
Strong sellStrong buy
Strong sellSellNeutralBuyStrong buy
Summary
Neutral
SellBuy
Strong sellStrong buy
Strong sellSellNeutralBuyStrong buy
Summary
Neutral
SellBuy
Strong sellStrong buy
Strong sellSellNeutralBuyStrong buy
Summary
Neutral
SellBuy
Strong sellStrong buy
Strong sellSellNeutralBuyStrong buy
Moving Averages
Neutral
SellBuy
Strong sellStrong buy
Strong sellSellNeutralBuyStrong buy
Moving Averages
Neutral
SellBuy
Strong sellStrong buy
Strong sellSellNeutralBuyStrong buy
Displays a symbol's price movements over previous years to identify recurring trends.