Beml - Next resistanceBreaking the resistance at 868 - 871 will push the price towards 878, 890 and 902 with the stop loss of 863.
BEML trade ideas


#BEML CASH : MUST TRADE ABOVE 860.1#BEML CASH
19 DEC 2018
LOOKS GOOD ABOVE 860
STOPLOSS 852
TARGET 868-870
(RISK FREE ABOVE 870 FOR 878-880/888)
CMP 848.50


BEML - Two Red Candles In a Row after a monthBEML Chart shows 2 red candles back to back after a month of upward movement from 520 to 780.
Strong Resistance at 780 area. If broken, Next target is 850.
Stoch RSI Shows overbought Conditions on daily. Price went up but Stoch rsi went down. Which in most cases is Bearish.
If BEML Breaks down as a correction, Support zones are 730,700,675 and 625.


BEMLbullish engulfing pattern on daily chart
has been consolidating in range of 699 and 730 for a couple of days now
taking support at 50% fib retracement and
resistance at 61.8 fib levels on daily chart
on 1HOUR chart
go long if rsi upward
macd crossover about to happen
go long when tenkan above kijun
stock trading above cloud

BEML | Nice Flag + Trendline BreakoutBEML was under our watch but failed to publish. It has now broken the flag and can be bought on dips near 730-40 with SL below 25 for Targets 790. 860 and more.

BUY - SLOW AND STUDY WINS THE RACE...BUY ABOVE 645.45
TARGET 745.25
STOPLOSS 595.75
SLOW AND STUDY WINS THE RACE

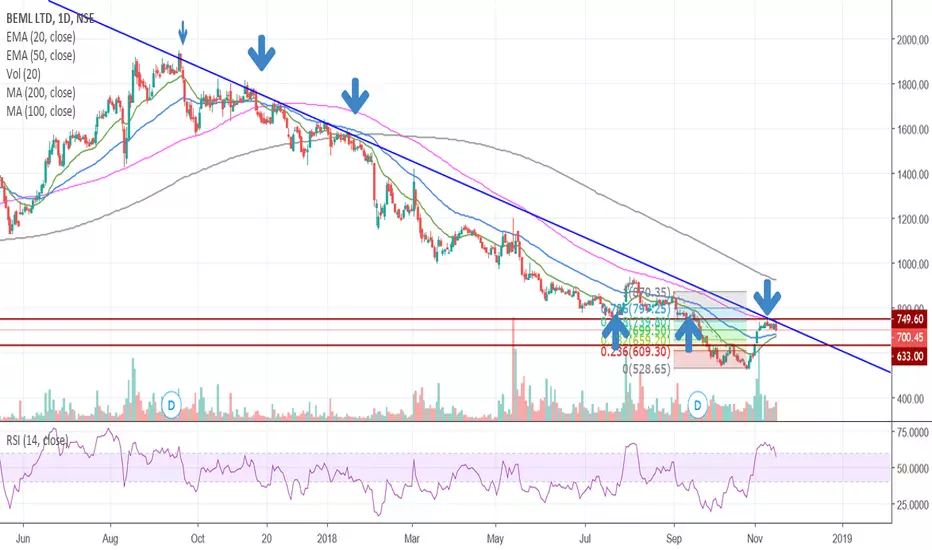
Shorting opportunity in BEML on NSE (INDIA)This is daily chart of BEML on NSE (INDIA) with CMP @ 700.45. It seems to be a good shorting opportunity based on following observations:
1. It is downtrend and price is still trading below SMA200/SMA100.
2. A trendline drawn on the chart shows resistances where price rejections are shown by arrow. Now again, price has tested this trendline and also SMA100 and showing rejection after consolidating during 12th Nov to 15th Nov 2018. Now bearing engulfing is formed on 16th Nov 2018.
3. RSI is also retracing from overbought area (similar to formation in the 1st week of Aug 2018)
4. Also price is showing retracement from 61.8%
All other observations are shown with horizontal line and arrows.
In view of above, it looks a good opportunity to short this scrip with SL @ 739 ( above the high of bearing candle on 16th Nov 2018).
Happy trading...


BEML Falling wedge + Bullish Divergence + Horizontal Support1 Year Long Falling Wedge can be found on BEML Daily Chart.
If the chart is zoomed out, One can see the stock is sitting on Horizontal Support Currently.
RSI Bullish Divergence is visible and can expect bounce from this area.
Resistence: 640
Stop loss below horizontal support.
