COROMANDEL giving some healthy vibes!COROMANDEL appears to be finishing a multi-leg Flat correction. It's time to keep a good eye on the upcoming price action.
COROMANDEL INTERNATIONAL LTD.
2,651.95INRD
+153.90+6.16%
At close at 10:49 GMT
INR
No trades
Next report date
≈
October 23
Report period
Q2 2025
EPS estimate
26.90 INR
Revenue estimate
91.31 B INR
76.70 INR
20.66 B INR
159.82 B INR
120.09 M
About COROMANDEL INTERNTL. LTD
Sector
Industry
CEO
S. Sankarasubramanian
Website
Headquarters
Chennai
Founded
1961
ISIN
INE169A01031
FIGI
BBG000CQ7FQ9
Coromandel International Ltd. engages in the manufacture and market of fertilizers and pesticides products. It operates through the Nutrient and Other Allied Business, and Crop Protection segments. The Nutrients and Other Allied Business segment consists of specialty nutrients and organic fertilizers. The Crop Protection segment produces insecticides, fungicides, and herbicides. The company was founded on October 16, 1961 and is headquartered in Chennai, India.
6.5%
8.0%
9.5%
11.0%
12.5%
Q1 '24
Q2 '24
Q3 '24
Q4 '24
Q1 '25
0.00
20.00 B
40.00 B
60.00 B
80.00 B
Revenue
Net income
Net margin %
Revenue
COGS
Gross profit
Op expenses
Op income
Non-Op income/ expenses
Taxes & Other
Net income
0.00
20.00 B
40.00 B
60.00 B
80.00 B
Revenue
COGS
Gross profit
Expenses & adjustments
Net income
0.00
20.00 B
40.00 B
60.00 B
80.00 B
Q1 '24
Q2 '24
Q3 '24
Q4 '24
Q1 '25
0.00
8.00 B
16.00 B
24.00 B
32.00 B
Debt
Free cash flow
Cash & equivalents
No news here
Looks like there's nothing to report right now

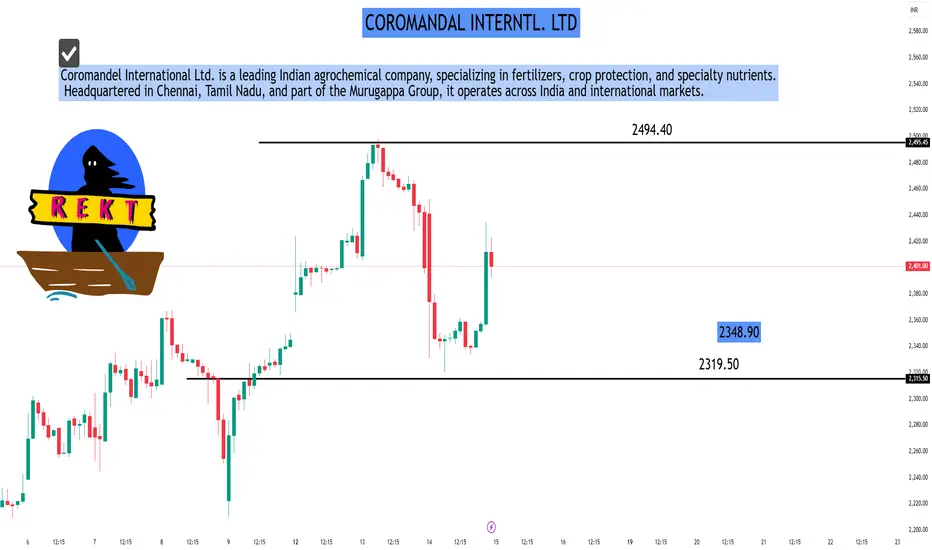
COROMANDAL INTERNTL. LTDAs of May 15, 2025, Coromandel International Ltd. (NSE: COROMANDEL) is trading at ₹2,403.30. Analyzing the 30-minute timeframe provides insights into short-term price movements and potential trading opportunities.
📊 30-Minute Technical Overview
Price Action:
Current Price: ₹2,403.30
Day's Range: ₹2
Coromandel International - Short Trade on ChartsNSE:COROMANDEL Coromandel International Ltd.
Elliot wave reading (Monthly) suggests that that the Wave-3 is completed at Higher High 1971.60; now corrective wave-4 should take over the various projecting end point corrective wave-4 are suggested below.
A short trade opportunity is seen on cha


Coromandel International - A clear winner Even in the current scenario, Stock has got all the strength it needed
Currently stock is following Diagonal support Resistance pattern as can be seen from the chart
Possible change of directions can be seen on the charts
Lower time frame compulsion will be necessary as the volatility is at its p

COROMANDEL - NEXT Candidate for 10% move?Daily chart with internal counts is shared here..
Looks like the impulse 5 wave move is complete now. A pullback to 1500 is on the cards.
I believe that the price is still in it's 3rd wave (Primary count) On Weekly TF. But will wait for the specific levels to confirm..
Here is the chart on weekly


Coromandel International - Breakout Setup, Move is ON...#COROMANDEL trading above Resistance of 1938
Next Resistance is at 2310
Support is at 1545
Here are previous charts:
Chart is self explanatory. Levels of breakout, possible up-moves (where stock may find resistances) and support (close below which, setup will be invalidated) are clearl

Coromandel International - Breakout Setup, Move is ON...#COROMANDEL trading above Resistance of 1680
Next Resistance is at 1938
Support is at 1456
Here are previous charts:
Chart is self explanatory. Levels of breakout, possible up-moves (where stock may find resistances) and support (close below which, setup will be invalidated) are clearly de

See all ideas
Summarizing what the indicators are suggesting.
Neutral
SellBuy
Strong sellStrong buy
Strong sellSellNeutralBuyStrong buy
Neutral
SellBuy
Strong sellStrong buy
Strong sellSellNeutralBuyStrong buy
Neutral
SellBuy
Strong sellStrong buy
Strong sellSellNeutralBuyStrong buy
An aggregate view of professional's ratings.
Neutral
SellBuy
Strong sellStrong buy
Strong sellSellNeutralBuyStrong buy
Neutral
SellBuy
Strong sellStrong buy
Strong sellSellNeutralBuyStrong buy
Neutral
SellBuy
Strong sellStrong buy
Strong sellSellNeutralBuyStrong buy
Displays a symbol's price movements over previous years to identify recurring trends.
Frequently Asked Questions
The current price of COROMANDEL is 2,651.95 INR — it has increased by 6.16% in the past 24 hours. Watch COROMANDEL INTERNATIONAL LTD. stock price performance more closely on the chart.
Depending on the exchange, the stock ticker may vary. For instance, on BSE exchange COROMANDEL INTERNATIONAL LTD. stocks are traded under the ticker COROMANDEL.
COROMANDEL stock has risen by 6.31% compared to the previous week, the month change is a 3.40% rise, over the last year COROMANDEL INTERNATIONAL LTD. has showed a 57.48% increase.
We've gathered analysts' opinions on COROMANDEL INTERNATIONAL LTD. future price: according to them, COROMANDEL price has a max estimate of 3,187.00 INR and a min estimate of 2,100.00 INR. Watch COROMANDEL chart and read a more detailed COROMANDEL INTERNATIONAL LTD. stock forecast: see what analysts think of COROMANDEL INTERNATIONAL LTD. and suggest that you do with its stocks.
COROMANDEL reached its all-time high on May 2, 2025 with the price of 2,649.95 INR, and its all-time low was 146.35 INR and was reached on Feb 12, 2016. View more price dynamics on COROMANDEL chart.
See other stocks reaching their highest and lowest prices.
See other stocks reaching their highest and lowest prices.
COROMANDEL stock is 6.62% volatile and has beta coefficient of 0.73. Track COROMANDEL INTERNATIONAL LTD. stock price on the chart and check out the list of the most volatile stocks — is COROMANDEL INTERNATIONAL LTD. there?
Today COROMANDEL INTERNATIONAL LTD. has the market capitalization of 736.52 B, it has increased by 3.58% over the last week.
Yes, you can track COROMANDEL INTERNATIONAL LTD. financials in yearly and quarterly reports right on TradingView.
COROMANDEL INTERNATIONAL LTD. is going to release the next earnings report on Oct 23, 2025. Keep track of upcoming events with our Earnings Calendar.
COROMANDEL earnings for the last quarter are 17.10 INR per share, whereas the estimation was 13.93 INR resulting in a 22.73% surprise. The estimated earnings for the next quarter are 26.90 INR per share. See more details about COROMANDEL INTERNATIONAL LTD. earnings.
COROMANDEL INTERNATIONAL LTD. revenue for the last quarter amounts to 70.42 B INR, despite the estimated figure of 57.82 B INR. In the next quarter, revenue is expected to reach 91.31 B INR.
COROMANDEL net income for the last quarter is 5.05 B INR, while the quarter before that showed 5.80 B INR of net income which accounts for −12.88% change. Track more COROMANDEL INTERNATIONAL LTD. financial stats to get the full picture.
COROMANDEL INTERNATIONAL LTD. dividend yield was 0.61% in 2024, and payout ratio reached 17.10%. The year before the numbers were 0.56% and 10.75% correspondingly. See high-dividend stocks and find more opportunities for your portfolio.
As of Jul 30, 2025, the company has 28.97 K employees. See our rating of the largest employees — is COROMANDEL INTERNATIONAL LTD. on this list?
EBITDA measures a company's operating performance, its growth signifies an improvement in the efficiency of a company. COROMANDEL INTERNATIONAL LTD. EBITDA is 29.05 B INR, and current EBITDA margin is −33.43%. See more stats in COROMANDEL INTERNATIONAL LTD. financial statements.
Like other stocks, COROMANDEL shares are traded on stock exchanges, e.g. Nasdaq, Nyse, Euronext, and the easiest way to buy them is through an online stock broker. To do this, you need to open an account and follow a broker's procedures, then start trading. You can trade COROMANDEL INTERNATIONAL LTD. stock right from TradingView charts — choose your broker and connect to your account.
Investing in stocks requires a comprehensive research: you should carefully study all the available data, e.g. company's financials, related news, and its technical analysis. So COROMANDEL INTERNATIONAL LTD. technincal analysis shows the strong buy rating today, and its 1 week rating is strong buy. Since market conditions are prone to changes, it's worth looking a bit further into the future — according to the 1 month rating COROMANDEL INTERNATIONAL LTD. stock shows the strong buy signal. See more of COROMANDEL INTERNATIONAL LTD. technicals for a more comprehensive analysis.
If you're still not sure, try looking for inspiration in our curated watchlists.
If you're still not sure, try looking for inspiration in our curated watchlists.