DMART trade ideas

DMART to set a retracement example on MondayThis is purely for educational purpose to understand retracement.

Avenue SuperMart - Price Action Strategy -Accumulation PhaseExplained in the chart how simple range breakout can be predicted.


Weekly DmartWEEKLY AVENUE SUPERMARTS DMART #DMART Investment-Patience-BlackCandle-BlueCandle #CatchFallingKnife Note: My personal view is not to follow.

Expecting Breakout ✌✌✌✌This scrip is expected to give breakout in the coming days. So traders keep on your radar to catch the momentum. Thanks to all 🙏🙏

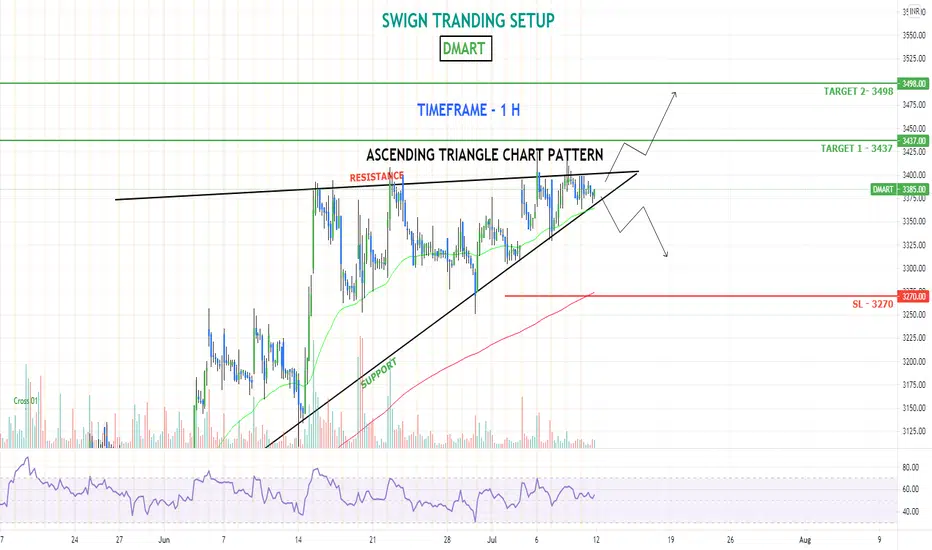
Dmart for swing.Dmart for swing, Wait for either breakout or retracement, Mark sl by looking at price action.

FY21-22 Swing Trade Idea #138:: Long on DMARTThis is a public swing trade idea (other private ideas accessible through website) and is only for Learning and observational purpose. Please understand your risk and take full responsibility of your actions. We would comment on any further updates on our entry, targets and stop-loss on this idea, so make sure to follow if you want to get further updates. Our objective to help anyone who wants to learn technical analysis using charts. You can post your queries in comment section here and we will try to answer asap.


DMART: All targets done!Please check my idea posted about DMART on 21st July. Both targets have been reached. 5% return in 14 days. :)
Jul 21
DMART has been facing rejection from the 3400 level since the mid of June 2021. Despite these multiple rejections,
the lows that it makes are gradually becoming higher. It took support at 3250 on 18.06.21, then again on 29.06.21,
then it formed the next swing low at 3300 on 15.07.21.
___________________________________________________________________________________________________
If we zoom in to the 30 min chart, we can clearly see that the previous times when price reached the 3400 zone, it
was rejected severely, but on the latest occasion on 20.07.21, price has stuck close to that level for a couple of
hours and has closed very near to 3400, at 3397.
___________________________________________________________________________________________________
The formation on the daily chart resembles an ascending triangle and if we look closely, the volume has been
positive and increasing the past few sessions with above average volume on 20.07.21. If DMART does finally break
past this level, a long can be initiated if the price sustains above the "LONG ABOVE" level for 15 minutes, keeping
the following levels in mind:
LONG ABOVE: 3425
STOP LOSS: 3335
TARGET 1: 3515
TARGET 2: 3600
Remember, trade your plan, risk management is key.
Like and follow for more. :)
___________________________________________________________________________________________________
Jul 27
Trade active
Jul 27
Trade closed: target reached: Target 1 has been achieved at 3515 on 27.07.21.
13 minutes ago
Trade closed: target reached: Target 2 has been achieved at 3600 on 04.08.21.
5% return in around 14 days.
:)

DMART: Rounding BottomWas going through this DMART chart and luckily enough got to analyse two bullish patterns in a single chart:-
1. Inverted Head and Shoulder
2. Rounded Bottom
If you look at the Inverted Head and Shoulder pattern it hit its target on the upside equal to the depth of the Head and then gave a break out completing the Rounding Bottom Pattern.

DMART LOOKING BULLISH .TODAY DMART RELEASES HIS Q1 RESULT . PERFORMACE IS VERY GOOD THERE FOR THIS SETUP LOOKING VERY STRONG . THIS IS SWIGN . BOOK YOUR PROFIT AS PER YOUR RISK .
DMART LOOKING BULLISH IN SOME DAYS.WHEN DMART BREAKOUT UPSIDE WITH GOOD VOLUME OR SUSTAIN ON YELLOW LINE THEN WEGO FOR LONG IN DMART .


DMART LONG : Multi Time Frame Analysis.DMART has been facing rejection from the 3400 level since the mid of June 2021. Despite these multiple rejections,
the lows that it makes are gradually becoming higher. It took support at 3250 on 18.06.21, then again on 29.06.21,
then it formed the next swing low at 3300 on 15.07.21.
___________________________________________________________________________________________________
If we zoom in to the 30 min chart, we can clearly see that the previous times when price reached the 3400 zone, it
was rejected severely, but on the latest occasion on 20.07.21, price has stuck close to that level for a couple of
hours and has closed very near to 3400, at 3397.
___________________________________________________________________________________________________
The formation on the daily chart resembles an ascending triangle and if we look closely, the volume has been
positive and increasing the past few sessions with above average volume on 20.07.21. If DMART does finally break
past this level, a long can be initiated if the price sustains above the "LONG ABOVE" level for 15 minutes, keeping
the following levels in mind:
LONG ABOVE: 3425
STOP LOSS: 3335
TARGET 1: 3515
TARGET 2: 3600
Remember, trade your plan, risk management is key.
Like and follow for more. :)
___________________________________________________________________________________________________

DMART IS READY FOR FRESH UPSIDE RALLYBUY DMART AT CMP 3450-3455 TGT 4000
SL: DAILY CLOSING BELOW 3379
REASON:
1> RSI Sustaining above 60
2 > Blue Zone Started with Rising Volume and BOX Breakout
3 > Box Formed in Established uptrend

DMART LONGDmart is forming a perfect cup and handle pattern, we can enter only if a strong breakout candle supported with volumes is formed.


Dmart Cmp 3397 dated 20.7.2021 Dmart Cmp 3397 dated 20.7.2021
1. Flag Pattern on chart BO @ 3420
Buy for a tgt of 3570-3870 SL 3300
It is just a view, pls trade at your own risk.

Expecting Range Breakout ✌✌✌This scrip is expected to Give Range Breakout as it is on the verge of breakout. So traders keep on your radar to catch the momentum and enjoy the profit. Thanks to all.


