Hdfc amc (06-01-2022) my view this stock complete 5 wave impulse and complete A and B corrective wave and c wave 5 wave left this stock maximum down 0.382 retracment and move upside
HDFCAMC trade ideas

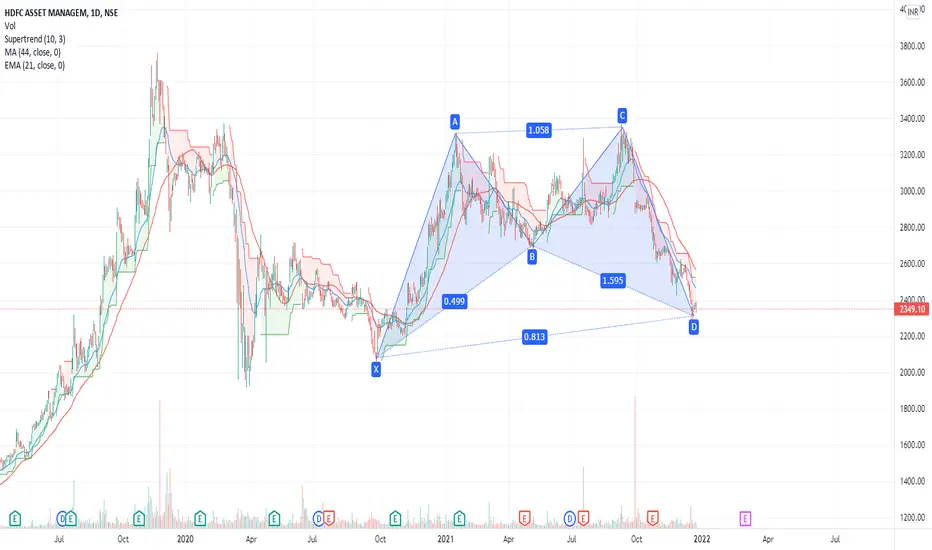
HDFC AMCBuy @ 2400-2450
Put the stop loss below 2380
Upside target @ 2700 then 3000
for 2 months prospective.
Technical:- On the daily chart smart money formed a bullish divergence and ABC harmonic chart pattern. So this is the reason why I'm taking this trade.
Disclaimer:- Before taking any position do your own analysis or, consult your financial advisor.

Simple Trade Setup | HDFCAMC | 27-12-2021 [ INTRADAY]NSE:HDFCAMC
Observations:
1) On 1 week time frame, we can see that immediate resistance level is at 2400 and immediate major support is at 2250-2256 level range.
Please refer below chart : 1 week Time Frame.
2) On Daily time frame, it is still trading below 200 and 400DMA.
Please refer below chart : 1 day Time Frame.
-------------------------------------
Trade Setup for Date: 27-12-2021
1) Don't Jump in to trade at the beginning of the market. Let it get settle for 15-20min first and judge the price action.
2) Everything is mentioned on the chart. I hope it is easy to understand.
3) All the levels will work as support, resistance, entry and exit w.r.t price action near that level.
4) Avoid gap up or gap down chase. Wait and trade between levels.
Please refer below chart for levels.
Hope I made it easy to understand it.
Do comment your doubt or suggestion.
Note: Trade with Strict SL. It may or may not hit all the levels. So one can book profit / loss at respective level considering how price action works near that level.

HDFC AMC - BAT Pattern ConfirmationHDFC AMC is near its long term support zone of 2000-2100.
If it gives reversal from now, can go on and become a rocket.
However, caution on going long as we should wait for a confirmation. (Closing above 50 DMA, or 20 EMA for an aggressive entry).
Stop Loss - 2250
Target Reward/Risk - 3:1
Can trail stop loss at 2:1 for more cautious booking (as the market is in a downtrend).
For educational purposes only. Trade at your own risk.
HDFCAMC IN WEEKLY TIME FRAME DEMAND ZONEPrice in weekly Demand Zone. Entering after hammer candle high break on daily timeframe chart. Good buy at around 2545-55 with stop loss of 2395
Tgt 2695-2745, 2895

Investment/Positional opportunity for 33%HDFC AMC has been falling a lot since quite few weeks and it will be a good opportunity to invest in these good fundamental stock at discount. It can fall a bit more and take support at the trendline.
Keep it on your watchlist and buy around 2400-2450 for a target of 3200. SL will be 2200 on a closing basis. 1:4 risk-reward trade. Do FOLLOW for more ideas. Thank you!


Probable Trend reversal in HDFC Bankwait for Head and shoulder pattern necklinr breakout, might give 4-5% targets within a week.

HDFC Asset Management Company LtdWedge pattern in HDFC Asset Management Company Ltd and reversal started from support line with increasing volume.


go long on HDFCAMC..stock took support at the red curved line and warning line of pitchfork.....exit target is the top curved line

HDFC AMC, Short Sell, Target 1 - 2500, Target 2 - 2350It has broken a weekly and a daily support. After the breakdown, support acted as a resistance and now has taken a continuation towards the south. Short build up is also visible. Supported by the selling in the overall market, this could be have a good downside potential.
Best of luck :)

[POSITIONAL] HDFCAMC LONG BET risk: Reward ratio is 1: 2
Rest as per Charts
********
Note -
One of the best forms of Price Action is to not try to predict at all. Instead of that, ACT on the price. So, this chart tells “where” to act in “what direction. Unless it triggers, like, let’s say the candle doesn’t break the level which says “Buy/Sell if it breaks”, You should not buy/sell at all.
=======
I use shorthands for my trades.
“Positional” - means You can carry these positions and I do not see sharp volatility ahead.
“Intraday” -means You must close this position at any cost by the end of the day.
=======
Always follow a stop loss.
In the case of Intraday trades, it is mostly the “Low/High of the Candle”.
In the case of Positional trades, it is mostly the previous swings
********

SortChart is self explanatory.
Disclaimer: This is for demonstration and educational purpose only. This is not buying or selling recommendations.

HDFC AMC BUY Price 2660 RSI divergence MACD crossoverHDFC AMC has completed its correction and there is crossover in MACD and RSI has also moved from oversold to buy zone . Stock is trading below 200 DMA . Target recommended from Fibonacci retracement .
Target 1 23 % retracement .
Target 2 - 38 % retracement .
SL-2580
(Please note : DO your analysis as I am not Sebi-registered analyst)

HDFC AMC - Important Level to TrackHDFC AMC - Important Level to Track
HDFC AMC is trading near the Demand zone, If there is good volume and some Green candles formed then we can add this for Swing Trade.

BUY HDFCAMC - BULLISH HDFC fallen into the Monthly demand zone, expecting good bounce from here hold till Oct-Nov
Entry CMP
Target and Stoploss : Mentioned on Chart
This is for education purpose only trade as per your own risk

HDFC AMC case studyHarmonic pattern formation
Chart pattern formation :- double bottom, symmetrical triangle formation
divergence on rsi..
Waiting for price action confirmation
lets see whats in store,,
learning is best thing to do in life... we all are students of market, dont skip learning

HDFCAMCAs we see HDFCAMC was in sideway moment on weekly timeframe it was taking support @2750 level and taking resistance @ 3300 level
Finally this week on candle close red belowe support level @2650 so we can see down moment for next few days..
Our TGT should be 2350 SL should be 2800

Positional ideaPositional idea
Pure price action
Only for educational purpose
Like the Idea
See the video for detailed explanation

HDFC AMC @ Support - Ascending Tringle - Buy on DIP Details on CHart
Note: This is for educational purpose only

At a support after fakeout!HDFCAMC is at a long term trendline and moving average support after giving a fake breakout to symmetrical triangle accumulation pattern. Investors might enter this week as Stop loss is small and risk reward is good.

HDFCAMC Buy @ 2757Buy HDFCAMC @ 2757, Average Down if prices fall till @ 1995, SL- 1795, Target } 4300
