HDIL trade ideas
LONG HDIL...high probability investment ideaHDIL
NSE:HDIL
Cmp - 4
Stop - Nil, Add more on relevant dips
Expectation -
T1 - 8
T2 - Open, Review at 8
Expected Holding Period - 3 months or earlier for T1
Technicals - ✅
Fundamentals - ✅
View:- Swing/Investment
Disclaimer:-
Ideas being shared only for educational purpose
Please do your own research or consult your financial advisor before investing
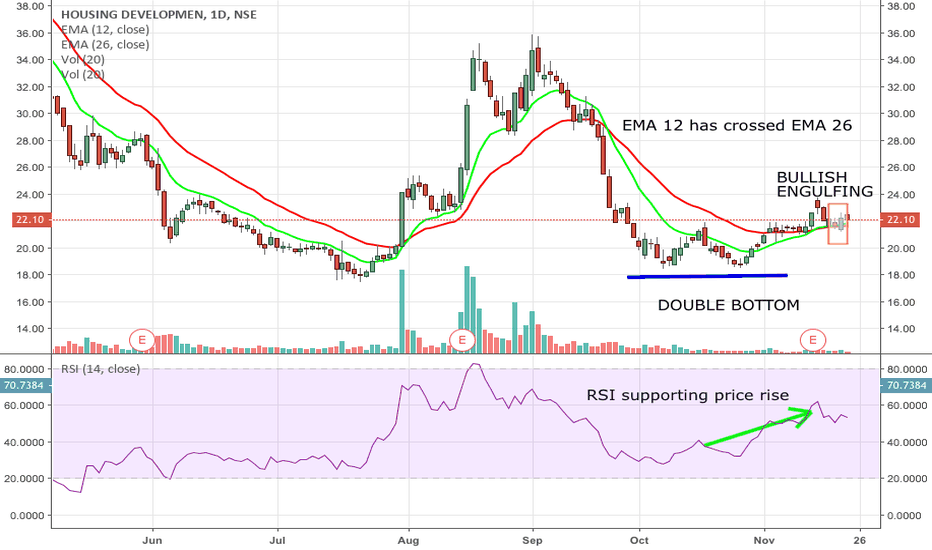
HDIlthis looks good. with double bottom in place and diagonal line breakout , its on rising line having immediate resistance zone around black line! slowly it will inch higher, if i initiate the position , i will go long. it has smaller patterns but i choose to not put it up here. they arent as clinical as they should have been.
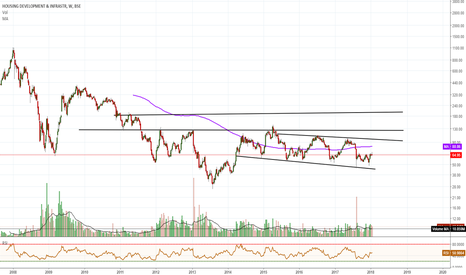
head & shoulder breakdown in HDIL weekly chart. Today HDIL daily candle is strongly bearish and closed at 62.05. Now I am looking at HDIL weekly chart and there is head and shoulder pattern breakdown is seen. Today low was 56.60. If am looking at monthly chart then support comes around in the 50-55 range. If it goes below that level then next support is around 25-30 zone. so my view is strongly bearish on hdil and I recommend SELL HDIL around 62-65 level with stop loss at 76; My target is 40.
HDIL:22 highly over sold. next res:37 and 53.00 SL:21HDIL:22 is showing a positive divergence after breaking the long term support
can make move towards 37 and on crossing this level can take the stock to 53.
An improved quarter can overturn the scenario from bearish to bullish till then it is a poor show.
HDIL - Bullish Reversal In Play It has been observed that the price action firstly breaking above the downward channel and now initiating to form a higher high and higher low sequence indicating a reversal in the price action.
As per my analysis, price action shall further move up to the below targets.
T1- 45
T2- 47
SL- 40
Thanks
HDIL - Bouncing off strong supportHDIL (NSE) for some time is trending in a rectangle and currently at a very strong support zone. It seems to be bouncing off it. It a good opportunity to go long. I am waiting for 1 day candle to close above 52. RSI shows a reversal however MACD is yet to cross over.
Three things to keep a note of-
1 day candle closes above 52.
MACD crossing over
RSI showing uptrend
If these three fall in place we have a good confirmation.
Enter trade between - 52 and 56
Profit target - 65
Stop-loss - 48
Also note, the stock has been trending in the rectangle for almost 6 months. If it breaks out in the downside then you can go short and take profit at 40. And if it breaks out on the upside then the target would be 86.
Please do your own analysis and enter trade.
I am always open to feedback.
How to trade Range/Channel One of the pattern that occurs very often is the range. One can trade it easily this formation using only price action without any help from indicators or other studies. Whenever the price breaks out of the range in either direction we can look for entry into the trade. There are 3 ways to enter marked in the chart.
1. Enter on the breakout.
2, Enter on the pull back to the breakout level.
3. Enter after the pull back or retest of the breakout level is over.
We need to keep in mind the fact that breakout attempts to fail quite often so entering on breakout of the level has its own risks. Entry at pull Back after successful breakout is better but it does not happen always. One can also enter on break of swing pivots.
Please practice and post your charts as comment. Practice only would train your eyes to recognize it.


