HIMATSEIDE trade ideas

Breakout in Himatsingka Seide...Chart is self explanatory. Entry, Targets and Stop Loss are mentioned on the chart.
Disclaimer: This is for demonstration and educational purpose only. This is not buying or selling recommendations. I am not SEBI registered. Please consult your financial advisor before taking any trade.

Himatsingka Seide cmp 245Himatsingka Seide cmp 245
Positional view on Weekly chart:
1. 3 Years Rounding Pattern consolidation BO above
250.
Buy for a tgt of 280-305-340-375-400-450 SL 200
It is just a view, pls trade at your own risk.

Long Himatsingka SeideHimatsingka Seide
Cmp - 183
Stop - 150 on DCB
Expectation -
T1 - 440
T2 - Open, Review at 440
Expected Holding Period - 140 trading days or earlier for T1
View:- Swing/Positional
Disclaimer:-
Ideas being shared only for educational purpose
Please do your own research or consult your financial advisor before investing

HIMATSEIDE is ready to give breakoutAfter rejecting the sellers price is near the neckline of inverted head and shoulder formed after the downtrend.
Keep an eye on it!
Keep supporting! Keep learning! Keep earning!


Buy HIMATSINGKAAccording to chart anylasis its trade in parallel channel so that is the perfect for swing trade buy.
Buy swing 195 or @CMP
Target : 215, 225 ++


Mild bearish divergence in Himatsinghka SeideThere are signs of a weak bearish divergence in HIMATSEIDE.
The prices are making higher highs but in the last 2 peaks RSI has formed almost the same highs.
The down side may not be much but I have put in 3 support levels.
S1 - 177.45
S2 - 167.7
S3 - 159.8
NOTE:
1. I have marked a similar divergence that has happened in the recent past for your reference.
2. I checked the RSI at a lower timeframe (4h) and the divergence seem to go away but I am sticking to the daily tf for my analysis

HIMATSEIDEWeekly Chart Analysis :
~165 level was once resistance now acting as support. Watchout for Inverted H & S and, Triangle Pattern Breakout.
In recent weeks, formed good bullish candles. Good stock to add in your Investment portfolio.


Swing and Intraday ideasThe stock looks good above 185 for intraday and 190 for swing target of 197 and 210

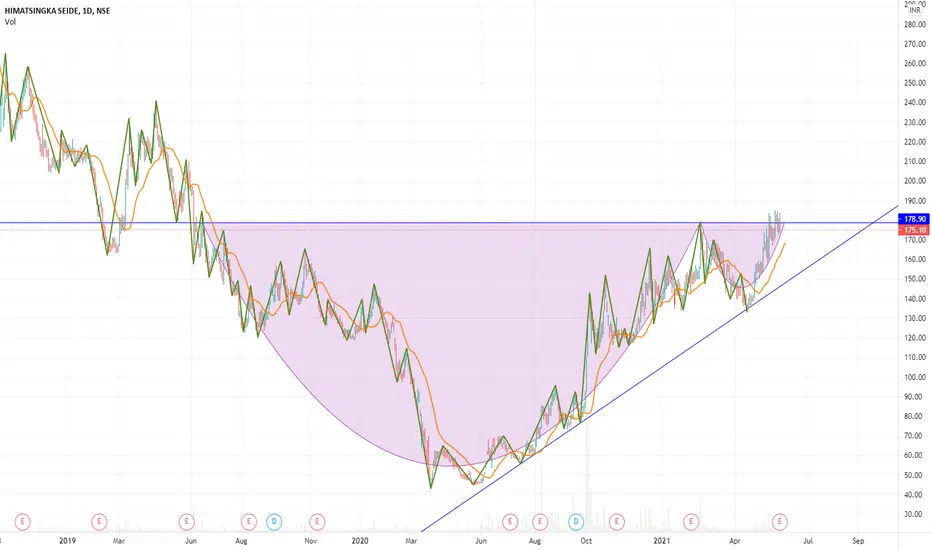
Himatseide - 6 month weekly closing highHimatseide has been range bound for almost 6 months with the weekly upside capped at 160-163. The stock has managed to breakout of this range for the first time this Friday with very high volumes. The stock has also given its highest weekly closing since June 2019.
There is similar congestion in the monthly chart with the stock not being able to cross 160 on a monthly basis for many months now. Looking at the chart, we can assume that a monthly breakout is on the cards and the current upmove will continue.
Targets : 195 (200 week SMA level) and 222 (support and later resistance in 2019) are short term targets. Weekly close above 220 will take the stock much higher.
Stop Loss: Longs can be held with a WCB stop loss of 155
One can go long in Himatseide at CMP and add on declines to 160. Consider it to be a mid to long term trade/investment.


range breakout GREEN LINE WILL WORK AS SUPPORT AND RED LINE WILL AS RESISTANCE IF PRICE GO ABOVE RED LINE, IN THAT CASE, RED LINE WILL ACT SUPPORT


Himatsingka is ready to give breakout above 162 levelHimatsingka is ready to give breakout above 162 level

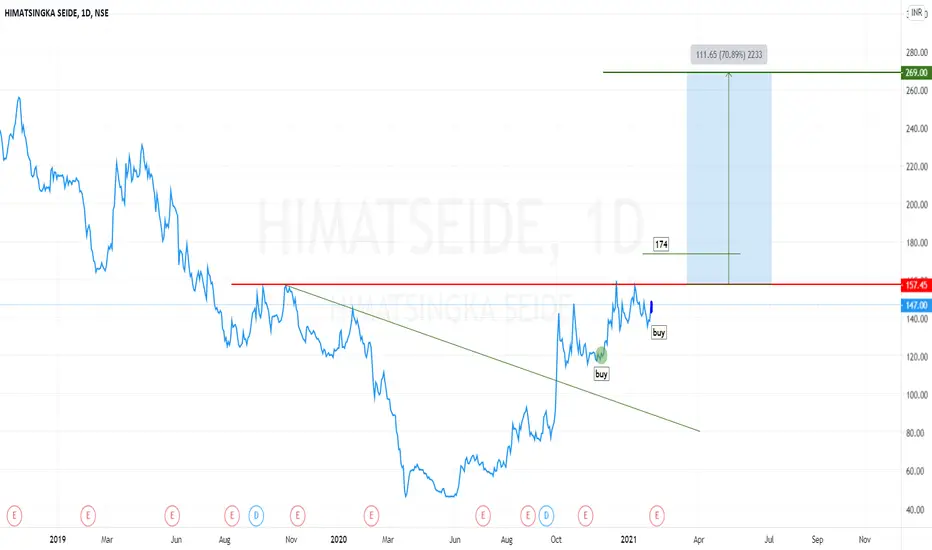
HIMATSINGKA SEIDE waiting for a move long term target 269 himatsingka seide, accumulating for an immediate trgt of 20 % = 174, and long term trgt of 70% = 269....