IBREALEST trade ideas


IBREALEST -Short Term Positional bullish ViewCup & Handle formation - Target -170
Note - For Educational Purpose.


Supply and demand analysiscuurrent trend is bullish by analyzing through suppy and demand .CMP cuts the supply demand which gives a strong bullish signal for this stock and it will reach upto 180 -185 in the upcoming weeks.If it breaks the supply zone 2 then it will try to reach the target of 200+ or will return to first demand zone level.

INDIABULL REALAs you all can se a beautiful chart pattern has broken here on weekly time frame and also retested so now you can buy this stock on any dip for the targets of 200 ,205, 210 but it totall depend on you .....
disclaimer :- I not any financial advisor or sebi registered person so you also do you analysis ,I am not responsable for you loss
thanxxx......

BREAKOUT IN INDIABULL REAL ESTATE Range Breakout with unusual/high volume or Breach in Previous high with unusual/high volume in Indiabull Real Estate (IBREALEST) can be seen in 1D Timeframe. Position can be made at CMP or can apply buy on dip strategy till 125 level. Would suggest to apply buy on dip strategy for this security for the short term target of 143 and 160 levels with a strict stop-loss of 124.90 (only on candle closing below basis) .
THIS VIEW OF MINE IS PURELY BASED ON TECHNICAL CHART, BEWARE OF NEWS AND OTHER FACTORS WHICH CAN AFFECT THE MARKET SENTIMENT.

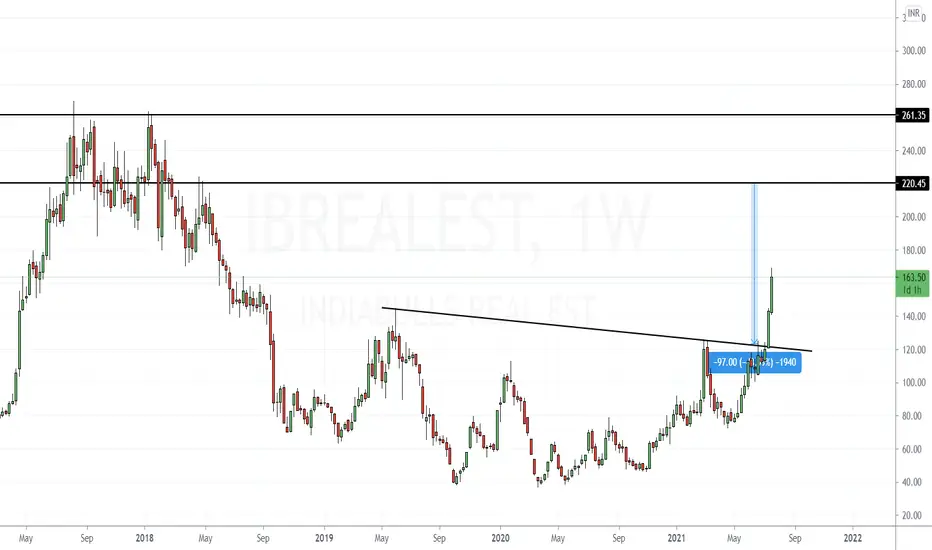
IBREALEST 3 yrs long resistance BONSE:IBREALEST
IBREALEST Brocken 2 yrs resistance level 123
with cup and handle pattern.
and reached 3 yrs resistance 159 level in 6 days.
All levels marked on chart


IT'S TIME FOR IBREALESTATE TO MAKE A BREAK ON THE LONG SIDEIt's time for IBRealestate to make a break on the long side.
It has just come out of a cup and Handle Pattern and also a Bullish Flag Pattern. It has also made a couple of tries to break the Long Term Trend Line but the move did not last long.
There is also a strong resistance at 117.90. It has to break and close above this with strong volumes and a positive follow up candle to take a long position.
Targets T1- 144.70
T2- 179.50 with a SL OF 99.
I have entered at 114.20.


IBREALEST reached T1 with 12%, level respected very wellNSE:IBREALEST
India bulls real estate moved up very well towards target T1 with 12% in a single day.
Power of analysis: check out the level reach, market respected the level very well.

IBREALEST is ready to give breakoutPrice reached near the supply zone with heavy volumes after the formation of rounding base.
Once you get the signal of sustainability of the stock above the supply zone, you can put it on the buying radar.
Keep tracking!
Keep learning! Keep earning!

Breakout in Indiabulls Real Estate...Chart is self explanatory. Entry, Targets and Stop Loss are mentioned on the chart.
Disclaimer: This is for demonstration and educational purpose only. This is not buying or selling recommendations. I am not SEBI registered. Please consult your financial advisor before taking any trade.


Indiabulls Real Estate SWING TRADEThis is for learning purposes only, take your trade at your own risk, and by taking your financial advisor's advice.

IBulls Real Estate Cmp 143 dated 16.7.2021IBulls Real Estate Cmp 143 dated 16.7.2021
1. 3 Years beautiful consolidation BO above 135.
Buy for a tgt of 165-190-230-265 SL 105
It is just a view, pls trade at your own risk.

RS/RSI AND SUPERTRENDWHEN RS IS ABOVE 0 , RSI IS ABOVE 50 AND ST IS POSITIVE IN DAILY CHART TRY TO BUY THAT STOCK NOT SELL IF VOL AND DELIVERY IS HIGH,

India Bulls Real EstateBuy positional for 6 months.
Clear reversal indications on the monthly charts may push the prices to 70-80% in the very short term.
#Roundingbottom

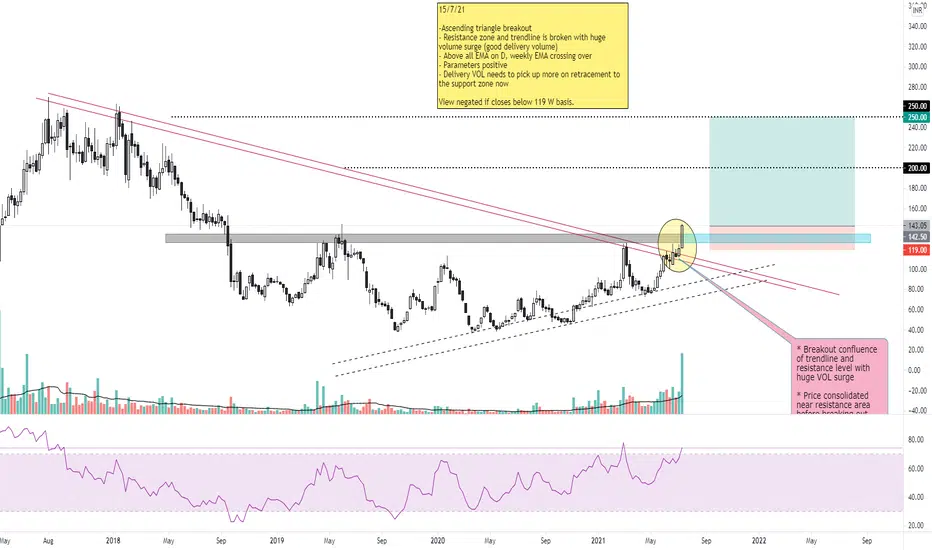
IBREALEST | Weekly | Triangle breakout | 50%+ potentialCMP- 143
SL- 119 (closing)
Target- 200, 250
15/7/21
-Ascending triangle breakout
- Resistance zone and trendline is broken with huge volume surge (good delivery volume)
- Above all EMA on D, weekly EMA crossing over
- Parameters positive
- Delivery VOL needs to pick up more on retracement to the support zone now
View negated if closes below 119 W basis.
INDIABULLS REALESTATEIF IT SUSTAINES AND USES THE BROKEN LEVEL AS SUPPORT..THEN WE CAN EXPECT GOOD UPWARD JOURNEY..FOR A LEARNER GOOD STUFF TO OBSERVE....

