IFBIND trade ideas

IFB IND! LONG NSE:IFBIND
One Can Go long with a Strict SL below the Trendline or Swing Low of Daily Candle.
Close should be good, and Clean.
R:R ratio should be 1 :2 .
Disclaimer : You are responsible for your Profits and loss, Shared for Educational purpose

#IFB Industry Bullish Harmonic#IFB Industry Bullish Harmonic
Buy on dip for good RR
Target-1086/1121+
SL-840
CMP:996.70 @ 20 March 2022
Timeframe - 2-3 months
Disclaimer - Shared only for educational purposes

IFB , looks good in 1-3 weeks for 200 Rs upIFB ... HAVING GOOD PRICE ACTION PATTERN, volume dry, good RSI support, will move to next RESISTANCE.

IFB - Retesting for demandCategory: Continuation
Key Highlights:
1. Bullish market structure on HTF
2. Tapped into the demand zone
3. Massive volume on the creation of the demand zone
Disclaimer: This is NOT investment advice. This chart is meant for learning purposes only. Invest your capital at your own risk.
Rajat Kumar Singh (@johntradingwick)
NSE Certified Technical & Fundamental Analyst


IFBIND broke consolidation channelNSE:IFBIND broke a minor consolidation zone and is heading for a target of 1500.
Area of entry would be in between 1250 - 1300 and Stop loss can be 1100
Supporting factors
1. Huge Volume on Breakout
2. No Major Resistance until 1500

#IFBindustries we can see the flag pole pattern breakout here , upside move just started with good volumes
keep the long position

IFB Inds Cmp 1297 dated 22.10.2021 Weekly Chart: BUYIFB Inds Cmp 1297 dated 22.10.2021
Weekly Chart:
1. Flag Pattern Bo @ 1250.
2. Increase in volume
Buy for a tgt of 1640-1700+ SL 1140
It is just a view, pls trade at your own risk.

BREAKOUT IN IFB -- SWING TRADERefer the chart for entry, sl and target. Breakout with a big green candle and high volume. Chart is self explanatory. Trade with proper risk management. Thanks. Cheers.

IFBIND: CONSOLIDATION BREAKOUTNSE:IFBIND
Levels mentioned in Chart.
Note: Not a SEBI Registered analyst.
Trade at your own discretion.


IFB Industries bullish breakout observedIFB Industries has given a recent trendline breakout as well as breakout from a W pattern formation in Weekly and Daily charts.
This makes it bullish for in short term.
Entry-EXIT can be done as below:
BUY around 1260-1250 during retracement or RISKY traders can start accumulating above 1316
SL: 1220 below
Targets: 1399 as first target, a breakout with good volume above can take it to 1500+ levels
Risk-Reward ratio: 1:3+
Don't forget to keep revising SL once in profit.
** This is a good time for IFB considering festive season sales as well.

IFBIND - Positional Long1. Resistance Zone breakout
2. Volumes pick up
3. Consolidation at resistance before breakout

How to enter a stock with institutions!Using multiple confirmations, different timeframes and by applying rules of price action over a chart let's one understand HOW THE PRICE BEHAVES!
Here is an example of buying a stock at the lows (Disclaimer: NOT THE ABSOLUTE LOWS)
Let's start with a Higher TF- Weekly'
The stock is in a formation of a price action pattern called CUP & HANDLE, where CUP is complete and HANDLE is forming and it is the spot where an early entry is possible ahead of a proper breakout.
This early entry becomes possible with following confirmations:
1. Volumes : Since the absolute low has been established the volumes in the stock as grown multi-fold which in itself is an indication that smart money is already into the stock.
2. RSI: After declining into bearish teritory below 40 in March 2020, the stock bounced back into neutral zone between 40-60 and closing above 60 on 31 August 2020. Since then the stock remained in overbought zone and kept on increasing and took a breather making a double bottom at 40(which is also termed as a support level) and making a neckline on 60 which was breached and retested providing adittional confirmation to the setup
3. The HANDLE: During handle formation the stock made a double botton between 870-910 levels which a pettern within a pattern also adding to the confidence.
The DAILY Chart
Now, the stock is confirmed that it is in a directional trend. Samller TF will help us in better entry and exit levels. The same procedure must also be followed in the lower TF because if the trend is distorting it will reflect in smaller TF first. Here,
1. Volumes: Near the neckline the stock has seen low volumes and the price has moved in a narrow range which we can also say an accumulation zone confirmed by a breakout with tremendous volumes.
2. RSI: Since the stock has been accumulating the RSI line rested near 60 zone which is also a support zone.
3. Pattern: As discussed earlier double botton is formed which more vibrant and act as a confirmation on lower TF.

IFB Industries long Trade IFB Industries long Trade. The box pattern is broken today. You can find the flag pattern too. IFB Industries have good fundamentals and now technically looks strong. The targets are 1450 and 1650.
Target 1: 1450 (In 40 days or might be in this next week)
Target 2: 1650 (In 60 days)
Happy Trading!


IFBIND | Flag pattern - Looks potential for 22%IFBIND | Flag pattern - Looks potential for 22%
CMP : 1181
SL : 1120
Target : 1400, 1450
1:4 risk reward setup
Second opportunity to accumulate.

Stock Analysis of IFB Industries Ltd.Price - 1179.85 Dt. - 08.10.2021
Stock is consolidating near the support line placed at 1168.70. It tried to break this level twice before breaking successfully with higher than average volume. Stock is consolidating for the last 4 weeks and it looks like the stock is ready to resume the uptrend. RSI is strong and stock is above 21 DEMA and 50 DEMA.

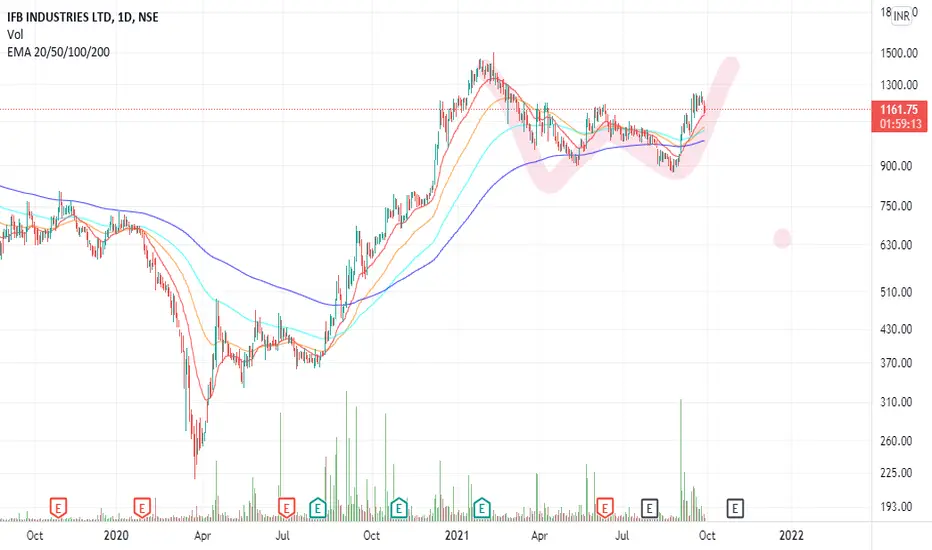
ifb for soon 1500+, W pattern double bottomIFB will soon touch 1500+ , double bottom W pattern aided by volume
TRENDLINE BREAKOUT | IFB INDUSTRIES IFBIND Daily: Looks good for Swing above 1102
1) Trendline Breakout with huge volumes.
2) Risky traders may enter at CMP, safe traders wait for closing above trigger price 1102.
3) Target 1 - 1172, Target 2 - 1238

IFB IndustriesGood that its consolidating above resistance.
Needs a Breakout of recent high.
Swing Trade above 1250
Sl 1140
May move in 1400+ zonesh

