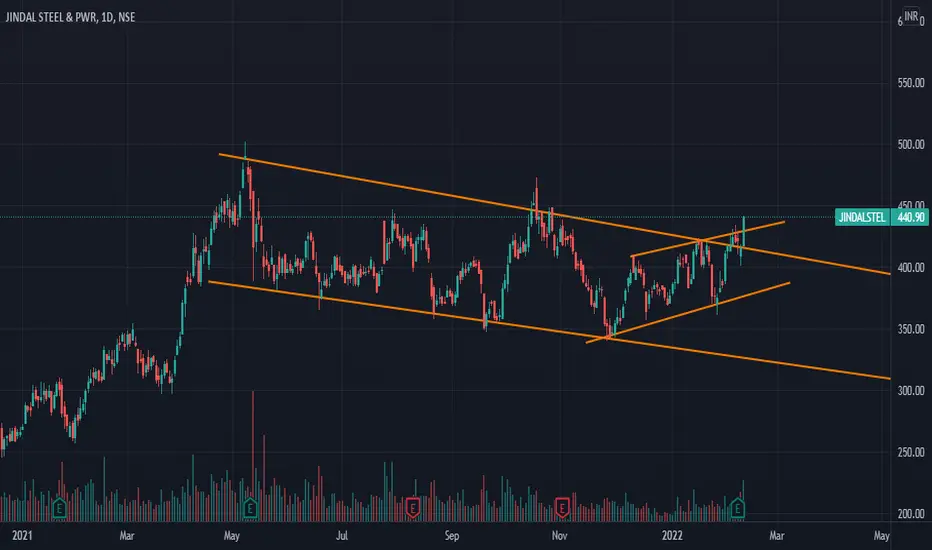
JINDALSTEL Trade SetupWait for proper breakout and retest and then one can look for entries.
Please Hit the like button this motivate us to make more such analysis.
For more such trading content follow us on ( @tradechefofficial )
JINDALSTEL trade ideas

Good Swing trade opportunity in Jindal Steel and Power. A nice Flag pattern Formed. Enter Right after breakout if you want to be aggresive. or wait till 1Hour candle to close above Trendline. Target and Stop loss Levels are given.
NSE:JINDALSTEL

SHORT JINDALSTEELThere is harmonics from where jindal steel can reverse. rest all thing mentioned on chart. kindly refer chart. thanking you.

JSPL: 16% ROI in 15 daysOn Jan 27, when the stock was at 376,
this is what was suggested
The stock gave ample opportunity to buy.
Today JSPL has made a high of 444.80
That is 18% ROI in about 15 days.
CMP 438 (16.5% approx)
Profit booking can be considered
Just following SImple Technical Analysis and results are in front of you
Happy trading....!!!
(P.S: The credit here goes to Krishna ji for highlighting this set up😀)

JSPL: Near Support levelsJSPL
- the stock is currently trading below it's 50 day
- The stock is currently near it's 200 day EMA (a tad below to be precise)
If 200 day EMA is withheld and the stock goes above 50 day EMA, then Target for the set up 418 / 447
- Given the volatility, consider buying in 2 tranches - one at current levels and have provisions to buy on dips towards 340-350 zone in case if that comes
Ignore if you are looking for short term quick gains.
Take care & safe trading...!!!
Disclaimer
- The view expressed here is my personal view
- Past performance is not a guarantee for future predictions
- Use this for educational purpose
- Any decision you take, you need to take responsibility for the same
- It's your hard earned money. Treat it wisely
- Trade / Invest keeping in mind your trading style, goals and objectives, time horizon & risk tolerance
- if trading in F&O, understand that F&O trading involves risk
- Do take proper risk management measures
- Do your own analysis and consult your financial adviser if need be

JINDALSTELJindal Steel & Power Ltd.
JINDALSTEL
CMP: 441
- Tight consolidation for 8 months
- I don't want to miss this one

Jindal Steel and Power Massive breakoutA massive breakout rally should begin in Jindal Steel and Power soon. It is a triangle pattern breakout and even horizontal trendlines are broken. Keep a strict stop loss at Rs.420 for targets of Rs.500-545-605 in the short to medium term. A decisive and strict stop loss is necessary in metal stocks as they tend to reverse sharply and are very cyclical in nature. Please do follow your stop losses.

magic of wavesweekly breakout stock with high volume and moving towards 5wave if u like our study pleasse like comment and follow us

JSPL Triangle & weekly flag BONSE:JINDALSTEL
can add around 440-445
avg can be done near 365
SL closing below 335
T 480, 530, 600++

Trendline Breakout in JINDALSTELDON'T HAVE TIME TO MANAGE YOUR TRADES? | Trendline Breakout in JINDALSTEL
- Take BTST trades at 3:25 pm everyday
- Book profits within first 30 minutes of the market opening
- Try to exit taking 3-5% profit of each trade
- SL can be taken when 5/15 min candle close below 44EMA
- SL can also be maintained as 1% or closing below the low of breakout candle
Levels mentioned on the chart are calculated using Breakout Indicator
Now why do I prefer BTST over swing trades? The primary reason is that I have observed that 90% of the stocks give most of the movement in just 1-2 days and the rest of the time they either consolidate or fall
Buy Today, Sell Tomorrow: JINDALSTEL for more than 5%


JSW Steel trading in trendline..!!Metal sector doing well.. Its Time for JSW steel now, trading in the trendline and give targets of Rs 470/- from here in short term..!!
Disclaimer: I am not SEBI registered and all the analysis is purely for educational purposes. Not a buy or sell recommendation. consult your financial adviser before entering any trade.

JINDALSTELFlag and poll pattern & channel pattern up direction
uptrend zigzag
support on important level of 405
break out of Monthly level
tgt 472/500
for swing or positional
sl swing low

Jindal Steel & Power gaining some POWERAfter testing our nerves of steel, the stock is gaining power. A good risk-reward above resistance.

Jindal Steel Breakout for learning purposeBeauty of True Break out
JSW steel Symmetrical Triangle
formation observed in
daily time frame
For beginners and learners a good
breakout example for learning
mcpriceaction


jindal steel 1 hrin making on inv. H&S expecting good move above 425
Do your own research before trading

Jindal Steel & Power Short TradeLevels are explained in charts with Entry, Target & Stop Loss.
Disclaimer: This study is for educational purpose only & is not buying or selling recommendations. I am not SEBI registered. Please consult your financial advisor before taking any trade.


JINDALSTEL 460 +10% UPSIDE POSSIBLE SWING TRADENSE:JINDALSTEL
Trade Logic | UPTRENDING MOVING AVERAGE. BREAKOUT SWING HIGH BUY
Entry 420
Stop 380
Target 460
RR 2.0+ 2nd Target Open
Details on chart as always
1 FREE trade idea Daily/Weekly.
Trade Size 5%- 10% Max
Max Trades 10-20/ Month
Time Frame 1 WEEK - 1 MONTH. Max
Diversify Bet Small Lose less. | Our Motto.
#TRADEWORLD | #MARKET_MAGIC
----**All Stocks Shared are in My Personal Trade Portfolio***----
TEST FIRST / THEN TRADE

Inverse H/S---🤑🤑An inverse head and shoulders, also called a "head and shoulders bottom", is similar to the standard head and shoulders pattern, but inverted: with the head and shoulders top used to predict reversals in downtrends. This pattern is identified when the price action of a security meets the following characteristics: the price falls to a trough and then rises; the price falls below the former trough and then rises again; finally, the price falls again but not as far as the second trough. Once the final trough is made, the price heads upward, toward the resistance found near the top of the previous troughs

JINDAL STEEL AND POWEROut of the cloud with a strong breakout on price and volumes. F&O data shows short covering. Nice RSI and trading above Moving averages.
Target 475 and 505 in medium term.
