LAURUSLABS trade ideas

down trend break out in laurus labs Ltddown trend break out in laurus labs Ltd, in weekly chart clear show that laurus lab ltd share one strong down trend break out. also so that RSI oversold and now RSI Up trend start.

LAURUSLABS: A Bearish trend "
TECHNICAL ANALYSIS OF NSE:LAURUSLABS
The LAST CLOSE PRICE of NSE: LAURUSLABS is 649. The PARABOLIC SAR is showing the SELL SIGNAL with TREND as DOWN TREND . The FIBONACCI LEVELS analysis shows that the CLOSEST FIBONACCI LEVELS is 0.382 at the FIBONACCI STOCK PRICE LEVEL of 649. From here, the Key Support and Resistance levels are SUPPORT 1 at 250.07, SUPPORT 2 at 697.8 with RESISTANCE 1 and RESISTANCE 2 at 637.7 and 623.6 respectively. The Key 50% FIBONACCI LEVEL stands at 637.47 which is the crucial Fibonacci Level determining whether the scrip will maintain the trend or not.
The STOC RSI has the values K and D as 0 and 1.42 respectively. At this level it the status is OVER SOLD. When we look at the Moving Averages, MACD is the crucial indicator to look into. With MACD VALUE at 14.55 and 91.05 at 22.56 along with HISTOGRAM showing values of -8.06, the STATUS is clearly DOWNWARDS.
The best indicator to determine the Trend Reversal is FISHER TRANSFORM and currently the values of FISHER and TRIGGER stand at -1.8 and -1.39 with UPTREND as DOWNTREND. A very important factor while making the investment is to see if there has been already too much of Buying or Selling, and that are we entering too late into the transaction or not. Thus, with WILLIAM's R% value at -0.9293 the STATUS is OVER SOLD.
No one wants to buy costly things, and thus always look for the bargain or appropriate price levels to buy things. Same applies to Stocks, however the only exception would be some Hot Stocks that one wants to have any price. Looking at this perspective, the P/E RATIO of the stock stands at 35.5 which signifies its Price Level to be TOO EXPENSIVE.
>>> RECOMMENDATION is : SELL ."
Disclaimer:
The analysis is only for illustration purposes only. Please consult your financial advisor, agent, broker before acting on any information. We may or may not have positions in the stock and our actions may be contrary to the one mentioned here. This analysis may or may not be updated. We would not be responsible for the profit/loss resulting from this analysis.

Laurus Labs Ltd...after Q1 ResultsLaurus labs had good support at 600..today the support was broken ..so in the coming days we see the stock coming around Rs 560/- which is an good opportunity for accumulation for a long term target of Rs 1000/- The company have excellent expansion plans till FY24-25. With coming results for every quarter as capex gets completed its revenue will go up. Management has told that its EBITA margin will be around 30% because there will be an net off of margins between brown field project and green field projects. So, we might not see expansion in margins in coming quarterly results but revenue increase and net margin expansion can be seen. Management have told that its not going to increase its debt to an high levels (will be in limits). So, any fall from current levels will be an excellent opportunity to accumulate this stock for long term investments.

LAURUSLABS intraday trade idea for 22nd July#LAURUSLABS entry and exit levels on the chart (refer black/blue lines). Place SL@0.4% of the entry price. Zones (in pink/orange) are the places where it's unsafe to enter.


LAURUSLABS : It can be added to the Watch listIt forms a flag pattern after a break. It is worth adding in the watch list and following the 2h time frame.


LAURUS LABS LTD. • Chart Analysis:- On Hourly TF of LAURUS LABS LTD we can see that stock is making a symmetrical triangle which is a bullish signal but as we know market is supreme so patterns may fail . According our analysis stock will fall to our expected targets. We can confirm from 3 Indicators.
o RSI on daily TF is in oversold range which is bearish signal
o On DMI DI- line is above the DI+ line which is also a bearish signal
o On Bollinger bands we can see that the band is stretched and 20 ema is above the candle stick.
Short / Entry point- 679- 676
Short term targets
• 670
• 661
• 648
Disclaimer - I am not sebi registered analyst so do your own research before investing , i can be 100 % wrong.


laurus lab: Hourly chart: Watch out getting tightLaurus lab, getting tight in range, looking for some good move,


Breakout in Laurus Labs...Chart is self explanatory. Entry, Targets and Stop Loss are mentioned on the chart.
Disclaimer: This is for demonstration and educational purpose only.

Target 1 (44%) achieved in Laurus Labs. Target 2 is ON...This is follow-up on Laurus Labs. Can check link to related ideas.
Target 1 achieved. More than 44%. Target 2 is ON.
Chart is self explanatory. Entry, Targets and Trailing Stop Loss are mentioned on the chart.
Disclaimer: This is for demonstration and educational purpose only. This is not buying or selling recommendations. I am not SEBI registered. Please consult your financial advisor before taking any trade.

Target 2 (57%) achieved in Laurus Labs. Target 3 is ON...This is follow-up on Laurus Labs. Can check link to related ideas.
Target 2 achieved. More than 57%. Target 3 is ON.
Chart is self explanatory. Entry, Targets and Trailing Stop Loss are mentioned on the chart.
Disclaimer: This is for demonstration and educational purpose only. This is not buying or selling recommendations. I am not SEBI registered. Please consult your financial advisor before taking any trade.


Laurus Labs: good chance for entryLaurus Labs:
Case for if going downward: If it holds current level of 599 it good entry for 1st part. next part entry at 572, s1 551, s2 529, SL 500
Case for if going upward: If it holds current level of 599 it good entry for 1st part. next part entry at 640, trailing SL 600.

laurus Lab 600 ? with NinjaMoku NinjaMoku is a trend following system and at 546 ........................ 600 ?

Lauruslabs long signalNSE:LAURUSLABS Lauruslab all time high..in daily timeframe and as per elliote wave projection in 15 min today it had 2nd wave that correction and ay tomorrow it start 3rd impulse wave which ll go upto 720-23 ...hope for good...
caution: its only for education purpose tarde with ur own risk.


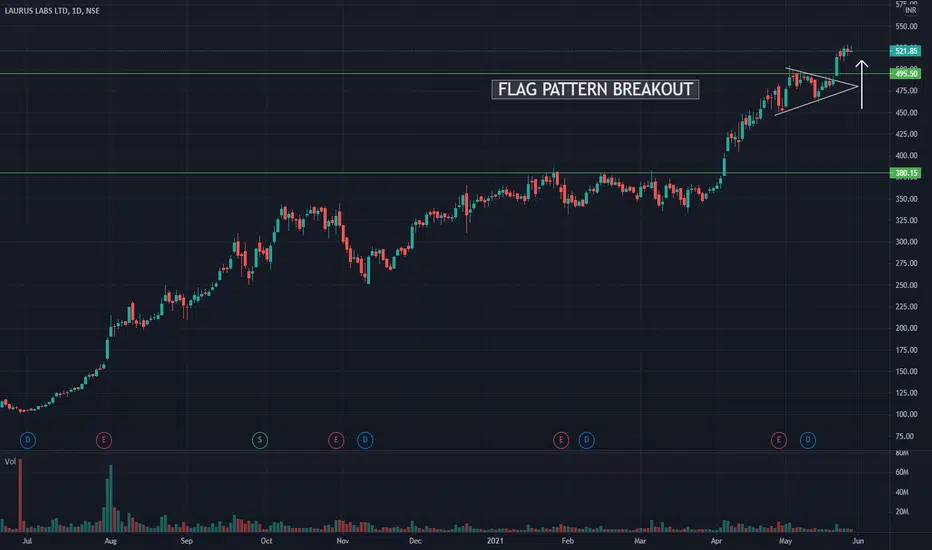
LAURUSLABS - Flag Pattern BreakoutFlag pattern breakout seen in NSE:LAURUSLABS
Fundamentally strong & high growth scrip.
Disclaimer: It's for educational purposes only. This is not a trading idea or any sort of endorsement to buy/sell the said scrip.