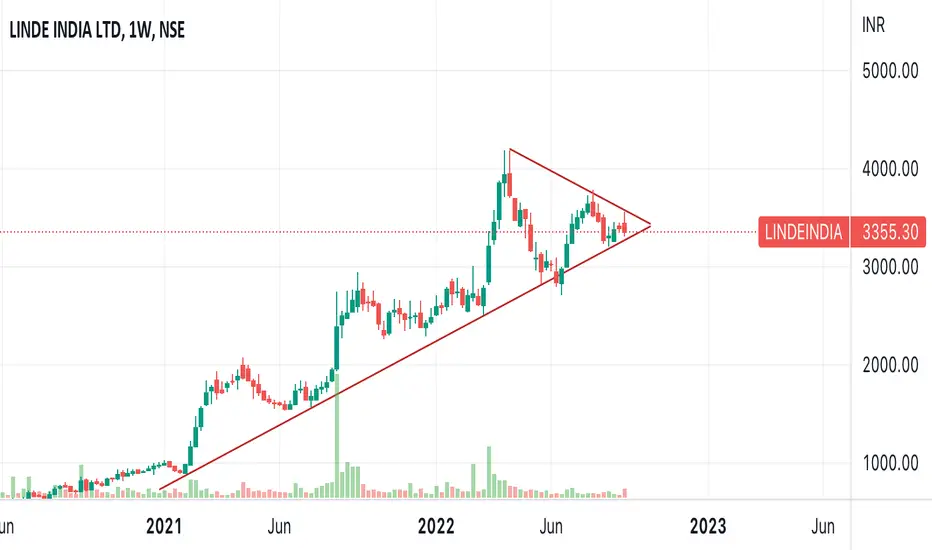
LINDE INDIA Triangle pattern LINDE INDIA formed a potential triangle pattern and consolidating a lot inside .
Draw on your chart and wait for the Daily candle (strong) closing above the pattern
NSE:LINDEINDIA
LINDEINDIA trade ideas


Trendline Support & Symmetrical Triangle. Educational onlyLinde India ia following a Trendline Support since 2 years
and now consolidating in a symmetrical triangle pattern.
Wait for confirmation of Breakout or Breakdown on either side for a move.
Keep on Watchlist.
Linde India is boomingLinde India has retested the box and now ready to booming. !st target is 4170. Do your own analysis before investing...

Linde IndiaLinde India has taken a brilliant a t support at important levels with 200 EMA around the corner. Best to keep it on your watchlist for future trades.

lindeindia is a good buystock has reached a good support............ confluence of 78.6% yelleo line, green trendline and white 50 MA.....

#LINDEINDIA - RT Idea#LINDEINDIA - RT Idea
CMP : 3166.85
Disclaimer : We are not Sebi registered analyst or Authorized analyst
The charts / Levels / Price projections are only for educational purpose.
This is our personal view, Pls consult your financial advisor before taking decision - Buy / Sell
We will be not responsible for your profit and Loss
Please like and retweet if you like this idea.


Buy Today, Sell TomorrowDON'T HAVE TIME TO MANAGE YOUR TRADES?
- Take BTST trades at 3:25 pm everyday
- Book profits within first 30 minutes of the market opening
- Try to exit taking 3-5% profit of each trade
- SL can be taken when 5/15 min candle close below 44EMA
- SL can also be maintained as 1% or closing below the low of breakout candle
Levels mentioned on the chart are calculated using Breakout Indicator
Now why do I prefer BTST over swing trades? The primary reason is that I have observed that 90% of the stocks give most of the movement in just 1-2 days and the rest of the time they either consolidate or fall
Trendline Breakout in LINDEINDIA
Buy Today, Sell Tomorrow: LINDEINDIA


Breakout in Linde India...Chart is self explanatory. Entry, Targets and Stop Loss are mentioned on the chart.
Disclaimer: This is for demonstration and educational purpose only. This is not buying or selling recommendations. I am not SEBI registered. Please consult your financial advisor before taking any trade.

Target 1 achieved in Linde India. Gain of 30% Target 2 is ON.This is follow-up on Linde India. Can check link to related ideas.
Target 1 achieved. Gain of more than 30%. Target 2 is ON.
Chart is self explanatory. Entry, Targets and Trailing Stop Loss are mentioned on the chart.
Disclaimer: This is for demonstration and educational purpose only. This is not buying or selling recommendations. I am not SEBI registered. Please consult your financial advisor before taking any trade.

Momentum play in Linde India1. Momentum play
2. Immediate target 5000
3. Can see consolidation at 5300 - 5500

LINDE INDIA - CHART OF THE MONTHLINDE INDIA , the stock had been in a multibagger in 2021, its been a great story for the stock so far, infact this is the perfect stock to analyze where technical meets fundamental analysis. inspite of heavy FII selling during last 2 months, the stock has shown a limited downside, the stock is ready for the next move. if we put Fibonacci, a perfect combination is found and finally after a good closing in weekly charts, it is ready for the next level. Watch out levels. its an investment stock and targets mentioned in the charts is for 6 to 8 months time horizon.
DISCLAIMER - I AM NOT FINANCIAL ADVISOR, ITS JUST A VIEW AND NOT AN ADVISE.

Breakout trade - LindeIndBreakout trade-LindeInd.
Current stop loss - 2250.
Exit when it closes below previous market structure.


Linde India ltd Creating a Darvas BoxLinde India Limited, a subsidiary of BOC Group, UK (owns 75% stake in the co), is primarily engaged in the manufacture of industrial and medical gases and construction of cryogenic and non-cryogenic air separation plants
Stock is trading at 10.17 times its book value-
Technically it has created a Darvas box and created a 52week high with volume the stock can be considered for short to medium term
trade only after your Due Diligence

Linde india long #vcp cup with handle Linde india long #vcp cup with handle daily and weekly we can see big move up

LINDEINDCMP: 2786
- FIIs have increased their stake in the current FY
- Posted highest ever sales in the last quarter
- Taking support at 20 week ema
- Consolidating in a box near All Time High

Linde India - C&H Ascending Tringle with C&H Pattern, plus Green Hydrogen Theam. Capex in Pipeline. Trend line support.

Linde India Breakout1. Buy or Sell at your own risk
2. Don't risk more than 1%-2% of your capital as stop loss
3. Position Size formula:- Stop Loss/(Buy Price-Initial Stop Loss Price)
4. Sell on initial stop loss hit or close below daily supertrend (for short term traders) or close below weekly supertrend (for long term investors)
After GOI's green H2 policy announcement NSE:LINDEINDIA gave a high-volume breakout after a consolidation of almost 6 months. It's a buy at current price with a stop loss at or below Rs.2645. Quarterly results are due on Feb 24th. One can wait until the results are announced. It's a good opportunity as Linde is a pioneer in Blue Hydrogen plants.

LINDE INDIAThe stock is looking good but the market is in bearish mood so for the risk is high in buy side but if you have risk appetite you can sail on it.

LINDEINDIA - Darvas Box Breakout - Swing TradeThe analysis is done on daily TF hence price may take few days to few weeks in order to reach the targets.
Trade setup is explained in image itself.
Linde India was analysed previously on 05th Jan as well. Checkout the linked idea to understand better
The above analysis is purely for educational purpose. Traders must do their own study & follow risk management before entering into any trade
Checkout my other ideas to understand how one can earn from stock markets with simple trade setups. Feel Free to comment below this or connect with me for any query or suggestion regarding this stock or Price Action Analysis.
