Mishra Dhatu Nigam (D): MASSIVE DUAL BREAKOUTTimeframe: Daily | Scale: Linear
Explosive +13.60% surge today backed by a massive 36.38M volume spike! 🔥
Technical Highlights:
✅ Dual Breakout: Cleared & closed above long-term angular resistance (Feb '24) & short-term horizontal resistance (Jun '26).
✅ Volume Reversal: Increasing accu
Mishra Dhatu Nigam Ltd.
No trades
No trades
Compare with Mishra Dhatu Nigam Ltd.
7.20 INR
1.31 B INR
12.09 B INR
48.71 M
Next report date
—
Report period
—
EPS estimate
—
Revenue estimate
—
Company info
Sector
Industry
CEO
S.V.S. Narayana Murty
Website
Headquarters
Hyderabad
Founded
1973
IPO date
Apr 4, 2018
ISIN
INE099Z01011
FIGI
BBG00GM41QX6
Identifiers
ISIN INE099Z01011
Mishra Dhatu Nigam Ltd. engages in the manufacturing of steel, superalloys and titanium alloys. It also offers special steel, electrical and electronic alloy, molybdenum, special weld consumables, magnesium alloys, titanium tubes, fastners, titanium castings, columbium alloy, biomedical products, armour products, and moly products. The company was founded on November 20, 1973 and is headquartered in Hyderabad, India.
BUY TODAY SELL TOMORROW for 5% DON’T HAVE TIME TO MANAGE YOUR TRADES?
- Take BTST trades at 3:25 pm every day
- Try to exit by taking 4-7% profit of each trade
- SL can also be maintained as closing below the low of the breakout candle
Now, why do I prefer BTST over swing trades? The primary reason is that I have observed that
Buy Today, Sell Tomorrow for 3–5% – Daily Breakout SetupMISHRA DHATU NIGAM LIMITED — BTST BREAKOUT SETUP
Entry, Stop Loss & Targets Are Clearly Defined — Helping You Plan Your Trade With Confidence.
📊 Stock Strength: 100/100
(Note: Higher score indicates stronger stock conditions, not guaranteed returns.)
A bullish breakout has appeared on the 1D time
The Midpoint Nobody Watches: Equilibrium, Flip Zones, PatternsThis post is educational and observational in nature based on historical price action. It is not a forecast or a trading recommendation.
Flip Zone (Green)
A price level that once acted as resistance and, after being broken and sustained above, converted into support. This shift in role is what d
MIDHANI | VCP Pattern unfoldedDISCLAIMER: This is solely an observation and should not be considered a trade recommendation. Please conduct your own analysis before making any trading decisions.
Market Snapshot
- CMP: 375.25
- Pattern: VCP
- Status: Recently broken the strong resistance
- Volume: Recently showing notable increa
MIDHANI IN (Mishra Dhatu Nigam) Long 🌎
The company specializes in the production of specialty metals.
Primary products: nickel-, cobalt-, and iron-based superalloys, titanium alloys, specialty steels, and soft magnetic alloys.
The company's products are of strategic importance and are supplied to the defense, aerospace, and energy se
Mishra Dhatu Nigam Ltd ₹ 444 10.55% 15 Jul 10:06 a.m.Mishra Dhatu Nigam Ltd
₹ 444
9.64%
15 Jul 10:02 a.m.
#chart_sab_kuch_bolta_hai*
If price breaks above Rs 450 . in daily timeframe, then 1st Target is RS 485 Stoploss your own.
DISCLAIMER:
I am not a SEBI-registered advisor. The content shared, including charts, ideas, and analysis, is purely
Midhani: Breaks Out of Consolidation: Ready for Lift-Off ?NSE:MIDHANI Breaks Out of Consolidation: A Technical Powerhouse Ready for Lift-Off ?
Price Action Analysis:
- Current Price: ₹463.60 (as of June 23, 2025)
- Price Movement: +20.30 points (+4.58%) on the day
- The stock has demonstrated a spectacular breakout from a lengthy consolidation phase
-
MIDHANI – Solid Breakout After Long Base | Momentum Ready?MIDHANI – Solid Breakout After Long Base | Momentum Ready?
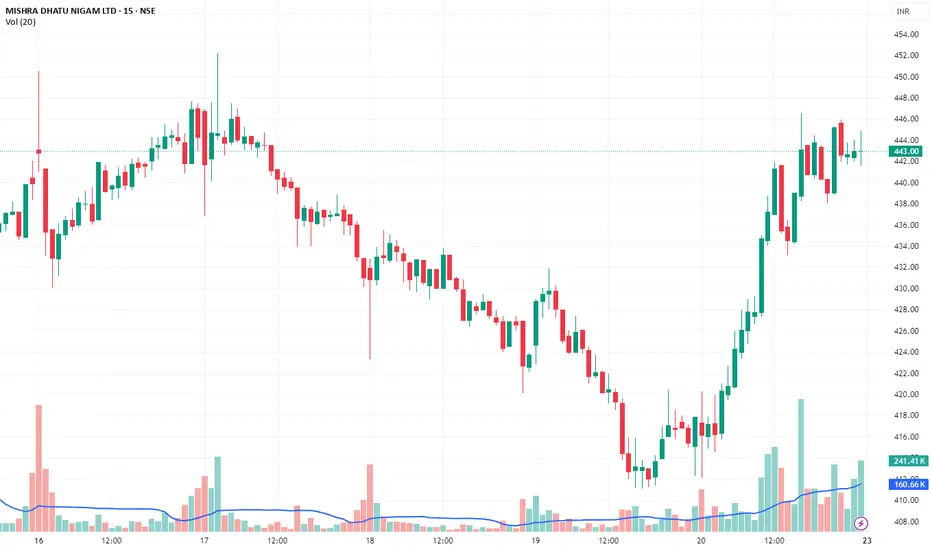
CMP: ₹443.30 | Chart: 5-min | Date: June 22, 2025
🟢 What’s Unfolding?
Stock moved from ~₹420 → ₹446 with strong momentum and clean higher highs
Clear volume spike near ₹1 PM, breaking above the short-term supply zone
Price consolidated in
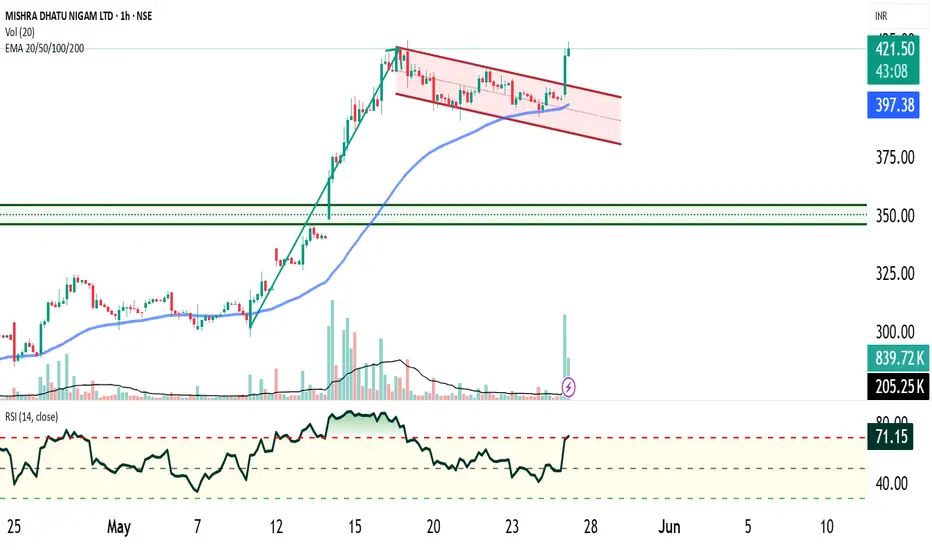
MIDHANI – Bullish Flag Breakout📊 Pattern Analysis
1. Pole Formation:
The initial rally forming the flagpole is marked by high-momentum bullish candles rising at approximately a 60° angle, supported by increasing volume, indicating strong institutional buying and trend conviction.
2. Flag Formation:
Following the pole, the sto
See all ideas
Summarizing what the indicators are suggesting.
Neutral
Neutral
Neutral
An aggregate view of professional's ratings.
Neutral
Neutral
Neutral
Displays a symbol's price movements over previous years to identify recurring trends.
Weight0.53%
Market value712.01 K
Weight0.60%
Market value113.61 K
Weight0.25%
Market value7.34 K
Explore more ETFs
Frequently asked questions
The current price of MIDHANI is 440.25 INR — it has decreased by −0.47% in the past 24 hours. Watch Mishra Dhatu Nigam Ltd. stock price performance more closely on the chart.
Depending on the exchange, the stock ticker may vary. For instance, on BSE exchange Mishra Dhatu Nigam Ltd. stocks are traded under the ticker MIDHANI.
MIDHANI stock has risen by 0.59% compared to the previous week, the month change is a −8.01% fall, over the last year Mishra Dhatu Nigam Ltd. has showed a 14.72% increase.
We've gathered analysts' opinions on Mishra Dhatu Nigam Ltd. future price: according to them, MIDHANI price has a max estimate of 510.00 INR and a min estimate of 475.00 INR. Watch MIDHANI chart and read a more detailed Mishra Dhatu Nigam Ltd. stock forecast: see what analysts think of Mishra Dhatu Nigam Ltd. and suggest that you do with its stocks.
MIDHANI reached its all-time high on Feb 5, 2024 with the price of 547.45 INR, and its all-time low was 86.35 INR and was reached on Apr 4, 2018. View more price dynamics on MIDHANI chart.
See other stocks reaching their highest and lowest prices.
MIDHANI stock is 3.25% volatile and has beta coefficient of 1.14. Track Mishra Dhatu Nigam Ltd. stock price on the chart and check out the list of the most volatile stocks — is Mishra Dhatu Nigam Ltd. there?
Today Mishra Dhatu Nigam Ltd. has the market capitalization of 82.48 B, it has increased by 5.46% over the last week.
Yes, you can track Mishra Dhatu Nigam Ltd. financials in yearly and quarterly reports right on TradingView.
Mishra Dhatu Nigam Ltd. is going to release the next earnings report on Nov 14, 2026. Keep track of upcoming events with our Earnings Calendar.
Mishra Dhatu Nigam Ltd. revenue for the last quarter amounts to 2.40 B INR, despite the estimated figure of 1.88 B INR. In the next quarter, revenue is expected to reach 2.46 B INR.
MIDHANI net income for the last quarter is 164.68 M INR, while the quarter before that showed 778.99 M INR of net income which accounts for 0.00% change. Track more Mishra Dhatu Nigam Ltd. financial stats to get the full picture.
Yes, MIDHANI dividends are paid semi-annually. The last dividend per share was 1.25 INR. As of today, Dividend Yield (TTM)% is 0.48%. Tracking Mishra Dhatu Nigam Ltd. dividends might help you take more informed decisions.
Mishra Dhatu Nigam Ltd. dividend yield was 0.78% in 2025, and payout ratio reached 29.93%. The year before the numbers were 0.28% and 12.68% correspondingly. See high-dividend stocks and find more opportunities for your portfolio.
As of Oct 11, 2026, the company has 866 employees. See our rating of the largest employees — is Mishra Dhatu Nigam Ltd. on this list?
EBITDA measures a company's operating performance, its growth signifies an improvement in the efficiency of a company. Mishra Dhatu Nigam Ltd. EBITDA is 2.40 B INR, and current EBITDA margin is 20.20%. See more stats in Mishra Dhatu Nigam Ltd. financial statements.
Like other stocks, MIDHANI shares are traded on stock exchanges, e.g. Nasdaq, Nyse, Euronext, and the easiest way to buy them is through an online stock broker. To do this, you need to open an account and follow a broker's procedures, then start trading. You can trade Mishra Dhatu Nigam Ltd. stock right from TradingView charts — choose your broker and connect to your account.
Investing in stocks requires a comprehensive research: you should carefully study all the available data, e.g. company's financials, related news, and its technical analysis. So Mishra Dhatu Nigam Ltd. technincal analysis shows the buy rating today, and its 1 week rating is strong buy. Since market conditions are prone to changes, it's worth looking a bit further into the future — according to the 1 month rating Mishra Dhatu Nigam Ltd. stock shows the buy signal. See more of Mishra Dhatu Nigam Ltd. technicals for a more comprehensive analysis.