NMDC BUY CALL FOR SWING TRADERALL LEVEL DISPLAY IN VIDEO
FOLLOW THE RULES GUYS
1. BUY ONLY WHEN STOCK PRICE HIT BUY LEVEL
2.STOP LOSS IS VERY IMPORTENT
3.1ST TARGET HIT BOOK PROFIT WAIT 2ND TARGET CHOICE IS YOURS BUT TRAIL YOUR STOP LOSS
4.IF YOUR CAPITAL IS 1 LAC
YOU ONLY INVEST 5000 TO 8000 IN ONE STOCK
NOT PUT ALL YOUR MONEY IN ONE STOCK
BECAUSE MARKET IS UP AND DOWN NATURE
5.DO NOT TRADE FUTURE, OPTION AND INTRADAY TRADING
6.THINK BIG ONE DAY YOU ARE BIGG BULL IN MARKET
ALL OUR PRIVIOUS CALLS HIT PROFIT
NMDC trade ideas


NMDC Ltd. - Facing strong resistance !!NMDC Ltd.
The stock formed a weak candle right at 100 SMA and at 38.2% FIB Level.
RSI IS IN STRENGTH ZONE
***TRADINGEDGE TIME-TREND INDICATOR IS BEARISH***
***TE BANDS ARE IN RED ZONE***
I belief that the weakness is likely to get extended below 89-90 level. 85.5 is the nearby support followed by 83.
KEEP AN EYE!!
#tradingedge_academy #SMTA_institute
***this is my personal view. Please take advice from your financial advisor before investing.


NMDC Ltd. - Can it sustain it's STRENGTH??NMDC Ltd.
The stock is trading at a support zone and has given a breakout from an inside bar candle pattern formed the day before.
Further momentum to be seen above 87 price levels. Probable resistance in the near term comes at 94.5.
Technical parameters look mildly BULLISH right now.
****TRADINGEDGE TIME-TREND INDICATOR HAS TURNED BULLISH IN DAILY TIMEFRAME***
KEEP AN EYE!!
#tradingedge_academy #SMTA_institute
***this is my personal view. Please take advice from your financial advisor before investing.

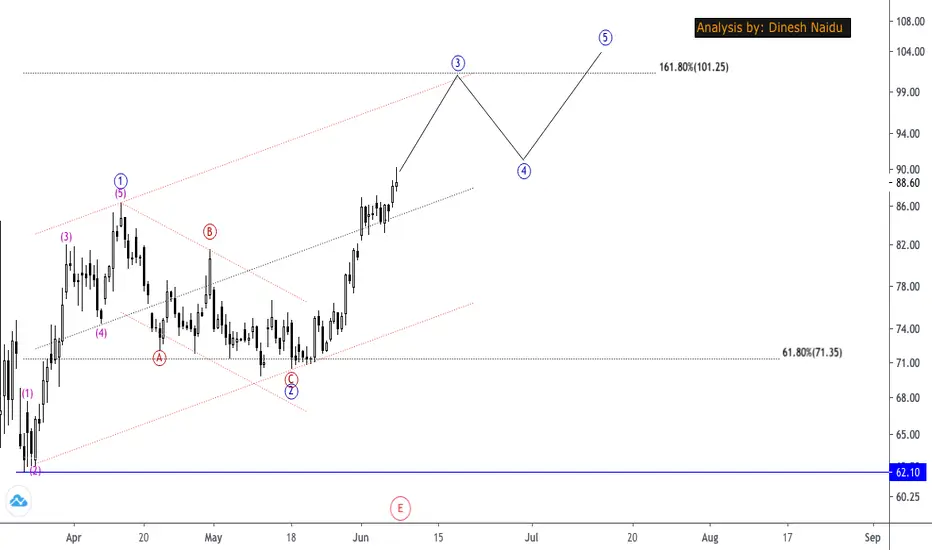
NMDC- Destruction aheadFormation of an impulsive wave having 4th wave already completed. Currently the stock is trading in the 5th wave which is expected to be completed in the zone of 35-34. The idea will be invalidated if the stock sustained above the level of 86 till then it is sell on rise candidate.

NMDC LTD. - BULLISH SIGNS!!NMDC LTD.
The stock has witnessed a breakout from the symmetrical triangle pattern.
It is likely to see further strength in the daily chart above the supply zone high of 82.5 levels.
RSI suggesting strength since it has breached prior RSI resistance. TE TOOL also generated a BULLISH opportunity.
The next resistance in the chart comes at 94 levels (100 SMA). You can consider 50 SMA as immediate support.
KEEP AN EYE !! #B+

NMDC Ltd. - WEEKLY - BEARISHNMDC Ltd.
Trading in a rising channel and likely to see breakdown below swing low of 69.5.
Technical parameters suggest weakness in the stock. BEARISH TREND IN WEEKLY & MONTHLY TIMEFRAME.
On the upside 80-82 zone likely to act as a crucial resistance zone for the stock as of now.
Keep a watch.

NMDC Buy above 80"Flag Continuation" pattern formed followed by bullish "Double Bottom".
Buy above 80 for a quick target of 99.
Stop Loss - 72

Low Risk, High Reward...Easy Target!All points are mentioned in chart, hope it clarify.
Entry: 72.50 - 71.50
SL: >=75
Targets: As per Fib levels
-
Stay Healthy, Stay Safe :)

NMDC Triangle pattern breakoutAs you can see the break out has happened.But waiting for a confirmation would be good.The levels are as marked.

NMDC, Learn & Earn (Support break down)NMDC has broken support line today and ready to continue its fall below 73.5

NMDCNMDC --- ALREADY BROKE THE SUPPORT....SHORT AT OPEN
FOLLOW YOUR RISK MANAGEMENT...
DO YOU OWN ANLAYSIS BEFORE TAKING POSITION


NMDC - Lockdown liftAs all the NMDC mining areas are in Safe zones ( with zero cases ), NMDC will start Operations from 20th.
Considering good support zone from 80 to 78/- Taking a LONG position.
78/- will be my Stoploss

NMDC has triangle pattern NSE:NMDC has triangle pattern and it is nearing towards the 50 ma in daily timeframe

NMDC: Likely heading towards 89 - 93 levelsNMDC
Levels are mentioned in the chart.
Alternatively one may consider the following F&O strategy
Consider selling NMDC 30 April expiry Put option
Strike Price: 80
Lot size: 6000
Recommended selling range: 4.5 - 5 (Closing price 5.2)
Time frame: 30th April 2020
Max profit potential Rs 27000 - Rs 30000 till 30th April 2020
The strategy has inbuilt loss protection for a fall in price in Equity up to 75.5 - 75
Take care & safe trading...!!!
Do hit the Like button and Follow for more trading ideas...

NMDC - Right angled descending broadening patternNMDC - Right angled descending broadening pattern
Buy above 80
T1: 85.50
T2: 88.50
T3: 92.50
SL: 74

NMDCNew Chart>
#NMDC 30Min chart is given breakout in #CupHandle pattern now stock can move towards 85-88-90-94 levels in the next 3-4 days with the help of 77.00 support level on the chart.
#Technicalanalysis
