RELINFRASell below 497 for targets of 487,480,470.Stop loss 511
Buy above 518 for targets of 530,540.Stop loss 507
RELINFRA trade ideas

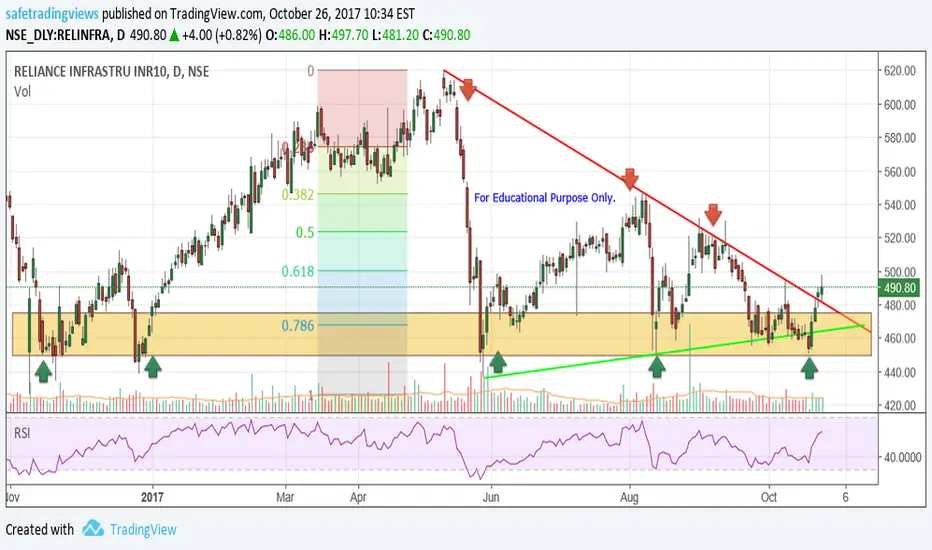
Reliance Infra - Break Out / Bounced From Support.Trend Line Break Out.
Bounced From Support Zone.
Can be accumulate in range of 495-475, For Targets 535/575/615, SL. will be 549 on Closing Basis. Time Frame 3 Months.
Details Mentioned in Chart.
I am not SEBI Registered Financial Advisor.


RELIANCE INFRA @ Support Zone. No momentum in stock. NSE:RELINFRA Now stock trading @ key supprt zone. Watching price action here before entering long trade. As of now no sign of bullish reversal in Daily or Weekly TF. ADX well below 20 level from July. It should go above 25 for momentum. Remaining neutral until that.

RELINFRA BUY setup - For aggressive Bulls onlyBuy RELINFRA at CMP (463+) with strict SL of 445
Targets will be updated soon.

Relinfra at 471. Buy for 492, 518 and 537. SL 451Buy above 475 for Targets of 492, 518 and 537.
SL 451

Reliance Infra - At one year support rangeRelianceinfra has bounced from its one year support range
Go long on above 477
Target 1 - 491
Target 2 - 512
SL - 463

Relinfra Bullish BatReliance Infra bullish BAT
target 1 = 38.2% retracement
target 2 = 61.8% retracement

RELINFRABuy RELINFRA @458 For target of Rs.490. Good time to enter Trade with 20-30Rs profit per stock as per your risk.

RELIANCE INFRA, LONG, TARGET- 510, STOPLOSS-455Share is forming Bullish Engulfing pattern(shown in black box) after Double bottom(shown by blue line). Relative Strength Index is also supporting Price rise(shown by black arrow). Share will cross 510 point.

Equilateral TriangleRelInfra forming Equilateral Triangle on Monthly, change to position of long in the long term


relinfra buy for the target of 580initial hurdle is 545, adx is slowly moving a bove 21 and positive DMI is above he _ve DMI and price is above the 50 day moving average, so many indicators are in confluence lkto support its supmove

Relinfra - Consolidating!Buy above 508.2 with the stoploss of 505. Targets are 513, 518 and 522. Sell below 505 with the stoploss of 508. Targets are 501, 497 and 494.
Follow your trading plan always.

Lets Play! possible Harmonic build seen based on Candle Pattern.Study Only: Possible Harmonic build seen based on Candle Pattern.

Relinfra - bullish1. Its trading in a channel .
2. We have the blue resistance line and fib .382 Ratio in same place and it has broke that .So looking for the target at yellow zone . with a sl - 500

relinfra trading ideaWave c = wave a
Even when nifty is rallying up, this is struggling to cross 625.
The rise was a slow grinding upmove, characteristics of a corrective wave. next should be a down move. Has potential to go below 438 again
sell relinfa @615, stop 630, target 475

RELIANCE INFRAafter a sharp knock
stock is attempting a bounce
bounce might lead the prices towards 531/541/555
with risk management placed around 508

Ascending Triangle on RelinfraAscending Triangle pattern formation on Relinfra on EOD chart and the price will break upside or else if the price break the downside, then it will consider as a false breakout.
Trade:
Buy above - 510.50
Target 1 - 521
Target 2 - 532.50
Stop Loss - 593


