Swan Energy - Naval listingWith reliance naval listing..the stock could see a pump going ahead...
Long above 702..Stoploss below 665.
The stock price could see some momentum going ahead.
SWANENERGY trade ideas

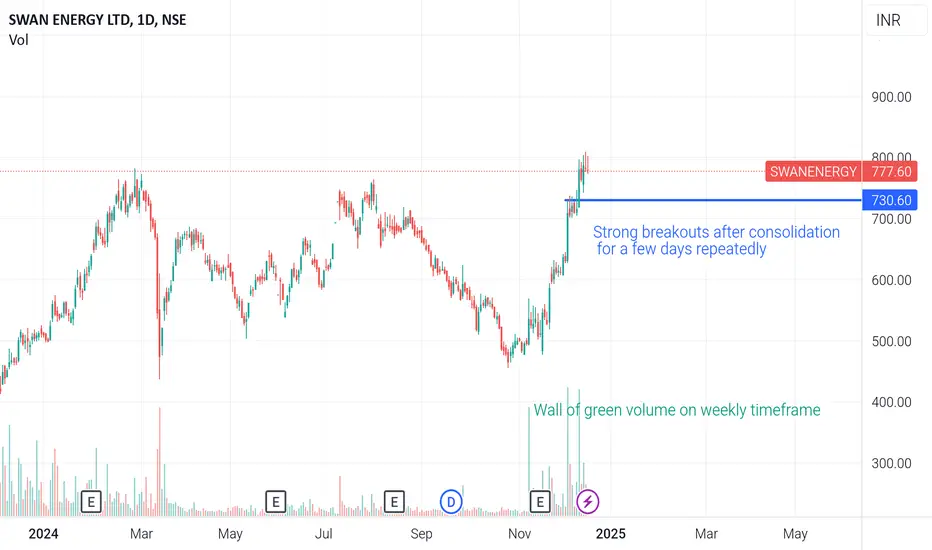
Good risk reward trade in Swan Energy
Stock came out of downtrend with strong volume ( wall of green on weekly TF)
Repeatedly flag like structure on daily timeframe.
In all time high ground.
Stock can be entered with SL of 730(wait for end of day closing for stoploss)
With SL of around 6%, it presents a good trade with high probability of up move.
Disclaimer : This is not a recommendation. Do your own research before taking position.
Swan Energy Ltd view for Intraday 17th Dec #SWANENERGY
Swan Energy Ltd view for Intraday 17th Dec #SWANENERGY
Resistance 790 Watching above 792 for upside movement...
Support area 760 Below 780 ignoring upside momentum for intraday
Support 760 Watching below 758 or downside movement...
Resistance area 790
Above 770 ignoring downside move for intraday
Charts for Educational purposes only.
Please follow strict stop loss and risk reward if you follow the level.
Thanks,

Time Analysis - Elliott Wave combinationSWAN ENERGY LTD is in impulse now.
In the daily chart of SWAN ENERGY LTD, Flat Correction is getting over and the price is entering in impulse now. This can be said if we combine Time analysis with Elliott wave counting.
The detailed counting of this Flat Correction can be seen in the chart above.
The 0-B trendline is broken in half time of wave C time.
(We can see wave C took 59 bars to form and after that, the price breaks above the 0-B trendline in just 30 bars)
According to the rule, the Flat Correction is over and the price is in impulse now.
The price will go to 127% for sure here, which gives us a price level of 875.45.
This analysis is based on Elliott Wave theory and Fibonacci with time analysis.
This analysis is for educational purposes only.

SWANENERGYSWANENERGY has given trendline breakout with increased market participation and raised above all previous high. Seems too bullish on long term charts as well both Weekly and monthly. Keep it on radar.

SWANENERGY Weekly Chart Analysis – Potential Breakout Ahead?1.Trend Overview:
The stock has been in a strong uptrend, reclaiming its previous highs. Currently trading near 731.95 INR, the price action suggests bullish momentum, with potential for a breakout above 750 INR, its key resistance level.
2.Key Levels:
Resistance: 750 INR – A decisive breakout above this level could lead to new highs.
Support: 600 INR – The stock previously rebounded strongly from this level, making it a reliable support zone.
3.Volume Analysis:
Recent weeks have shown high trading volumes, signaling strong buyer interest. A continued rise in price with similar volumes could further confirm bullish sentiment.
4.Trading Strategy:
For Bulls: Watch for a breakout above 750 INR with strong volumes for an entry signal.
For Dip Buyers: Consider entering near the 600 INR support zone if the stock retraces.
Use a stop-loss below 600 INR for risk management.
5.Caution:
The stock has displayed high volatility, so position sizing and strict stop-loss placement are crucial.

Amazing breakout on Weekly Timeframe - SWANENERGYCheckout an amazing breakout happened in the stock in Weekly timeframe, macroscopically seen in Daily timeframe. Having a great favor that the stock might be bullish expecting a staggering returns of minimum 25% TGT. IMPORTANT BREAKOUT LEVELS ARE ALWAYS RESPECTED!
NOTE for learners: Place the breakout levels as per the chart shared and track it yourself to get amazed!!
#No complicated chart patterns
#No big big indicators
#No Excel sheet or number magics
TRADE IDEA: WAIT FOR THE STOCK TO BREAKOUT IN LOWER TIMEFRAME AND RETRACE IF NEEDED. SL IS NEARER SUPPORT ZONE IN Daily TIMEFRAME.
Checkout an amazing breakout happened in the stock in Weekly timeframe.
Breakouts happening in longer timeframe is way more powerful than the breakouts seen in Daily timeframe. You can blindly invest once the weekly candle closes above the breakout line and stay invested forever. Also these stocks breakouts are lifelong predictions, it means technically these breakouts happen giving more returns in the longer runs. Hence, even when the scrip makes a loss of 10% / 20% / 30% / 50%, the stock will regain and turn around. Once they again enter the same breakout level, they will flyyyyyyyyyyyy like a ROCKET if held in the portfolio in the longer run.
Time makes money, GREEDY & EGO will not make money.
Also, magically these breakouts tend to prove that the companies turn around and fundamentally becoming strong. Also the magic happens when more diversification is done in various sectors under various scripts with equal money invested in each N500 scripts.
The real deal is when to purchase and where to purchase the stock. That is where Breakout study comes into play.
LET'S PUMP IN SOME MONEY AND REVOLUTIONIZE THE NATION'S ECONOMY!

Swing trade in SwanChart -> Swan Energy Daily
Swing trade!
CMP: 586
Good range to buy: 540 to 580
Targets: 650, 708, 758
SL: 518 Daily Close
Disclaimer: This is for educational purposes only, not any recommendations to buy or sell. As I am not SEBI registered, please consult your financial advisor before taking any action.


2 Breakout trades for 25 Nov Markets I make educational content videos for swing / positional trading

4 Stocks for 19 November Markets | Swing Trading I make educational content videos for swing / positional trading

swan energyswan energy is in revrsal mode. next green candle above 600 will give confirmation.bearish below 570 .RSI reversal at 30. No buy or sell recommendation.


Swan Energy LtdDate : 15.09.2024
Swan Energy
Timeframe : Day chart
Q : What does Swan Energy do?
Ans : Its segments include Textile, Energy, Construction/Others, Distribution & Development, Warehousing, Manufacturing and Power Generation. Its Business Verticals include Oil & Gas, Petrochemical Manufacturing & Trading, Textiles and Realty.
Remarks :
1 At the support of Rsi + Ascending triangle base + 200 ema confluence
2 If breaks all then short or weak don't try to catch falling knife
3 Chance of bounce are high then going weak since soo many technical support still there's nothing like 100% theory therefore it important to trail stoploss on long/s if any sudden reversal happens
Regards,
Ankur

Swan energy - Breakout viewSwan Energy :
Resistance breakout possibility
Closing above 770 is crucial for good breakout

BLACKROCK has entered this stock.World's largest asset management company, BLACKROCK has entered this stock. NSE:SWANENERGY is a player in shipbuilding sector. Stock has been forming higher lows and now getting ready for a breakout. Target - 1000+ should be there soon.


[Swing Trade] SWANENERGYSWANENERGY - BO done, Volume buildup done, Retracement done... ready to fly!
DYOR before you buy. This is nt buy reco

Swan Energy - Breakout Soon#swanenergy #Swingtrade #breakouttrade #patterntrading #Symmetricaltrianglepattern
Swan Energy (swing trade)
>> Breakout candidate
>> Symmetrical Triangle pattern
>> Risk Reward favorable
>> Good strength in stock
Swing Traders can lock 10% profit & keep trailing
Please give a Boost or comment if u r Liking the analysis & Learning from it. Keep showing ur Love by following
Disclaimer : This is not a Trade Recommendations & Charts/ stocks Mentioned are for Learning/Educational Purpose. Do your Own Analysis before Taking positions.

SWAN EnergyLooks good positional .. Once brks highlighted area yellow lines should be touched.
Trade light as no SL and add on dip approach.

Buy Swan Energy Limited Short Term Trading Advice by Goodluck Capital
Buy Swan Energy Limited (NSE:SWANENERGY)
Buy Range- 720 - 740
Target- 810 - 820
StopLoss- below 685
Potential Return- 11-12%
Approx trade duration 16 - 18 days

Swan Energy : Flag Pole BreakoutSwan Energy :
Flag Pole Breakout
Long above 715 with Support at 695 and 680

