Swan Energy - Naval listingWith reliance naval listing..the stock could see a pump going ahead...
Long above 702..Stoploss below 665.
The stock price could see some momentum going ahead.
25.50 INR
3.01 B INR
49.82 B INR
131.96 M
About SWAN ENERGY LTD
Sector
Industry
CEO
Nikhil Vasantlal Merchant
Website
Headquarters
Mumbai
Founded
1909
ISIN
INE665A01038
FIGI
BBG000D0RDV2
Swan Energy Ltd. engages in the development of real estate properties. It operates through the following segments: Textiles, Property Development, and Others. The company was founded on February 22 ,1909 and is headquartered in Mumbai, India.

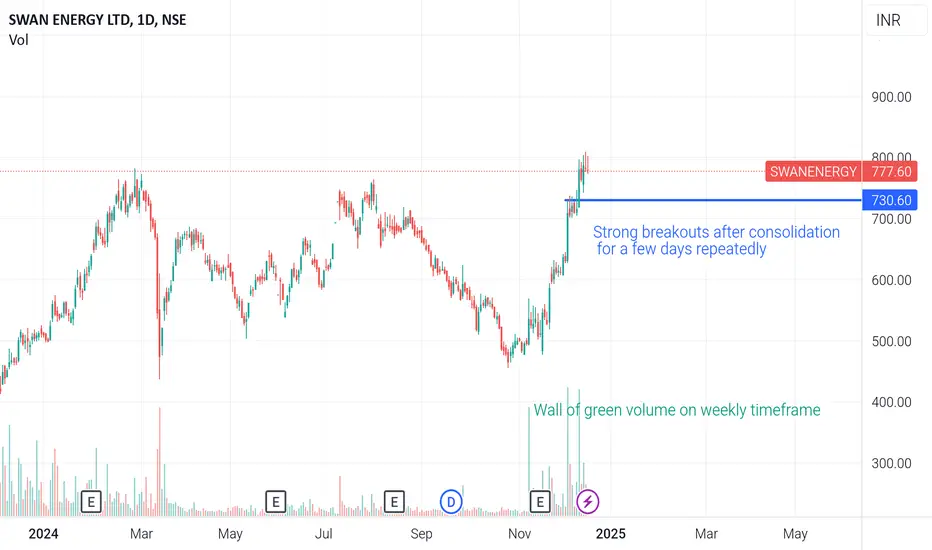
Good risk reward trade in Swan Energy
Stock came out of downtrend with strong volume ( wall of green on weekly TF)
Repeatedly flag like structure on daily timeframe.
In all time high ground.
Stock can be entered with SL of 730(wait for end of day closing for stoploss)
With SL of around 6%, it presents a good trade with high prob
Swan Energy Ltd view for Intraday 17th Dec #SWANENERGY
Swan Energy Ltd view for Intraday 17th Dec #SWANENERGY
Resistance 790 Watching above 792 for upside movement...
Support area 760 Below 780 ignoring upside momentum for intraday
Support 760 Watching below 758 or downside movement...
Resistance area 790
Above 770 ignoring downside move for intraday
C

Time Analysis - Elliott Wave combinationSWAN ENERGY LTD is in impulse now.
In the daily chart of SWAN ENERGY LTD, Flat Correction is getting over and the price is entering in impulse now. This can be said if we combine Time analysis with Elliott wave counting.
The detailed counting of this Flat Correction can be seen in the chart above.

SWANENERGYSWANENERGY has given trendline breakout with increased market participation and raised above all previous high. Seems too bullish on long term charts as well both Weekly and monthly. Keep it on radar.

SWANENERGY Weekly Chart Analysis – Potential Breakout Ahead?1.Trend Overview:
The stock has been in a strong uptrend, reclaiming its previous highs. Currently trading near 731.95 INR, the price action suggests bullish momentum, with potential for a breakout above 750 INR, its key resistance level.
2.Key Levels:
Resistance: 750 INR – A decisive breakout abov

Amazing breakout on Weekly Timeframe - SWANENERGYCheckout an amazing breakout happened in the stock in Weekly timeframe, macroscopically seen in Daily timeframe. Having a great favor that the stock might be bullish expecting a staggering returns of minimum 25% TGT. IMPORTANT BREAKOUT LEVELS ARE ALWAYS RESPECTED!
NOTE for learners: Place the break

Swing trade in SwanChart -> Swan Energy Daily
Swing trade!
CMP: 586
Good range to buy: 540 to 580
Targets: 650, 708, 758
SL: 518 Daily Close
Disclaimer: This is for educational purposes only, not any recommendations to buy or sell. As I am not SEBI registered, please consult your financial advisor before taking an


2 Breakout trades for 25 Nov Markets I make educational content videos for swing / positional trading

See all ideas
Summarizing what the indicators are suggesting.
Oscillators
Neutral
SellBuy
Strong sellStrong buy
Strong sellSellNeutralBuyStrong buy
Oscillators
Neutral
SellBuy
Strong sellStrong buy
Strong sellSellNeutralBuyStrong buy
Summary
Neutral
SellBuy
Strong sellStrong buy
Strong sellSellNeutralBuyStrong buy
Summary
Neutral
SellBuy
Strong sellStrong buy
Strong sellSellNeutralBuyStrong buy
Summary
Neutral
SellBuy
Strong sellStrong buy
Strong sellSellNeutralBuyStrong buy
Moving Averages
Neutral
SellBuy
Strong sellStrong buy
Strong sellSellNeutralBuyStrong buy
Moving Averages
Neutral
SellBuy
Strong sellStrong buy
Strong sellSellNeutralBuyStrong buy
Displays a symbol's price movements over previous years to identify recurring trends.
Frequently Asked Questions
The current price of SWANENERGY is 407.65 INR — it has decreased by −0.09% in the past 24 hours. Watch SWAN ENERGY LTD stock price performance more closely on the chart.
Depending on the exchange, the stock ticker may vary. For instance, on NSE exchange SWAN ENERGY LTD stocks are traded under the ticker SWANENERGY.
SWANENERGY stock has fallen by −4.09% compared to the previous week, the month change is a −26.06% fall, over the last year SWAN ENERGY LTD has showed a −45.28% decrease.
SWANENERGY reached its all-time high on Dec 16, 2024 with the price of 809.80 INR, and its all-time low was 49.50 INR and was reached on Sep 6, 2013. View more price dynamics on SWANENERGY chart.
See other stocks reaching their highest and lowest prices.
See other stocks reaching their highest and lowest prices.
SWANENERGY stock is 8.15% volatile and has beta coefficient of 2.44. Track SWAN ENERGY LTD stock price on the chart and check out the list of the most volatile stocks — is SWAN ENERGY LTD there?
Today SWAN ENERGY LTD has the market capitalization of 127.83 B, it has decreased by −5.02% over the last week.
Yes, you can track SWAN ENERGY LTD financials in yearly and quarterly reports right on TradingView.
SWANENERGY net income for the last quarter is 5.83 B INR, while the quarter before that showed 512.78 M INR of net income which accounts for 1.04 K% change. Track more SWAN ENERGY LTD financial stats to get the full picture.
Yes, SWANENERGY dividends are paid annually. The last dividend per share was 0.10 INR. As of today, Dividend Yield (TTM)% is 0.02%. Tracking SWAN ENERGY LTD dividends might help you take more informed decisions.
As of Mar 4, 2025, the company has 435.00 employees. See our rating of the largest employees — is SWAN ENERGY LTD on this list?
EBITDA measures a company's operating performance, its growth signifies an improvement in the efficiency of a company. SWAN ENERGY LTD EBITDA is −377.33 M INR, and current EBITDA margin is 16.75%. See more stats in SWAN ENERGY LTD financial statements.
Like other stocks, SWANENERGY shares are traded on stock exchanges, e.g. Nasdaq, Nyse, Euronext, and the easiest way to buy them is through an online stock broker. To do this, you need to open an account and follow a broker's procedures, then start trading. You can trade SWAN ENERGY LTD stock right from TradingView charts — choose your broker and connect to your account.
Investing in stocks requires a comprehensive research: you should carefully study all the available data, e.g. company's financials, related news, and its technical analysis. So SWAN ENERGY LTD technincal analysis shows the sell today, and its 1 week rating is sell. Since market conditions are prone to changes, it's worth looking a bit further into the future — according to the 1 month rating SWAN ENERGY LTD stock shows the neutral signal. See more of SWAN ENERGY LTD technicals for a more comprehensive analysis.
If you're still not sure, try looking for inspiration in our curated watchlists.
If you're still not sure, try looking for inspiration in our curated watchlists.