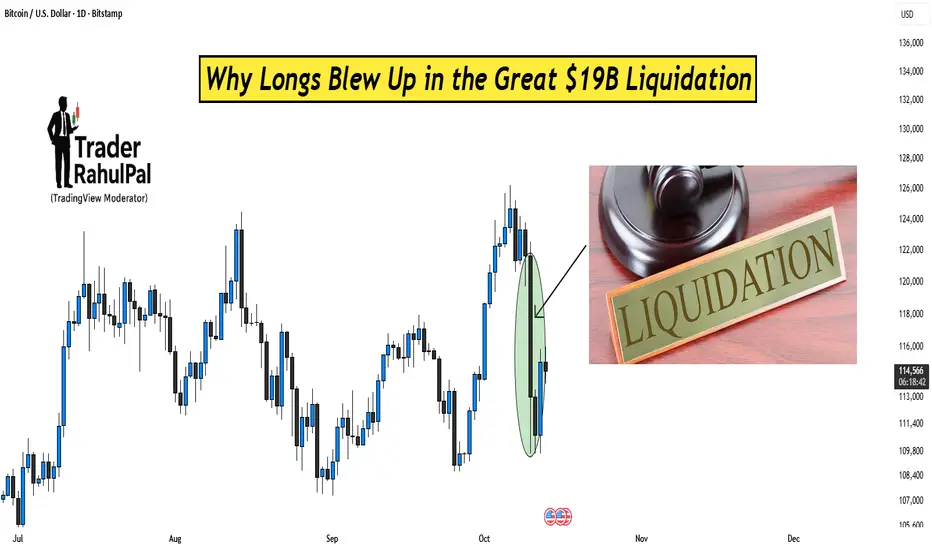
Why Longs Blew Up in the Great $19B Liquidation?Hello Traders!
Recently, crypto markets witnessed one of the biggest shakeouts in history, a $19 billion liquidation that wiped out long traders across Bitcoin, Ethereum, and altcoins in just a few hours.
Everyone called it a “crash,” but what really happened was a classic case of leverage, greed, and poor risk management colliding. Let’s break down the truth behind it.
1. Excessive Leverage Builds the Trap
During bullish phases, traders pile into long positions with 25x, 50x, or even 100x leverage.
The higher the leverage, the smaller the move needed to wipe you out.
Even a 1–2% drop in price can liquidate millions worth of positions instantly.
When too many traders are leveraged in the same direction, the market becomes top-heavy and unstable.
2. Liquidity Hunt – The Smart Money Move
Big players know where the retail stop losses and liquidation points sit, usually below obvious support levels.
They push price just far enough to trigger those liquidations.
Once the forced selling begins, it cascades, creating a chain reaction that accelerates the fall.
It’s not manipulation; it’s how liquidity flows work in leveraged markets.
3. The Domino Effect of Liquidations
When one big position gets liquidated, it triggers auto-sell orders.
Those sells push prices lower, causing more positions to get liquidated.
In minutes, you see billions vanish as exchanges auto-close overleveraged longs.
That’s exactly what created the $19B wipeout, a domino collapse fueled by forced exits.
4. How to Avoid Becoming the Next Victim
Use leverage only if you can handle losing that position completely.
Keep your stop loss and margin buffer wide enough to survive small swings.
Never risk more than 1–2% of your account on a single trade.
And most importantly, don’t chase FOMO entries near resistance levels.
Rahul’s Tip:
Leverage isn’t evil, greed is .
The same tool that builds accounts can destroy them if used recklessly.
In crypto, survival is the real skill, because only survivors get the next bull run.
Conclusion:
The Great $19B liquidation was not random, it was the market teaching a painful lesson about leverage and discipline.
If you want to last long in this game, learn to respect risk before chasing reward.
If this post helped you understand what really happened, like it, share your view in comments, and follow for more realistic market breakdowns!
Trade ideas
Bitcoin updated levels given on chart, stay postion limitedBitcoin updated levels given on chart
Buy on dip buy quantity less volitility will be continued
How My Harmonic pattern projection Indicator work is explained below :
Recent High or Low :
D-0% is our recent low or high
Profit booking zone ( Early / Risky entry) : D 13.2% -D 16.1 % is
range if break them profit booking start on uptrend or downtrend but only profit booking, trend not changed
SL reversal zone (Safe entry ) : SL 23.1% and SL 25.5% is reversal zone if break then trend reverse and we can take reverse trade
Target : T1, T2, T3, T4 and .
Are our Target zone
Any Upside or downside level will activate only if break 1st level then 2nd will be active if break 2nd then 3rd will be active.
Total we have 7 important level which are support and resistance area
Until , 16% not break uptrend will continue if break then profit booking will start.
If break 25% then fresh downtrend will start then T1, T2,T3 will activate
1,3,5,10,15,20 minutes are short term levels.
30 minutes 60 minutes , 2 hours,3 hours, ... 1 day and 1 week chart positional and long term levels
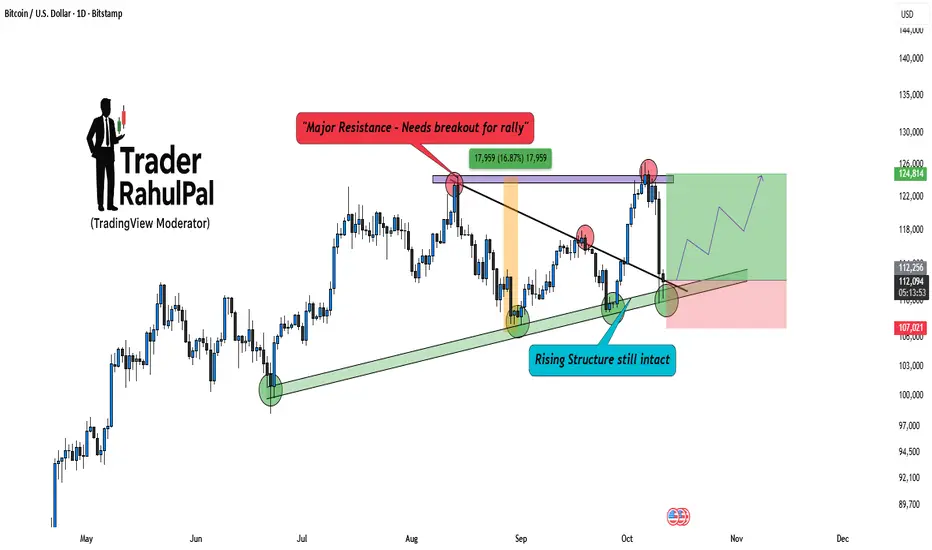
Bitcoin – Rising Structure Still Intact, Bulls Aren’t Done YetBitcoin (BTCUSD) continues to respect its rising structure , even after a sharp pullback from the resistance zone near 125K. While short-term traders might see this as weakness, price action tells a different story, the overall structure is still intact and favors the bulls.
Notice how BTC once again bounced from the ascending trendline support, confirming that institutional buyers are still active around these zones. The recent rejection was from a well-defined major resistance area , but as long as Bitcoin holds above the rising support band, the bias remains positive.
A breakout above 125K will open the doors for another impulsive leg toward 130K+ levels . On the downside, any sustained drop below 107K could temporarily shift momentum, but so far, there’s no structural damage visible.
Analysis By @TraderRahulPal (TradingView Moderator)
If this structure analysis helped you, like and follow for more insights on BTC’s long-term cycles.
Disclaimer: This analysis is for educational purposes only and should not be taken as financial advice. Please do your own research or consult your financial advisor before investing.
simple structureBitcoin showing bullish strength — price holding above support with increasing volume and RSI breakout. Targeting next resistance zone for continued upside momentum. 💎
Bitcoin Bybit chart analysis October 2Hello
It's a Bitcoin Guide.
If you "follow"
You can receive real-time movement paths and comment notifications on major sections.
If my analysis was helpful,
Please click the booster button at the bottom.
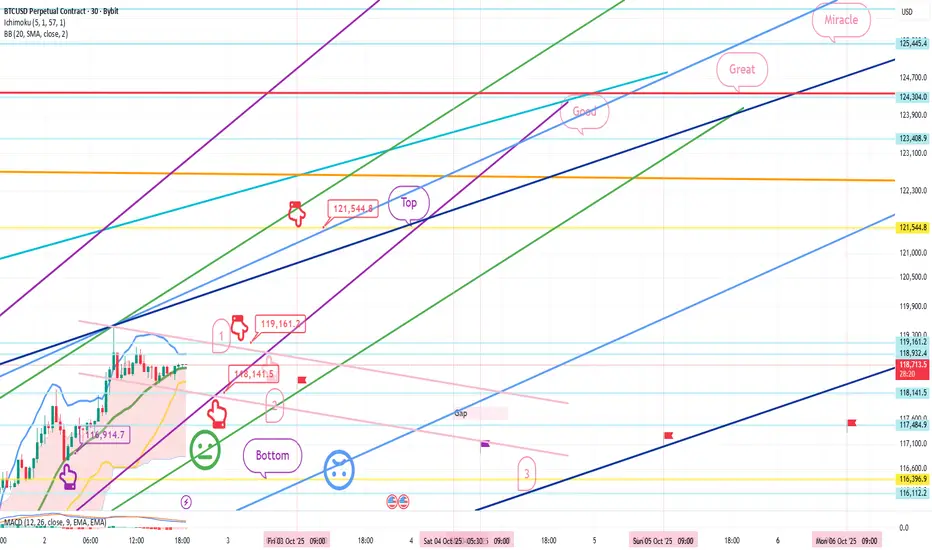
This is a 30-minute Bitcoin chart.
The bottom left shows yesterday's long position re-entry point, $116,914.7, indicated by a purple finger.
We will continue with the trend-following strategy.
*Red finger movement path:
Long position strategy
1. $118,668.2 long position entry point / Stop loss price if the green support line is broken
2. $119,161.2 long position primary target -> Target prices in order from the top to the miracle level
If the strategy is successful, the first section is the long position re-entry point,
and a new high is reached after the great breakout.
The second section is the final long position entry point.
If the green support line is maintained until the second section,
it will become an upward sideways market.
If the light blue support line holds through the weekend and next week,
it could continue to rise as it's a mid-term uptrend line.
Please keep this in mind.
Bottom -> I've left up to three sections.
You can check the prices of the major support and resistance lines above and below the section I've left or by dragging.
Please use my analysis as a reference only.
I hope you operate safely, with a principled trading strategy and stop-loss orders in place.
Have a nice holiday until next Friday.
I'll be back on Friday.
Thank you.
Part 2 Intraday Master ClassThere are two main types of options — Call Options and Put Options.
a) Call Option
A Call Option gives the buyer the right (but not the obligation) to buy the underlying asset at a specified price (strike price) before the expiration date.
Buyers of call options are bullish — they expect the price of the asset to rise.
Sellers of call options are bearish or neutral — they believe the price will stay below the strike price.
b) Put Option
A Put Option gives the buyer the right to sell the underlying asset at a specific strike price before the expiration date.
Buyers of put options are bearish — they expect the price of the asset to fall.
Sellers of put options are bullish or neutral — they believe the price will stay above the strike price.

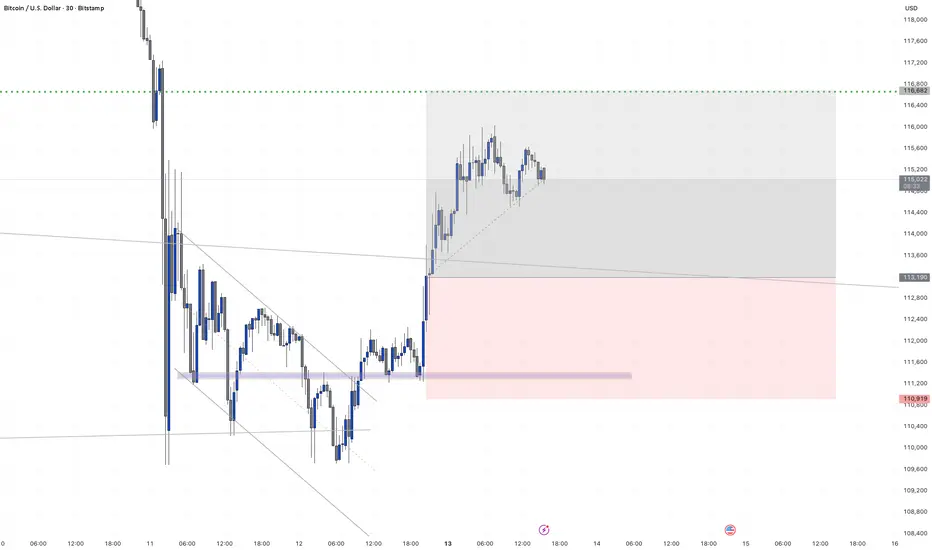
BTCUSD RAINING BLO*D🩸 BTC slapped our sell-limit like it owed it money 💀 The setup looked clean — until the bulls said “Not today.” We’re running in drawdown, but structure still holds hope ⚔️
📉 Current View:
BTCUSD 1H — Price rejected around 115.9K–116.8K liquidity zone after a market structure shift (MSS) at 113.0K. Structure remains bearish unless daily closes above 116.8K.
📊 Key Levels:
🔴 Resistance/Sell Zone: 115.8K–116.8K (OB / liquidity)
⚫ Structure Break: 113.0K → below = continuation
🟢 Buy Re-entry/Demand Zones: 112.4K–111.7K | 109.8K–108.9K (golden pocket)
🧠 Trading Plan:
• Bearish bias holds while below 116.8K → Target 113.0K then 109.8K
• Bullish flip only if daily candle closes above 117K → Next target 119.5K–121.2K
📰 BTC Update:
ETF inflows slow mid-October; CPI data due this week could spark volatility. Derivatives funding rates mildly positive — short-term long bias possible, but liquidity still favors downside traps.
💬 Trader’s Humor: “Sell-limit triggered, stop-loss flirting, and patience getting margin-called — just another day in crypto.” 😂
#BTCUSD #BitcoinAnalysis #CryptoTraders #SmartMoneyConcepts #PriceAction #ForexCommunity #CryptoSetup #TradingLife #TraderHumor #BitcoinForecast #CryptoAnalysis #LiquidityHunt #PriceActionTrading #CryptoCommunity #BTCSetup #ForexAndCrypto #alphatechfinances

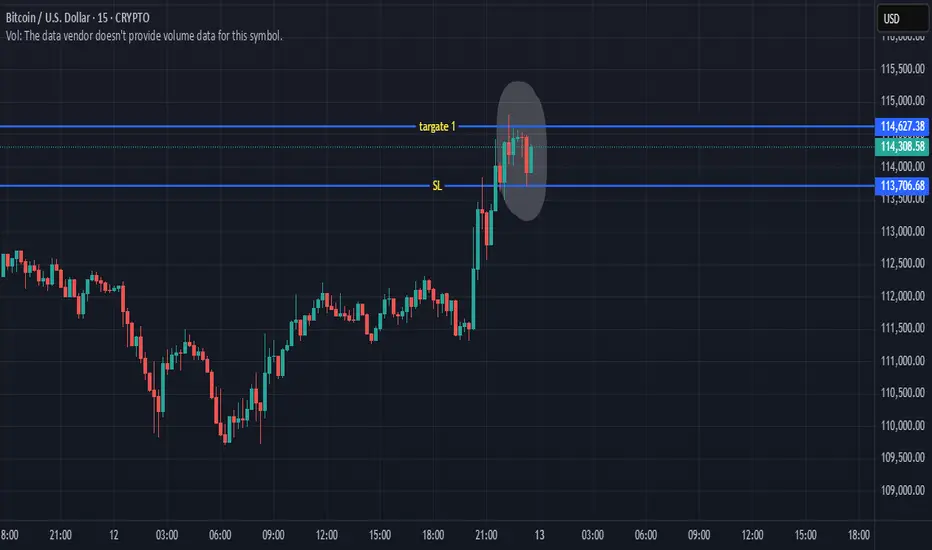
BTC is now creating a IOB and reach easyly TARGATE 1trade wisely this is not a tradeing advice
if it helps do like and contact
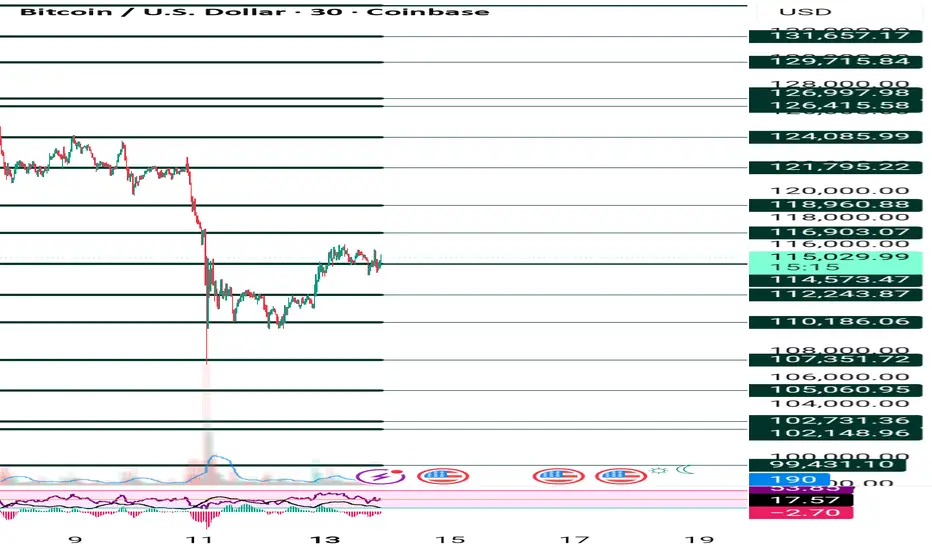
Bitcoin Faces Sudden Shakeout After Weeks of CalmBitcoin Volatility Returns as Market Momentum Resets
Hello Traders,
The Bitcoin market experienced a sudden burst of volatility in the recent session, ending a period of relative calm. On the 4H timeframe (Binance), intense selling pressure drove prices from near $117,000 down to roughly $109,000 before stabilizing around the $112K region. The swift decline marked a clear shift in short-term momentum, showing that buyers are beginning to lose dominance as broader market sentiment cools.
This pullback unfolded against a backdrop of renewed global uncertainty. A series of trade-related policy headlines reignited risk aversion, while continued strength in the U.S. dollar added additional stress to crypto markets. Institutional flows briefly reversed, signaling reduced confidence in near-term upside potential. The result was a wave of forced liquidations, magnified by leverage, as traders rushed to adjust exposure during the drop.
Despite the intensity of the move, market conditions remain structurally healthy. On-chain data shows that long-term holders are largely unmoved, suggesting this phase is more of a short-term repricing than a major cycle reversal. Derivative markets, however, have cooled significantly — open interest has thinned, and funding rates have normalized, indicating a temporary reset in speculative participation.
In the coming days, Bitcoin’s behavior will likely depend on liquidity dynamics rather than new macro data. With upcoming U.S. economic reports delayed and the dollar holding firm, volatility may persist as traders respond to headlines and reposition ahead of the next policy developments.
For now, the market appears to be in a state of balance after rapid liquidation. Whether this forms a new accumulation base or precedes deeper correction will depend on how quickly momentum returns. The broader sentiment remains cautious but stable — a waiting phase, as the market tests its conviction once more.
BTC approaching a sell side OBBTC is approaching a sell side OB+FVG.
There is also liquidity along the way too.
If market sweeps liquidity and taps on FVG we could see a bearish move.
If market break above this OB then expect a sweet upside momentum.
Thanks...

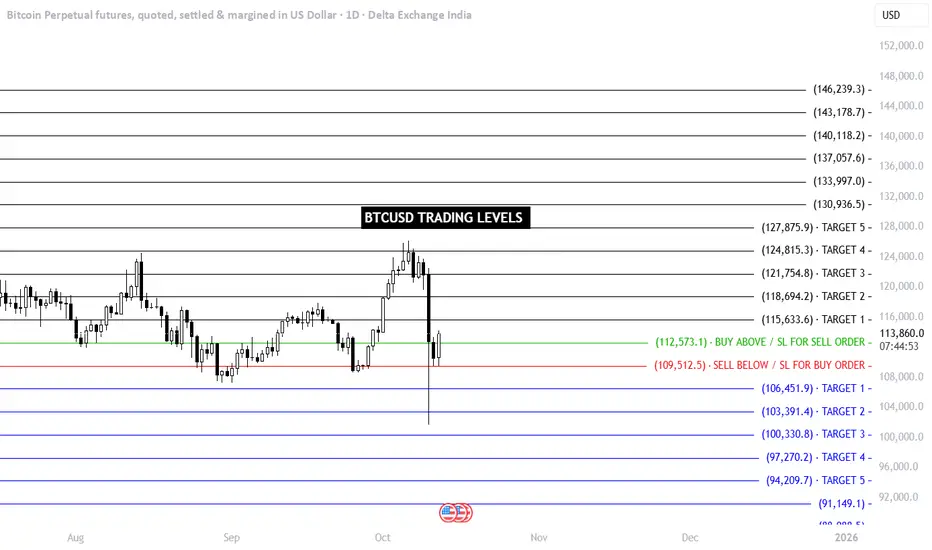
BTCUSD TRADING LEVELS. BTCUSD TRADING LEVELS. Anyone can Trade on both sides (as per levels)
Levels shared on chart
Bitcoin updated levels for next week until 115000 not break sellUntil 115000 not break Bitcoin will be sell on rise updated levels for next week given on chart
How My Harmonic pattern projection Indicator work is explained below :
Recent High or Low :
D-0% is our recent low or high
Profit booking zone ( Early / Risky entry) : D 13.2% -D 16.1 % is
range if break them profit booking start on uptrend or downtrend but only profit booking, trend not changed
SL reversal zone (Safe entry ) : SL 23.1% and SL 25.5% is reversal zone if break then trend reverse and we can take reverse trade
Target : T1, T2, T3, T4 and .
Are our Target zone
Any Upside or downside level will activate only if break 1st level then 2nd will be active if break 2nd then 3rd will be active.
Total we have 7 important level which are support and resistance area
Until , 16% not break uptrend will continue if break then profit booking will start.
If break 25% then fresh downtrend will start then T1, T2,T3 will activate
1,3,5,10,15,20 minutes are short term levels.
30 minutes 60 minutes , 2 hours,3 hours, ... 1 day and 1 week chart positional and long term levels

BTCUSDHello friends, I hope you're all doing well! Friends, if you've chosen the right time cycle, remember that the market always respects the time cycle candles, and this doesn't happen just once, but repeatedly throughout most chart cycles. You can see how BTC also respected the time cycle candles. It's important that these candles act as support and resistance.
This gives you a chance to pull off the trade.

BITCOINParameters :
1) It's time to short BTC
2) Global uncertainity ahead, US shutdown
3) Bitcoin is too much over priced and expensive right now
4) All oscillators are showing overbought signals
5) RSI shows clearly divergence against price
6) ADX also below 20, it's sign before the blasting of volatility
Target :
1. 90k to 1L range
2. Fib retracement 50% i.e. 75k to 80k range

A potential significant downturnThe price has recently broken below the Kumo (cloud), which is a strong bearish signal. The cloud was acting as a support zone, and this breach indicates a potential trend reversal to the downside.
The Tenkan-sen (red line) has crossed below the Kijun-sen (blue line), which is another classic bearish signal, indicating weakening momentum.
The future Kumo (the cloud ahead of the price) is shown in red, forecasting a bearish market sentiment for the upcoming periods.
The price has broken down from a major ascending trendline (thick green line), which previously served as support. This breakdown reinforces the bearish case.
The price will fall to test the first support level around $109,894.
Following a minor bounce, the projection shows a continued drop, breaking through the support at $99,516.
The forecast suggests the downtrend could extend further, potentially towards the support levels at $94,131 and even lower into the high $80,000s in the following weeks (late October into November).
Support and Resistance Levels:
Current Price: ~$114,410
Immediate Support: ~$109,894
Key Support Levels: $99,516 and $94,131
In conclusion, the combination of the price breaking below the Ichimoku cloud and a key support trendline, along with bearish crosses in the Ichimoku system, points to a strong possibility of a downward price movement as projected by the blue line on the chart.

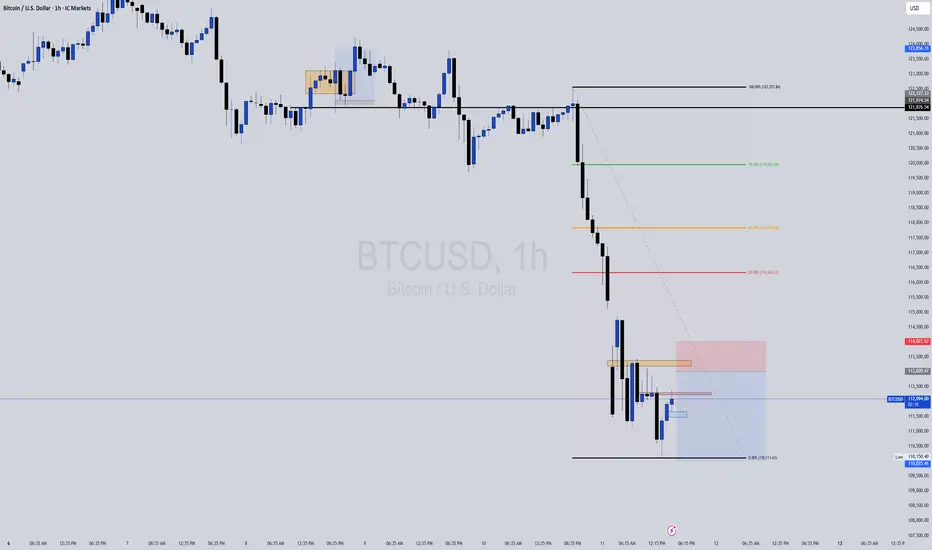
Bitcoin H1 Analysis: Shorting the Retracement After Major BrKDWNLet’s analyze your **BTCUSD H1 chart** carefully 👇
---
🧠 Chart Summary
* **Symbol:** BTCUSD
* **Timeframe:** H1
* **Current Price:** ~112,309
* **Sell Limit:** 113,041.61
* **Stop Loss (SL):** just above 113,041.61 (roughly near 113,300–113,400)
* **Take Profit (TP):** not explicitly shown but likely near 109,000–108,000 based on structure.
---
📊 **Technical Breakdown**
1️⃣ Trend Direction
* The pair is **in a clear short-term downtrend** after failing to hold above the **Previous Daily High (≈122,900)**.
* Price broke **below 50% and 61.8% Fibonacci retracement levels**, confirming bearish momentum.
* **Moving averages (Red = short-term EMA, Yellow = long-term EMA)** are both sloping **downward**, showing strong bearish momentum.
2️⃣ Key Structure Levels
* **Previous Daily High:** ~122,900 (Major resistance zone)
* **Previous Daily Low:** ~114,700 (Broken → retest expected)
* **Sell Limit Level (113,041.61):** Perfectly placed near the **Fibonacci 23.6%–38.2% retracement zone** of the last swing leg.
* This is an **ideal “lower-high” retracement entry** in a downtrend.
#### 3️⃣ Support Zones Below
Immediate support:** 111,800
Next key support:** 109,250 (around your possible TP zone)
Weekly low zone:** 108,350 – if that breaks, we could see a deeper push to 106,000.
---
⚙️ **Trade Plan Analysis (Sell Limit 113041.61)
| Aspect | Analysis |
| --------------------- | --------------------------------------------------------------- |
| **Setup Type** | Pullback Sell / Lower-High Entry |
| **Bias** | Strongly Bearish |
| **Entry Level** | 113,041.61 (Good retracement zone) |
| **Stop Loss** | Above 113,400–113,600 (just beyond structure) |
| **Take Profit** | 109,200–108,300 (previous support and 100% Fibonacci extension) |
| **Risk/Reward Ratio** | ~1:3 or better depending on TP placement |
| **Probability** | High – provided retracement completes to your Sell Limit |
---
🔥Confirmation Points Before Entry Triggers
If price retraces upward:
* Watch for **bearish engulfing** or **rejection candle** near 113,000 zone.
* If price fails to break above 113,400, your entry is valid.
* If it closes **above 113,600 on H1**, consider canceling the order — it would mean short-term momentum shifted bullish temporarily.
---
🧩 Summary Plan
✅ **Entry:** Sell limit at 113,041.61
✅ **SL:** 113,400–113,600
✅ **TP1:** 111,900
✅ **TP2:** 109,200
✅ **TP3:** 108,350
📉 **Bias:** Bearish continuation after pullback
---
⚠️Extra Notes
* Momentum is strong; if the retracement doesn’t reach 113,000, you might miss the entry — don’t chase.
* A secondary entry could form near **112,700** if a fresh rejection candle appears there.
* News events or BTC volatility spikes can create fake pullbacks — always watch the **H1 close** for confirmation.
-
Part 2 Master Candle Stick PatternHow Option Trading Works
Let’s take a simple example.
Suppose a stock named XYZ Ltd. is trading at ₹1000. You believe it will rise in the next month, so you buy a call option with a strike price of ₹1050, expiring in one month, and pay a premium of ₹20 per share.
If the price rises to ₹1100, your profit = (1100 - 1050 - 20) = ₹30 per share.
If the price stays below ₹1050, you lose the premium (₹20 per share).
This is the beauty of options — your loss is limited to the premium, but your potential profit is unlimited.
Similarly, if you believe the stock will fall, you can buy a put option. For example, if you buy a put option at ₹950 with a premium of ₹15:
If the stock falls to ₹900, your profit = (950 - 900 - 15) = ₹35 per share.
If the stock stays above ₹950, you lose the ₹15 premium.

BTC: TEST OF RISING CHANNEL TOP AND POSSIBLILITY OF FREE FALL• BTC is trading in an upward trending channel for the last 4 years.
• It has recently tested the channel top in the last 4 months.
• 3 attempts made to break the channel top, but it fails to sustain above 125000.
• Aggressive selling happens in last week pushing the price near short term channel bottom.
in.tradingview.com
• Looking at the intensity of selling it seems it would break the short time frame channel bottom near 108500.
• Long term short position could be initiated with a target of T1 near channel mid-point and T2 near channel bottom 55000.
• Like to sell long team CE with high premium once the short term channel bottom broken.
• Play with money management and keep psychology intact.
• Educational purpose only.
• Happy trading.

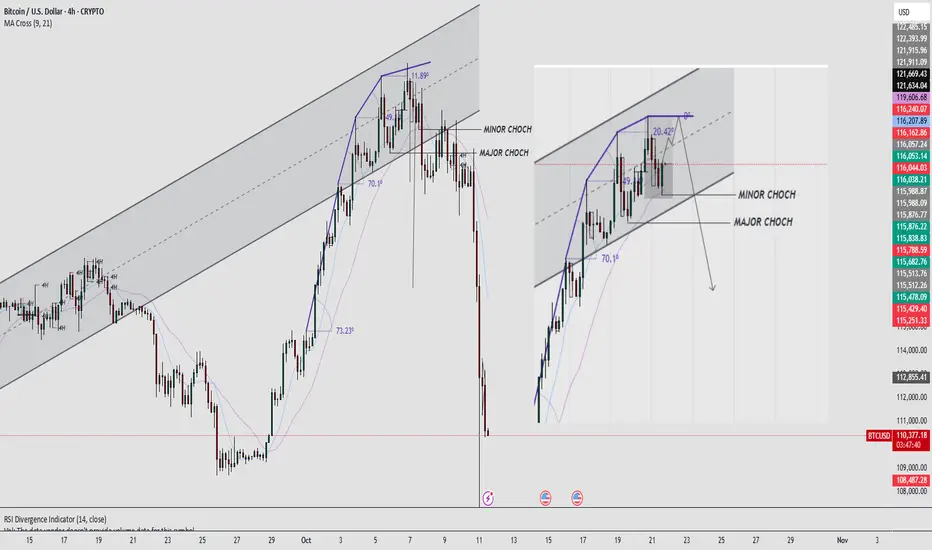
BTC/USD – Structure Played Out Perfectly | Major CHoCH ConfirmedAs marked in the previous analysis (shown on the right), BTC/USD respected the channel structure and delivered the expected downside move after confirming both Minor and Major CHoCH (Change of Character) levels.
Price reacted beautifully within the ascending channel, failing to hold the upper trendline resistance and then showing a clear structure shift — confirming bearish momentum.
This move validates the power of multi-timeframe structure + CHoCH confirmation, which provided an early sign of the reversal.
✅ Bearish CHoCH confirmation at the channel top.
🔹 Strong rejection from upper trendline resistance.
📉 Price broke structure and followed the projected path precisely.
⚙️ Next major support zone sits near 108,500 – 109,000 USD.
🧭 Possible short-term consolidation before continuation.
#BTC #PriceAction #SmartMoneyConcepts #CHoCH #TechnicalAnalysis #CryptoTrading #HenishMavani
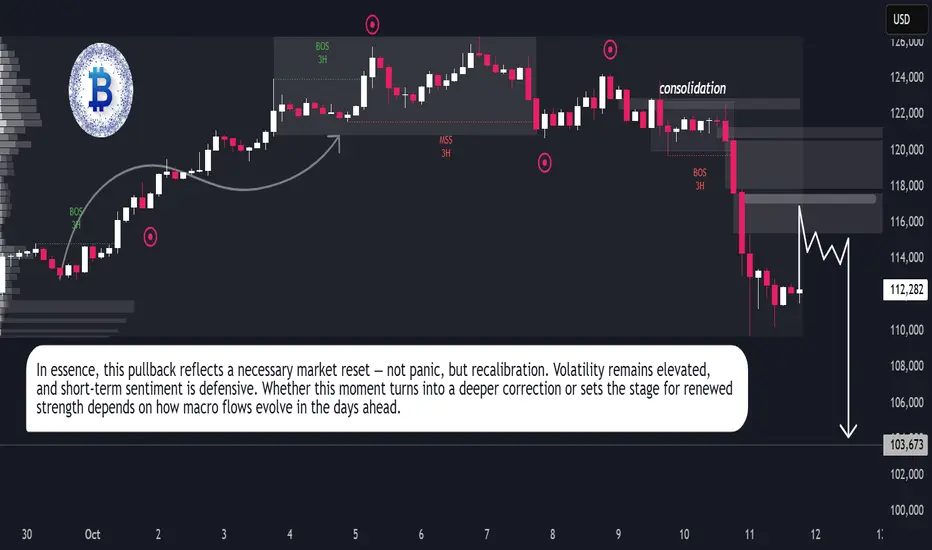
BTC → Correction phase before bullish expansionBTC/USD Report-Based Analysis
Bitcoin is currently in a corrective phase following a structured upward delivery. After showing strength early in the cycle, the market transitioned into a redistribution and consolidation zone, allowing liquidity to rebalance across both sides. This shift suggests that price is undergoing a short-term reaccumulation before the next impulsive move. The recent break of structure (BOS) indicates a temporary bearish delivery, designed to sweep liquidity below prior demand zones. Smart money appears to be collecting positions in discounted price areas, absorbing sell-side liquidity as volatility expands. The clean liquidity pockets under 116,000–114,000 levels highlight potential mitigation zones where larger participants may seek re-entry. The overall structure remains bullish on the higher timeframe. Once the current correction finalizes and liquidity is efficiently collected, BTC may resume its upward expansion, targeting premium zones near 125,000 and above. Momentum confirmation from volume and market flow will be essential for validating this transition back into a bullish delivery phase. In short, BTC is in a controlled correction, aiming to refine liquidity before reinitiating its bullish macro delivery cycle.

Part 6 Learn Institutional TradingStrategies, Risks, and Rewards in Option Trading
Option trading is not just about buying and selling — it’s about strategy. Traders can design positions that match their view of the market: bullish, bearish, or neutral. Some popular strategies include:
Covered Call: Selling call options on a stock already owned to earn premium income.
Protective Put: Buying puts to safeguard existing long positions against potential losses.
Straddle and Strangle: Using both call and put options to profit from large market movements regardless of direction.
Iron Condor: Combining multiple options to earn profit in a range-bound market.
Each strategy involves a balance between risk and reward. For example, buying options offers limited risk (the premium paid) but unlimited profit potential, while selling options can provide steady income but expose traders to significant losses if the market moves sharply.

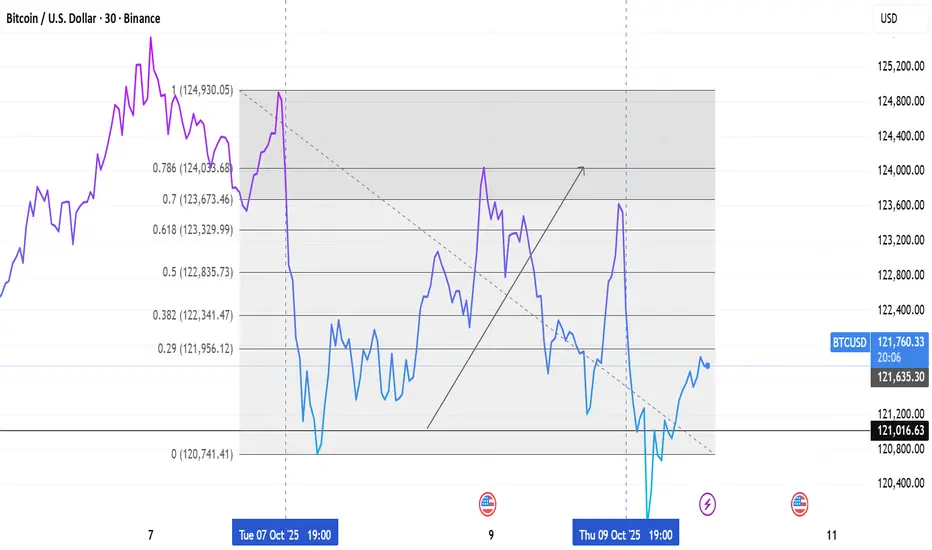
BTC/USD — Liquidity Manipulation at 19:00 IST (US Market Open)BTC/USD displayed a classic liquidity manipulation pattern around 19:00 IST, coinciding with the US market open. Price engineered a sweep above the local range high, triggering breakout liquidity before an aggressive reversal. This aligns with typical New York session behavior, where volatility expansion targets both sides of intraday liquidity zones.
The sharp rejection post-sweep indicates smart money distribution above a previous structural high, followed by a clean displacement move to the downside. The subsequent reaction near the demand zone around 121,000 reflects algorithmic re-balancing and potential accumulation after liquidity clearance.
Monitoring the 121,000–121,200 support zone is key for potential long setups if price structure shifts bullish; otherwise, failure to reclaim 122,000 may continue the short-term bearish flow.

BTC/USD — 0.786 Fibonacci Rejection Signals Distribution ZoneBitcoin (BTC/USD) retraced sharply after reaching its recent swing high near 124,930. The price action formed a clear correction toward the 0.786 Fibonacci retracement level, which acted as a strong resistance zone around 124,038. The market then reversed downward, confirming this level as a potential short-term supply area.
Currently, BTC is attempting a recovery after finding support near 120,741 (Fib 0 level). A sustained move above the 0.382–0.5 retracement range could indicate renewed bullish momentum, while rejection below 0.786 may keep the pair under pressure.
This setup highlights how the 0.786 Fibonacci retracement level serves as a key reaction point for trend continuation or reversal in the current structure.