Divergence SecretsPart 1: Factors Affecting Option Pricing
Option pricing is dynamic, influenced by multiple factors:
1. Intrinsic Value
Difference between underlying price and strike price.
2. Time Value
Longer time to expiry = higher premium due to uncertainty.
3. Volatility
Higher volatility increases probability of profit → higher premium.
4. Interest Rates
Affects call and put pricing slightly, more relevant in long-term options.
5. Dividends
Expected dividend reduces call price but increases put price.
Popular Models:
Black-Scholes Model: Pricing for European options.
Binomial Model: Pricing for American options.
Part 2: Option Strategies for Beginners
Beginners can start with simple strategies:
Long Call: Buy call, bullish view, limited risk.
Long Put: Buy put, bearish view, limited risk.
Covered Call: Own stock + sell call → generate income, moderate risk.
Protective Put: Own stock + buy put → hedge downside.
Tip: Always define your risk and target before trading.
Part 3: Advanced Option Strategies
For experienced traders, multi-leg strategies can maximize returns:
Straddle: Buy call + buy put (same strike & expiry) → profit from volatility.
Strangle: Buy OTM call + OTM put → cheaper than straddle, still bets on volatility.
Vertical Spread: Buy & sell calls (or puts) at different strikes → limit risk & reward.
Iron Condor: Sell OTM call + buy further OTM call, sell OTM put + buy further OTM put → profits in range-bound markets.
Butterfly Spread: Combine calls or puts to profit near a strike price with limited risk.
Key: Advanced strategies reduce risk or cost but require precise market view.
Part 4: Risk Management in Option Trading
Options are powerful but risky. Effective risk management is critical:
Limited vs Unlimited Risk: Buyers have limited loss (premium), sellers can face unlimited loss.
Position Sizing: Never risk more than 1–2% of trading capital on a single trade.
Hedging: Use protective puts or spreads to reduce downside.
Stop Loss: Predefine maximum loss.
Volatility Awareness: High IV → expensive options; low IV → cheap options.
Part 5: Option Trading in Indian Markets
In India, NSE (National Stock Exchange) is the primary platform. Key points:
Instruments: Nifty, Bank Nifty, Stocks (F&O).
Lot Size: Defined per contract; standard for indices & stocks.
Expiry: Weekly, monthly, quarterly.
Regulation: SEBI regulates, ensures margin & settlement rules.
Example:
Nifty current level: 25,000
Buy Nifty 25,100 CE (call)
Lot size: 50 → Pay premium × 50
Settlement:
Cash-settled for indices.
Physical delivery possible for stock options.
Part 6: Tips for Success in Option Trading
To trade options successfully:
Learn Before Trading: Understand Greeks (Delta, Gamma, Theta, Vega, Rho).
Start Small: Focus on a few stocks or indices.
Track Volatility: Higher IV → cautious buying.
Plan Exits: Define profit and loss targets.
Diversify Strategies: Mix spreads, protective puts, and hedges.
Stay Updated: News, earnings, and macro events affect premiums.
Paper Trade: Practice virtual trading before risking real capital.
Mindset: Option trading is about probability, not certainty. Patience and discipline are key.
Trade ideas

Energy Trading and Geopolitics1. Introduction to Event-Driven Trading
Event-driven trading is a subset of fundamental trading strategies that react to specific corporate or macroeconomic events. These events create temporary inefficiencies in the market, which traders attempt to exploit. Unlike long-term investing, which focuses on company fundamentals and growth, event-driven trading is short-term and opportunistic, leveraging price volatility around events.
Key Characteristics:
Trades are short-term, typically lasting hours to days around an event.
High volatility is expected around the event.
Requires pre-event analysis to predict likely outcomes.
Risk is event-specific, rather than market-specific.
2. Earnings Announcements: The Core Event
Earnings announcements are the public disclosure of a company’s financial performance over a given period, usually a quarter. They include metrics such as:
Revenue
Earnings per share (EPS)
Net income
Guidance for future performance
Importance for Traders:
Earnings reports are highly market-sensitive events, often causing large price swings.
The market reacts not just to actual numbers, but also to expectations vs reality.
Earnings Reaction Components:
Surprise Effect – The difference between reported earnings and analyst expectations.
Guidance Effect – Future outlook provided by the company.
Market Sentiment – How traders interpret the news relative to broader market conditions.
3. Types of Event-Driven Earnings Trading Strategies
Event-driven earnings trading can be divided into several approaches:
3.1. Pre-Earnings Positioning
Traders take positions before the earnings release based on expected outcomes.
Bullish Pre-Earnings Trade: Buy a stock anticipating strong earnings.
Bearish Pre-Earnings Trade: Short a stock expecting disappointing results.
Tools Used:
Historical earnings data
Analyst consensus estimates
Options implied volatility
Risks:
Surprise moves can result in rapid losses.
Unanticipated market reactions to guidance or macro news.
3.2. Post-Earnings Reaction Trading
Traders react immediately after the earnings announcement.
Buy the Rumor, Sell the Fact: Stocks often overreact to news.
Momentum Plays: Riding the initial surge after positive surprises.
Mean Reversion Plays: Betting that overreaction will correct itself.
Tools Used:
Real-time news feeds
Trading platforms with low latency
Volatility analysis
Risks:
Sudden reversal after initial move.
Liquidity issues if the stock gaps significantly.
3.3. Options-Based Earnings Strategies
Options provide ways to trade earnings with defined risk.
3.3.1. Straddle
Buy both a call and put at the same strike.
Profits from high volatility, regardless of direction.
Risk is limited to premium paid.
3.3.2. Strangle
Buy out-of-the-money call and put.
Cheaper than straddle but requires bigger moves to profit.
3.3.3. Iron Condor
Sell out-of-the-money call and put while buying farther OTM options.
Profits if stock remains within a range.
Strategy bets on low volatility post-earnings.
3.4. Pair and Relative Performance Strategies
Trading two related stocks to profit from earnings mispricing.
Example: Buy outperformer, short underperformer in same sector.
Reduces market-wide risk, isolates company-specific reactions.
4. Key Factors to Consider Before Earnings Trading
Earnings Expectations
Compare consensus estimates vs historical performance.
Understand market sentiment and analyst revisions.
Volatility
Stocks often exhibit high implied volatility before earnings.
Option premiums increase, providing trading opportunities.
Liquidity
Ensure stock or options have sufficient trading volume.
Avoid illiquid stocks to reduce slippage risk.
Historical Patterns
Some companies have predictable post-earnings moves.
Analyze seasonal patterns and sector behavior.
Macro Environment
Broader market conditions can amplify or dampen earnings reactions.
Example: Interest rate announcements, geopolitical news.
5. Risk Management in Event-Driven Earnings Trading
Event-driven earnings trading carries unique risks due to high volatility and uncertainty.
5.1. Pre-Event Risks
Unexpected Results: Missing analyst expectations can trigger sharp declines.
Volatility Crush: Post-earnings implied volatility often drops, reducing option premiums.
5.2. Post-Event Risks
Gaps and Slippage: Overnight gaps can bypass stop-loss orders.
False Momentum: Initial spikes may reverse quickly.
5.3. Hedging Techniques
Use options to limit downside.
Trade pairs or sector spreads to reduce market exposure.
Scale positions gradually to manage risk.
6. Tools and Platforms for Earnings Trading
Trading Platforms
Real-time order execution
Earnings calendars and alerts
News Feeds
Bloomberg, Reuters, or market-specific news aggregators
Twitter feeds of analysts for sentiment
Analytics Software
Implied volatility tracking
Earnings surprise calculators
Option strategy simulators
Backtesting Platforms
Historical earnings data analysis
Strategy testing under various market conditions
7. Case Studies and Examples
Example 1: Apple Inc. (AAPL)
Pre-Earnings Trade: Expecting strong iPhone sales → bought calls.
Outcome: Positive earnings beat → stock jumped 6% → profit realized.
Lesson: Pre-event positioning can be profitable if market consensus aligns.
Example 2: Tesla Inc. (TSLA)
Post-Earnings Reaction Trade: Tesla missed delivery targets → stock dropped.
Strategy: Shorted the initial momentum → profit from the decline.
Lesson: Quick post-event reactions can exploit overreactions.
Example 3: Options Straddle
Stock: Netflix
Scenario: High uncertainty before earnings
Action: Buy straddle to profit from a large move in either direction.
Outcome: Stock surged → call gained, put lost → net profit exceeded risk.
8. Behavioral Aspects and Market Psychology
Market reactions to earnings often deviate from rational expectations due to:
Herd Behavior: Traders following momentum.
Anchoring: Overemphasis on prior earnings trends.
Confirmation Bias: Ignoring contrary signals.
Understanding these psychological factors can give traders an edge.
9. Regulatory and Reporting Considerations
Insider Trading Rules: Avoid trading on non-public material information.
Earnings Manipulation Awareness: Watch for red flags in financial reports.
Disclosure Compliance: Ensure strategies do not violate SEC or local regulations.
10. Conclusion
Event-driven earnings trading is a sophisticated strategy that requires both fundamental and technical analysis skills. By focusing on corporate events like earnings announcements, traders can exploit short-term volatility and market inefficiencies. Successful execution involves:
Detailed pre-event research
Effective risk management
Rapid execution and monitoring
Understanding market psychology
Using options and hedging strategies wisely
When practiced diligently, earnings trading can become a powerful tool in a trader’s arsenal, offering consistent opportunities in an otherwise efficient market.
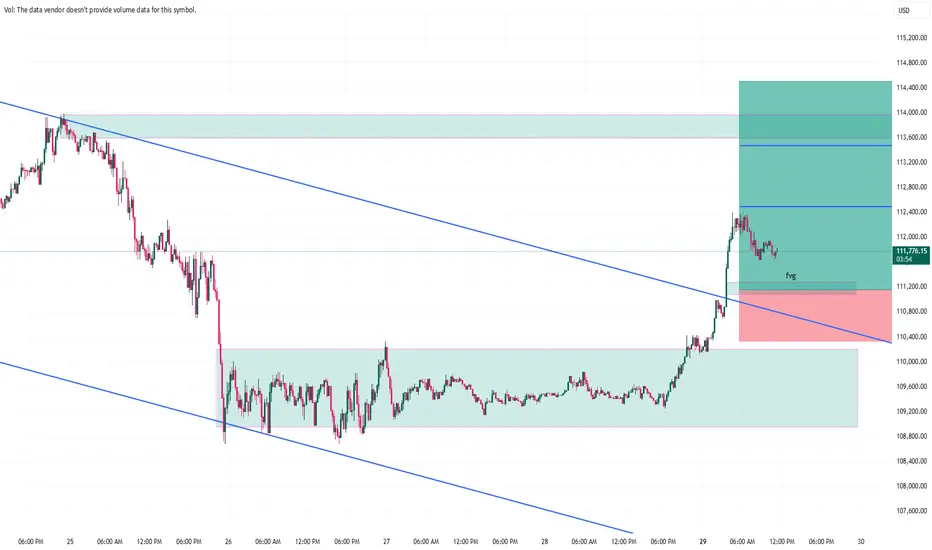
Title: BTCUSD – Breakout from Falling Channel | Long SetupDescription:
Bitcoin has broken out of the falling channel with strong bullish momentum.
✅ Clean breakout from the downtrend structure
✅ Retest of the breakout level showing support
✅ Long position aligned with bullish continuation
Bias: Bullish as long as price holds above the channel breakout level.
Note: This is not financial advice. Please do your own research and manage risk accordingly.
BITCOIN Neowave ForecastNamaskaram
Watch the video to understand my view...
following instruments Discussed in the video...
#XAUUSD
#BTCUSD
#NIFTY 50
#BANK NIFTY
FX:XAUUSD OANDA:XAUUSD COINBASE:BTCUSD


Trading Master Class With ExpertsPart 1: Introduction to Option Trading
Options are financial derivatives that derive their value from an underlying asset such as stocks, indices, commodities, or currencies. Unlike shares, buying an option doesn’t mean you own the asset—it gives you the right but not the obligation to buy or sell the asset at a pre-agreed price within a set period. This flexibility makes options a powerful tool for hedging, speculation, and income generation.
Part 2: What is a Derivative?
A derivative is a financial contract whose value depends on another asset. Futures and options are the two most popular derivatives. While futures require you to buy/sell at expiry, options give you the choice. This “choice” is what makes them unique—and sometimes tricky.
Part 3: The Two Types of Options
Call Option – Gives the buyer the right to buy an asset at a fixed price (strike price).
Example: If you buy a call option of Reliance at ₹2500, and the stock moves to ₹2600, you can still buy it at ₹2500.
Put Option – Gives the buyer the right to sell an asset at a fixed price.
Example: If you buy a put option at ₹2500 and the stock falls to ₹2400, you can still sell it at ₹2500.
Part 4: Key Terminologies
Strike Price – The pre-decided price of buying/selling.
Premium – The cost paid to buy the option.
Expiry Date – The last date till which the option is valid.
In-the-Money (ITM) – Option has intrinsic value.
Out-of-the-Money (OTM) – Option has no intrinsic value.
At-the-Money (ATM) – Strike price is close to market price.
Part 5: Call Option in Detail
A call option is ideal if you expect the price of an asset to rise. Buyers risk only the premium paid, while sellers (writers) can face unlimited losses if prices rise sharply. Traders often buy calls for bullish bets and sell calls to earn premium income.
Part 6: Put Option in Detail
A put option is profitable when asset prices fall. Buyers of puts use them for protection against a market crash, while sellers hope prices won’t fall so they can pocket the premium. Investors holding stocks often buy puts as insurance against downside risk.
Part 7: How Option Premium is Priced
Option premium = Intrinsic Value + Time Value
Intrinsic Value: Actual value (e.g., if Reliance is ₹2600 and strike is ₹2500, intrinsic = ₹100).
Time Value: Extra cost traders pay for the possibility of favorable movement before expiry.
Pricing is also influenced by volatility, interest rates, and dividends.
Part 8: The Greeks in Options
The Greeks measure option sensitivity:
Delta – Measures how much option price moves for a ₹1 move in stock.
Gamma – Measures how delta changes with stock movement.
Theta – Measures time decay (options lose value as expiry approaches).
Vega – Measures sensitivity to volatility.
Rho – Measures sensitivity to interest rates.
Part 9: Why Traders Use Options
Options are versatile. Traders use them to:
Speculate on price movements with limited risk.
Hedge against adverse market moves.
Generate Income by selling options (collecting premiums).
Leverage positions with less capital compared to buying shares directly.
Part 10: Buying vs Selling Options
Buying Options: Limited risk (premium), unlimited profit potential.
Selling Options: Limited profit (premium), unlimited risk.
Example: Selling a naked call when markets rise aggressively can cause heavy losses.

TRADING LEVELS FOR BTC / USDBuy Above : 109834
SL : 108576
Targets shared on chart
Sell Below : 108576
SL : 109834
Targets shared on chart

Patience is Profit: The Unseen Poetry of Forex Risk Management⚠️ Shocking Truth in Forex Trading ⚠️
Most traders lose not because their strategy is wrong… but because they ignore risk management.
🛡️ Mastering Risk Management in Forex Trading
Risk management is the foundation of long-term success in Forex. Many traders spend their time perfecting entries and strategies, but the real edge comes from how well you manage risk, emotions, and capital. Without these, even the best strategy will fail.
📌 Position Sizing
📉 Never risk more than 1–2% of your account on a single trade.
📏 Adjust lot size according to your stop-loss distance.
⏳ Small, controlled risks keep you in the game long enough to let your strategy work.
🎯 Risk-to-Reward Ratio
⚖️ Always aim for 1:2 or higher risk-to-reward.
📊 Even with just a 40% win rate, a positive RRR keeps you profitable.
🔑 Focus on consistency rather than chasing quick wins.
🧠 Psychology of Risk
😨 Fear makes traders exit winning trades too soon.
💰 Greed convinces them to hold onto losing trades too long.
📝 Build a personal rule: “I follow my plan, not my emotions.”
✔️ Accept losses as part of the business—risk is simply the cost of trading.
📉 Drawdown Control
🚫 Avoid over-leveraging—it magnifies both profits and losses.
🛑 Cap your risk per trade to protect account equity.
🔄 Remember: a 50% loss requires 100% gain to recover. Capital protection comes first.
🔄 Consistency Over Perfection
🎲 No strategy wins every time.
🏦 Risk management allows you to survive losing streaks.
🎰 Think like a casino: edge + probability + discipline = profit.
🧘 Trading Psychology Habits
📖 Keep a trading journal to track results and emotions.
🧩 Detach from outcomes and focus on executing your plan.
☕ Trade only when your mindset is calm and focused.
⚖️ Golden Rule
💎 Protect your capital first—profits will naturally follow.
Discipline, patience, and controlled risk are the keys to turning short-term survival into long-term success.
✅ Final Thought: In Forex, your greatest weapon is not predicting every move but mastering risk management and emotional control. The market always rewards patience, discipline, and consistency—not reckless gambling.
📢 Follow me for more Forex insights, strategies, and trading psychology content.

Bull Takeing Charge on BTC after long ConsolidationBITSTAMP:BTCUSD ready to move up, Hold on tight Good Consolidtion

BITCOIN CRASH PREDICTIONAs per the chart pattern of Bitcoin USD Chart, there is a possibility of a downtrend and crash in bitcoin till 80k levels as major order blocks are pending on Daily / Weekly / Monthly charts. With a stop loss of 118234, a short position can be initiated for a target of 107000 short term of 2 weeks and up to 80k in long term of 6 months to 1 year.

Introduction to GIFT Nifty India1. Overview of GIFT Nifty India
GIFT Nifty India refers to the trading of the Nifty 50 index derivatives on the GIFT International Financial Services Centre (GIFT IFSC) in Gandhinagar, Gujarat. GIFT IFSC is India’s first international financial hub designed to provide Indian and global investors with world-class financial infrastructure, competitive taxation, and seamless access to global markets.
The GIFT Nifty index allows investors in the IFSC to trade in Nifty 50 derivatives using a framework similar to global financial markets while benefiting from liberalized rules and currency flexibility, such as trading in USD. This makes GIFT Nifty a bridge between India’s domestic equity markets and global financial players.
2. Historical Background
The GIFT City initiative was conceptualized in 2007, with the vision to create an international financial hub in India, similar to Singapore, Dubai, and Hong Kong. By 2015, the GIFT IFSC was operational, offering a platform for offshore trading, banking, and insurance services.
The introduction of GIFT Nifty derivatives was a significant step towards enabling global investors to participate in Indian equity markets while trading from a tax-friendly and internationally regulated hub. The Securities and Exchange Board of India (SEBI) and the International Financial Services Centres Authority (IFSCA) played a critical role in designing the regulatory framework for GIFT Nifty.
3. Key Objectives of GIFT Nifty
GIFT Nifty serves multiple objectives:
Global Access to Indian Markets: Enables foreign investors to trade Indian equity derivatives without entering domestic regulatory constraints.
Currency Flexibility: Allows trades in USD and other approved foreign currencies.
Risk Management: Provides advanced derivative instruments for hedging and speculative purposes.
Market Depth & Liquidity: Enhances liquidity in Indian equities by attracting international capital.
Integration with Global Financial Markets: Promotes India as a financial hub, aligning with international trading standards.
4. Structure of GIFT Nifty
GIFT Nifty is primarily structured around Nifty 50 Index derivatives, which include:
Futures: Contracts obligating the buyer to purchase and the seller to sell the underlying Nifty index at a predetermined price on a future date.
Options: Contracts giving the buyer the right, but not the obligation, to buy (call option) or sell (put option) the Nifty index at a specified price before the contract expires.
4.1 Settlement and Contracts
Currency: USD or other approved foreign currencies.
Settlement: Cash-settled, avoiding the need for physical delivery.
Contract Size: Typically aligned with domestic Nifty contracts but adjusted for international standards.
Trading Hours: Extended hours to facilitate global investor participation.
5. Regulatory Framework
The GIFT IFSC operates under a unique regulatory ecosystem:
IFSCA Regulations: IFSCA is the primary regulator for financial activities in GIFT IFSC, offering flexibility in market operations.
SEBI Oversight: Domestic regulations for securities derivatives still influence contract specifications.
Tax Benefits: Offshore investors enjoy competitive tax rates compared to domestic markets, promoting global participation.
This combination of regulatory oversight ensures transparency, investor protection, and alignment with international best practices.
6. Trading Mechanism
GIFT Nifty trades through an electronic trading platform similar to NSE and BSE in India but tailored for offshore participants.
6.1 Participants
Foreign Institutional Investors (FIIs)
Non-Resident Indians (NRIs)
Global Hedge Funds and Asset Managers
International Banks
6.2 Order Types
Limit Orders: Buy or sell at a specified price.
Market Orders: Buy or sell at the current market price.
Advanced Order Types: Stop-loss, bracket orders, and algorithmic trading for sophisticated participants.
6.3 Clearing and Settlement
GIFT Nifty derivatives are cash-settled, meaning profits and losses are transferred in cash. Clearing is facilitated by GIFT IFSC-based clearing corporations, ensuring minimal counterparty risk.
7. Risk Management in GIFT Nifty
Trading Nifty derivatives inherently involves market risk, but GIFT IFSC offers advanced risk management frameworks:
Margin Requirements: Participants must maintain margins to mitigate default risks.
Position Limits: Regulatory limits on positions prevent excessive speculation.
Volatility Controls: Circuit breakers and price bands reduce the impact of sudden market movements.
Hedging: Institutional investors often use GIFT Nifty for hedging exposure in domestic Indian markets or international portfolios.
8. Importance for Investors
8.1 For Domestic Investors
Access to offshore markets without leaving India.
Exposure to USD-denominated Nifty derivatives.
Tax efficiency for international trades.
8.2 For Global Investors
Direct exposure to India’s top 50 listed companies.
Flexibility to hedge or speculate using advanced derivatives.
Participation in India’s economic growth story through a regulated, secure platform.
9. Advantages of GIFT Nifty
Global Participation: Enables investors worldwide to trade Indian indices without domestic account constraints.
Liquidity Enhancement: Additional trading volumes increase market depth.
Currency Diversification: Trading in USD or other approved currencies provides an alternative to INR exposure.
Tax Benefits: Offshore tax rules are generally more favorable.
Infrastructure: State-of-the-art trading technology ensures seamless execution.
10. Challenges and Considerations
Despite its advantages, GIFT Nifty comes with certain challenges:
Market Awareness: Global investors need awareness about India-specific market nuances.
Currency Risk: Trading in foreign currencies exposes participants to exchange rate volatility.
Regulatory Complexity: Understanding the dual oversight by SEBI and IFSCA is crucial.
Liquidity Differences: Offshore liquidity may be lower than domestic NSE/BSE markets initially.
Conclusion
GIFT Nifty India represents a milestone in India’s financial evolution, combining domestic equity strength with international trading standards. It provides a platform for global and domestic investors to participate in India’s equity market in a regulated, tax-efficient, and technologically advanced environment.
By bridging the gap between domestic and international markets, GIFT Nifty contributes to liquidity, market depth, and India’s vision of becoming a global financial hub. Its success relies on awareness, liquidity development, continuous innovation, and integration with global financial trends.
In essence, GIFT Nifty India is not just a trading instrument; it is a symbol of India’s growing economic and financial maturity, offering opportunities for risk management, investment, and strategic growth for participants worldwide.

BTCUSD – Short-term Down Channel...BTCUSD – Short-term Down Channel, Accumulation Before a Potential Rally
Hello traders,
On the H4 timeframe, BTC is currently moving within a short-term descending channel. After touching a strong support level, selling pressure has started to weaken. However, the 107.4k zone has not yet been retested, and it is quite likely that price will revisit this area once more.
Technical View
During the past week, BTC traded in a very “technical” manner – with clear ranges, precise reversal points, and a consistent descending channel structure.
Key Support: around 107.4k, aligning with the Long Entry Zone.
Short-term Resistance: 110k – 111k, where price tends to react during recovery moves.
Fundamental View
From a fundamental perspective, there are not many factors suggesting that BTC will continue a deeper decline. Moreover, historical data shows that October is often a period when BTC and the broader crypto market tend to recover. This strengthens the probability of a strong rebound once support has been fully tested.
Trading Scenarios
Short towards support
Entry: 110.3k
SL: 110.8k
TP: 109k – 107.6k
Long at strong support
Entry: 107.4k
SL: 106.8k
TP: If price reacts strongly: hold the position, move SL to breakeven, and target higher levels in line with the broader uptrend.
If price reaction is weak: book profits around 109k for a short-term gain.
Conclusion
Short-term: priority remains to look for short opportunities around 110.3k back towards support.
Medium-term: plan to go long near 107.4k to capture the expected rebound, with the view that BTC could re-enter a bullish phase in October.
Risk Management
Always respect stop-loss levels, especially for long positions at support, as this is the key level that will decide BTC’s next direction.
This is my personal outlook on BTC for the weekend. Use it as a reference and adapt it to your own trading system.
👉 Follow me for shared scenarios and the quickest updates whenever price structure changes.

Types of Trading in India: An In-Depth Analysis1. Equity Trading (Stock Trading)
Overview: Buying and selling shares of companies listed on stock exchanges like NSE and BSE.
Key Features:
Can be short-term (intraday) or long-term (investment).
Investors earn through capital appreciation and dividends.
Benefits: High liquidity, transparency, regulated market.
Risks: Market volatility can lead to significant losses.
Example: Buying shares of Reliance Industries and selling after a price rise.
2. Intraday Trading
Overview: Buying and selling stocks within the same trading day.
Key Features:
Traders do not hold positions overnight.
Relies heavily on technical analysis.
Benefits: Quick profits, no overnight risk.
Risks: High leverage increases risk; requires constant monitoring.
Example: Buying Infosys in the morning and selling by afternoon for short-term gains.
3. Futures and Options (Derivatives Trading)
Overview: Contracts whose value is derived from underlying assets like stocks, indices, or commodities.
Key Features:
Futures obligate buying/selling at a fixed date.
Options provide the right, not obligation, to buy/sell.
Benefits: Hedging, leverage, speculation.
Risks: High risk due to leverage; can lead to large losses.
Example: Buying Nifty Call Option to profit from a market rise.
4. Commodity Trading
Overview: Buying and selling commodities such as gold, silver, oil, and agricultural products on MCX or NCDEX.
Key Features:
Includes spot, futures, and options contracts.
Influenced by global demand, supply, and geopolitical factors.
Benefits: Portfolio diversification, inflation hedge.
Risks: Price volatility, geopolitical risks, storage costs (for physical commodities).
Example: Trading crude oil futures anticipating a price surge.
5. Currency Trading (Forex Trading)
Overview: Trading in foreign currency pairs like USD/INR, EUR/INR.
Key Features:
Can be spot or derivative contracts.
Driven by global economic events and RBI policies.
Benefits: High liquidity, global opportunities.
Risks: Exchange rate volatility, leverage risks.
Example: Buying USD against INR expecting INR to weaken.
6. Mutual Fund Trading
Overview: Investing in professionally managed funds that pool money from multiple investors.
Key Features:
Equity, debt, hybrid funds available.
Can be SIP (Systematic Investment Plan) or lump sum.
Benefits: Professional management, diversification, lower risk.
Risks: Returns are market-linked; management fees apply.
Example: Investing in HDFC Equity Fund via monthly SIP.
7. Bond and Debt Securities Trading
Overview: Trading government and corporate bonds, debentures, and fixed-income instruments.
Key Features:
Predictable income through interest payments.
Less volatile than equity markets.
Benefits: Capital preservation, steady returns.
Risks: Interest rate fluctuations, credit risk of issuers.
Example: Buying 10-year government bonds for stable returns.
8. Cryptocurrency Trading
Overview: Buying and selling digital currencies like Bitcoin, Ethereum, and Indian crypto tokens.
Key Features:
Highly volatile and largely unregulated in India.
Includes spot trading and futures trading.
Benefits: Potential for high returns, global market access.
Risks: Extreme volatility, regulatory uncertainty, cyber risks.
Example: Trading Bitcoin on WazirX anticipating a price spike.
9. IPO and Primary Market Trading
Overview: Investing in companies during their Initial Public Offering before they are listed.
Key Features:
Subscription-based allotment via brokers or banks.
Potential for listing gains.
Benefits: Opportunity to buy at a lower price before listing.
Risks: Listing may underperform; market sentiment affects gains.
Example: Applying for LIC IPO shares expecting listing gains.
10. Algorithmic and High-Frequency Trading (HFT)
Overview: Automated trading using computer algorithms to execute orders at high speed.
Key Features:
Relies on pre-set rules, AI, and quantitative models.
Popular among institutional traders and hedge funds.
Benefits: Speed, accuracy, can exploit small price differences.
Risks: Requires technical expertise, market flash crashes possible.
Example: Using algorithmic trading to scalp Nifty futures in milliseconds.
Conclusion
India offers a wide spectrum of trading opportunities for investors and traders—from traditional stock markets to cutting-edge algorithmic and crypto trading. Choosing the right type depends on risk tolerance, capital, time horizon, and knowledge of the market. While equities, derivatives, and commodities dominate in terms of popularity, newer avenues like cryptocurrencies and algorithmic trading are gaining traction rapidly.

Half a Billion Dollars in Bitcoin and Tens of Millions in Ethere🚨In a 60‑minute window, more than 5,700 BTC (~
509
𝑀
)
𝑎
𝑛
𝑑
∗
∗
27
,
000
𝐸
𝑇
𝐻
∗
∗
(
509M)and∗∗27,000ETH∗∗(
43M) moved between large wallets and exchanges.
Such extraordinary volume in a short period often signals rapid trend reversals or strong price pressure.
Exchange inflows usually mean selling pressure; outflows often signal accumulation and possible bullish momentum.🚨

BTCUSD- BUYPerfect support zone good condition to buy
My buying is on 15 min candel with good volume
Low risk trade

Part 2 Candle Stick PatternParticipants in Options Trading
Options markets consist of four main participants:
Buyers of Calls – Expect the underlying asset’s price to rise. Risk limited to premium.
Buyers of Puts – Expect the underlying asset’s price to fall. Risk limited to premium.
Sellers (Writers) of Calls – Expect prices to remain below the strike price. Risk is theoretically unlimited for naked calls.
Sellers (Writers) of Puts – Expect prices to remain above the strike price. Risk is substantial if the asset falls sharply.
Options Strategies
Option trading is highly versatile. Traders can employ strategies ranging from conservative hedging to speculative bets:
Covered Call: Holding the underlying asset while selling call options to generate income from premiums.
Protective Put: Buying puts while holding the asset to protect against downside risk.
Straddle: Buying a call and a put with the same strike price and expiration, expecting high volatility.
Strangle: Buying out-of-the-money call and put options for lower cost but with a wider price movement range.
Spreads: Combining multiple options to limit risk and potential profit (e.g., bull call spread, bear put spread).
Option Pricing Factors
Option prices are influenced by several variables:
Underlying Asset Price: Higher asset prices increase call values and decrease put values.
Strike Price: The proximity of the strike to the current asset price affects intrinsic value.
Time to Expiration: More time increases time value and option price.
Volatility: Greater market volatility increases the likelihood of significant price changes, raising premiums.
Interest Rates & Dividends: Rising interest rates increase call values and reduce put values; dividend payouts impact stock options.
The most widely used pricing model is the Black-Scholes Model, which calculates theoretical option prices based on these factors.
Advantages of Option Trading
Leverage: Control a larger position with a smaller capital outlay.
Hedging: Protect portfolios against adverse price movements.
Flexibility: Execute a wide range of strategies for bullish, bearish, or neutral markets.
Defined Risk: Maximum loss for buyers is limited to the premium paid.
Profit in Any Market: Options allow for profit in rising, falling, or sideways markets.
Risks of Option Trading
Options are complex and involve risks:
Premium Loss: Buyers can lose the entire premium if the option expires worthless.
Leverage Risk: While leverage amplifies gains, it also amplifies losses for sellers or advanced strategies.
Time Decay (Theta): Options lose value as expiration nears if the underlying price does not move favorably.
Volatility Risk (Vega): Changes in market volatility affect option prices.
Complexity: Advanced strategies can involve multiple positions and require careful monitoring.

Advanced Smart Liquidity Concepts1. Introduction to Smart Liquidity
1.1 Definition of Smart Liquidity
Smart liquidity refers to the portion of market liquidity that is not just available but is efficiently utilized by market participants to execute trades with minimal market impact. Unlike raw liquidity, which measures just the number of shares or contracts available, smart liquidity evaluates:
Accessibility: Can orders be executed efficiently without adverse price movement?
Quality: How stable and reliable is the liquidity at various price levels?
Speed: How quickly can liquidity be accessed and replenished?
1.2 Evolution from Traditional Liquidity Concepts
Traditional liquidity focuses on measurable quantities: order book depth, bid-ask spreads, and trading volume. Smart liquidity incorporates behavioral and strategic aspects of market participants:
Algorithmic awareness: Machines identify and exploit inefficiencies, adjusting liquidity dynamically.
Hidden liquidity: Orders concealed in dark pools or iceberg orders that influence market balance without being visible.
Latency arbitrage impact: The speed advantage of HFT affects liquidity availability and reliability.
2. Drivers of Advanced Smart Liquidity
Smart liquidity is influenced by a complex interplay of market structure, participant behavior, and technological factors:
2.1 Market Microstructure
Order book dynamics: Depth, shape, and resilience of the order book impact how liquidity is absorbed.
Spread dynamics: Tight spreads suggest high-quality liquidity, but may hide fragility if large orders create slippage.
Order flow imbalance: The ratio of aggressive to passive orders indicates how liquidity will move under pressure.
2.2 High-Frequency and Algorithmic Trading
Liquidity provision by HFTs: HFTs continuously place and cancel orders, creating dynamic liquidity pockets.
Quote stuffing and spoofing: Some algorithms distort perceived liquidity temporarily, affecting smart liquidity perception.
Latency arbitrage: Access to faster data feeds allows participants to extract liquidity before it is visible to slower traders.
2.3 Dark Pools and Hidden Liquidity
Iceberg orders: Large orders split into smaller visible slices to reduce market impact.
Alternative trading systems (ATS): These venues offer substantial liquidity without displaying it on public exchanges, contributing to overall market efficiency.
Liquidity fragmentation: The same asset may be available in multiple venues, requiring smart routing to access efficiently.
2.4 Market Sentiment and Behavior
Trader psychology: Fear or greed can amplify or withdraw liquidity, especially during volatility spikes.
News and macro events: Smart liquidity shifts rapidly around earnings, central bank announcements, or geopolitical shocks.
3. Measuring Smart Liquidity
Traditional liquidity measures are insufficient for modern market analysis. Advanced metrics capture both quality and accessibility:
3.1 Market Impact Models
Price impact per trade size: How much the price moves for a given order quantity.
Resilience measurement: How quickly the market recovers after a large trade absorbs liquidity.
3.2 Order Book Metrics
Depth at multiple levels: Not just best bid and ask but the full ladder of price levels.
Order flow toxicity: Probability that incoming orders are informed or likely to move the market against liquidity providers.
3.3 Smart Liquidity Indicators
Liquidity-adjusted volatility: Adjusting volatility estimates based on available liquidity.
Effective spread: Spread accounting for market impact and hidden liquidity.
Liquidity heatmaps: Visual tools highlighting concentration and availability of smart liquidity across price levels and venues.
3.4 Machine Learning for Liquidity Analysis
Predicting liquidity shifts using historical order book data.
Clustering trades by behavior to identify hidden liquidity patterns.
Algorithmic routing optimization to access the most favorable liquidity pools.
4. Strategies Leveraging Smart Liquidity
Advanced smart liquidity concepts are not just analytical—they inform trading strategy, risk management, and execution efficiency.
4.1 Optimal Order Execution
VWAP and TWAP algorithms: Spread large trades over time to minimize market impact.
Liquidity-seeking algorithms: Dynamically route orders to venues with the highest smart liquidity.
Iceberg order strategies: Hide large orders to reduce signaling risk.
4.2 Risk Management Applications
Dynamic hedging: Adjust hedge positions based on real-time smart liquidity availability.
Liquidity-adjusted VaR: Incorporates potential liquidity constraints into risk calculations.
Stress testing: Simulating low liquidity scenarios to measure portfolio vulnerability.
4.3 Arbitrage and Market-Making
Exploiting temporary liquidity imbalances across venues or assets.
Providing liquidity strategically during periods of high spreads to capture rebates and mitigate inventory risk.
Utilizing smart liquidity signals to identify emerging inefficiencies.
5. Smart Liquidity in Volatile Markets
5.1 Liquidity Crises and Flash Events
Flash crashes often occur when apparent liquidity evaporates under stress.
Smart liquidity analysis identifies resilient liquidity versus superficial depth that may disappear under pressure.
5.2 Adaptive Strategies for High Volatility
Dynamic adjustment of execution algorithms.
Use of limit orders versus market orders depending on liquidity conditions.
Monitoring order flow toxicity and liquidity concentration to avoid adverse selection.
6. Technological Innovations Impacting Smart Liquidity
6.1 AI and Machine Learning
Predictive models for liquidity shifts.
Reinforcement learning for adaptive execution strategies.
6.2 Blockchain and Decentralized Finance (DeFi)
Automated market makers (AMMs) provide liquidity continuously with programmable rules.
Smart liquidity pools that dynamically adjust pricing and depth.
6.3 High-Frequency Infrastructure
Co-location and low-latency networking enhance the ability to access liquidity before competitors.
Real-time analytics of fragmented markets for smart routing.
7. Regulatory Considerations
Advanced liquidity management intersects with regulation:
Market manipulation risks: Spoofing, layering, and quote stuffing can misrepresent liquidity.
Best execution obligations: Brokers must seek the highest-quality liquidity for clients.
Transparency vs. privacy: Balancing visible liquidity with hidden orders in regulated venues.
8. Future Directions of Smart Liquidity
Integration of multi-asset liquidity analysis: Evaluating cross-asset and cross-venue liquidity to optimize execution.
AI-driven market-making: Fully autonomous systems that dynamically adjust liquidity provision.
Global liquidity networks: Real-time global liquidity mapping for cross-border trading.
Impact of quantum computing: Potentially enabling instant liquidity analysis at unprecedented speeds.
9. Conclusion
Advanced smart liquidity goes far beyond simple bid-ask spreads or volume metrics. It encompasses quality, accessibility, adaptability, and strategic use of liquidity. In a market dominated by algorithms, high-frequency trading, and fragmented venues, understanding smart liquidity is essential for:
Efficient trade execution
Risk mitigation and stress management
Market-making and arbitrage strategies
Anticipating market behavior in volatile conditions
Future financial markets will increasingly rely on AI-driven liquidity analytics, real-time monitoring, and predictive modeling. Traders and institutions that master smart liquidity will gain a competitive edge in both execution efficiency and risk management.

BTC/USD: Bearish Trend After Flash Crash and Key NewsThe BTC/USD chart shows a strong bearish trend following the "flash crash" event and contract liquidations. Currently, BTC is moving within a downward channel with support levels at 110,300 USD and 108,000 USD.
News Impact:
Morgan Stanley to Offer Crypto Trading: Morgan Stanley’s partnership with Zerohash to provide crypto trading on E*Trade could boost cryptocurrency acceptance, but it's not enough to reverse the bearish trend in BTC.
Fed Chairman Jerome Powell on Interest Rates: Jerome Powell's statements regarding the possibility of maintaining high interest rates have increased uncertainty, negatively impacting the cryptocurrency market.
Conclusion: The bearish trend of BTC/USD may continue. Traders should pay attention to support levels and stay updated with economic news to make informed trading decisions.

BTCUSD Analysis on (24/09/2025)BTCUSD UPDATEDE
Current price- 113700
If price stay above 111000,then next target 115000,117000 and below that 109000
Plan; if price break 113500-112500 area and above that 113500 area,we will place buy oder in BTCUSD with target of 115000,117000 & stop loss should be placed at 111000

Part 7 Trading Master Class1. Introduction to Options Trading
Options are one of the most fascinating financial instruments in the market because they allow traders to speculate, hedge, and manage risks in creative ways. Unlike buying and selling shares directly, options give you the right but not the obligation to buy or sell an asset at a predetermined price within a specified period. This flexibility makes options extremely powerful.
However, with power comes responsibility. Options trading is not as straightforward as buying a stock and waiting for its price to go up. Options involve multiple variables—time decay, implied volatility, strike prices, and premiums—that all influence profit and loss. For this reason, traders develop strategies that balance risk and reward depending on their market outlook.
Option trading strategies range from simple ones—like buying a call when you expect a stock to rise—to very advanced ones—like iron condors or butterflies, where you combine multiple contracts to profit from stable or volatile markets.
In this guide, we’ll explore the most widely used option trading strategies, explaining how they work, when to use them, and their advantages and risks.
2. Understanding Options Basics
Before diving into strategies, let’s understand the core building blocks of options:
Call Option
A call option gives the buyer the right to buy an asset at a fixed strike price within a given time frame.
Example: You buy a call option on Reliance at ₹2,500 strike for a premium of ₹50. If Reliance rises to ₹2,600, you can exercise the option and profit.
Put Option
A put option gives the buyer the right to sell an asset at a fixed strike price within a given time frame.
Example: You buy a put option on Infosys at ₹1,500 strike for a premium of ₹40. If Infosys falls to ₹1,400, you can sell it at ₹1,500, earning profit.
Key Terms in Options
Strike Price: The fixed price at which you can buy/sell the asset.
Premium: The cost you pay to buy the option.
Expiry Date: The last date the option is valid.
In the Money (ITM): When exercising the option is profitable.
At the Money (ATM): When strike price ≈ current price.
Out of the Money (OTM): When exercising the option is not profitable.
3. Why Use Options?
Options are not just for speculation—they serve multiple purposes:
Hedging – Investors use options to protect against unfavorable price moves. Example: Buying puts to protect a stock portfolio against a market crash.
Income Generation – By writing (selling) options like covered calls or cash-secured puts, traders collect premiums and generate consistent income.
Leverage – Options allow control of large stock positions with small capital. For example, buying one call contract is cheaper than buying 100 shares of the stock outright.
Speculation – Traders can take directional bets with limited risk. Example: If you expect volatility, you might use straddle or strangle strategies.
Flexibility – Unlike stocks, options allow you to profit in bullish, bearish, or even sideways markets, depending on the strategy.

Gold & BitCoin (Neowave Forecast)Namaskaram Everyone
Welcome to intelligent investor, we provide market insights by synchronising and combining all the price action waves from different time frames and gives you single trend.
How To Read My Charts...Click Below

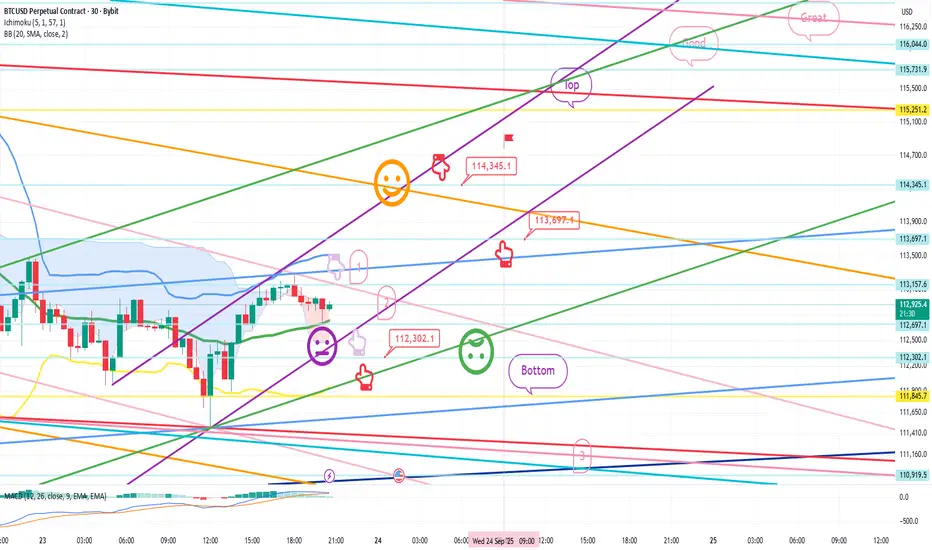
Bitcoin Bybit chart analysis September 23Hello
It's a Bitcoin Guide.
If you "follow"
You can receive real-time movement paths and comment notifications on major sections.
If my analysis was helpful,
Please click the booster button at the bottom.
This is Bitcoin's 30-minute chart.
There's an indicator release near 11:00 AM on the Nasdaq,
and I expected a small fluctuation.
I proceeded as safely as possible, considering the current situation.
*When the red finger moves,
One-way long position strategy:
1. Long position entry point at $112,302.1 / Stop loss price if the green support line is broken.
2. Long position initial target at $114,345.1 -> Target prices in order of Top, Good, Great.
After reaching the target price of $114.3K,
you can re-enter the long position at the indicated price of $113.6K.
In the case of 1->2 above,
there's a strong possibility of an upward movement along the purple parallel line. (The 5+15 pattern is still in place.)
The current rebound has already formed a double bottom,
so a drop below the bottom
is not a good move for long positions.
In case of a delay, I've indicated up to section 3 at the bottom.
Thanks to the recent interest from newcomers,
I've made this post publicly available for the first time in a while.
Please use my analysis for reference only.
I hope you operate safely, with a focus on principled trading and stop-loss orders.
Thank you.
btcusdThe live Bitcoin price today is $112591.42 USD with a 24-hour trading volume of $48834864079.08 USD. We update our BTC to USD price in real-time.
$1,12,588.40
