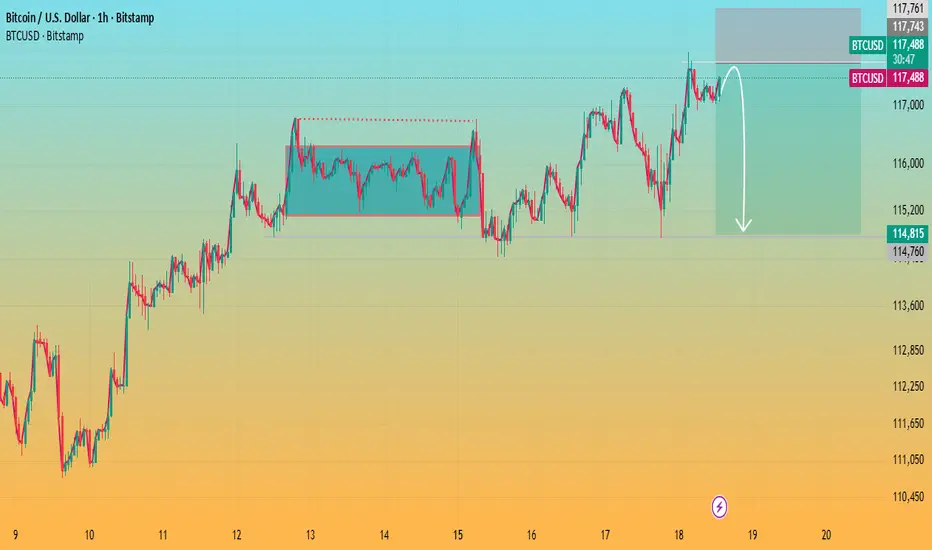
One Last Move This pattern is ideal to understand where price is increasing making higher low
when seen on Graphically representation it looks more like ending diagonal which is popular in the Financial Markets as Pattern suggest the end of ongoing momentum
I have also marked momentum indicator indicating the another one push is likely to occur
This is education content
My Opinion Fresh Buy is bad idea Trail the stop on current holding take profits before its too late
Good luck
Trade ideas

Part 1 Support and Resistance1. Introduction to Option Trading
Option trading is a sophisticated financial instrument used widely in modern markets for hedging, speculation, and portfolio management. Options are derivatives, meaning their value is derived from an underlying asset, such as stocks, indices, commodities, or currencies. Unlike buying or selling the underlying asset directly, options give traders the right—but not the obligation—to buy or sell the asset at a predetermined price within a specific timeframe.
The global options market has grown exponentially, as institutional investors, retail traders, and hedge funds recognize the flexibility, leverage, and risk-management capabilities of options. They are integral to strategies ranging from simple protective hedging to complex arbitrage trades.
1.1 What Is an Option?
An option is a contract that grants its holder certain rights:
Call Option: The right to buy the underlying asset at a specific price (strike price) before or on a specified expiry date.
Put Option: The right to sell the underlying asset at a specific price before or on a specified expiry date.
Unlike futures or forwards, which carry obligations, options give the holder flexibility, making them versatile tools for both risk mitigation and speculative opportunities.
2. Key Terminology in Option Trading
Understanding option trading requires familiarity with certain fundamental terms:
Strike Price: The predetermined price at which the underlying asset can be bought (call) or sold (put).
Premium: The price paid to buy the option. This is influenced by time value, intrinsic value, volatility, and market conditions.
Expiry Date: The date on which the option contract expires and becomes void.
In-the-Money (ITM): An option with intrinsic value (e.g., a call option with a strike price below the current market price).
Out-of-the-Money (OTM): An option with no intrinsic value (e.g., a call option with a strike price above the current market price).
At-the-Money (ATM): An option where the strike price equals the current market price.
Underlying Asset: The financial instrument (stock, index, commodity, or currency) on which the option is based.
Volatility: A measure of the asset's price fluctuations, which directly impacts option pricing.


Bitcoin Market Report – Liquidity Grabs Before Next ExpansionThe market is showing clear signs of engineered volatility, with strong impulsive moves followed by rapid retracements. This behavior reflects liquidity targeting, where price sweeps both sides before resuming its broader path.
Current conditions suggest Bitcoin is in a redistribution stage, with momentum alternating to trap short-term participants. The repeated liquidity grabs signal that larger players are accumulating positions while clearing out weaker hands.
The overall structure points to continued testing of lower liquidity pools before any major directional expansion. Once this phase is complete, the market is likely to enter a more decisive trend, supported by the buildup of institutional flow and reduced volatility pockets.
In short, Bitcoin is cycling through liquidity collection and preparation, positioning itself for a larger move as market balance shifts.

BTCUSD 3R Sell side trade BTCUSD is forming sell side trade as current bias and draw on liquidity both are at down side. Price has also left SIBIs to attract price upside for a while and then return back to target. In weekend price may have low volatility and trade possibly generate on Monday or later.
1. There is a 4H time frame bearish FVG.
2. There is bearish FVG in 1H and 30m overlapping with 4H FVG. Now price is approaching it slowly.
3. These FVGs are forming inside Fib golden zone.
4. Order flow is bearish. And draw on liquidity is also at downside.
5. Most probably price will take liquidity of FVGs and create MSS/CISD/TS/iFVG in LTF.
6. Price should show rejection/reversal in LTF (5m,1m) at FVG zone.
All these combinations are signalling a high probability and 3R trade scenario.
Note – if you liked this analysis, please boost the idea so that other can also get benefit of it. Also follow me for notification for incoming ideas.
Also Feel free to comment if you have any input to share.
Disclaimer – This analysis is just for education purpose not any trading suggestion. Please take the trade at your own risk and with the discussion with your financial advisor.

Part 1 Ride The Big MovesIntroduction to Options Trading
Options trading is a dynamic segment of the financial markets that allows investors to hedge risk, speculate on price movements, and enhance returns. Unlike stocks, which represent ownership in a company, options are financial derivatives—contracts whose value is derived from an underlying asset, such as stocks, indices, commodities, or currencies. By offering flexibility and leverage, options have become a popular tool for both professional traders and retail investors.
What Are Options?
An option is a contract that gives the buyer the right—but not the obligation—to buy or sell an underlying asset at a predetermined price, called the strike price, before or on a specific date known as the expiration date. The seller, or writer, of the option has the obligation to fulfill the contract if the buyer chooses to exercise it.
There are two main types of options:
Call Options – These give the holder the right to buy the underlying asset at the strike price. Investors purchase call options when they expect the price of the underlying asset to rise.
Put Options – These give the holder the right to sell the underlying asset at the strike price. Investors buy put options when they expect the price of the underlying asset to fall.
Key Terms in Options Trading
Understanding options requires familiarity with some key concepts:
Premium: The price paid by the buyer to the seller for the option. This is influenced by factors like the underlying asset price, strike price, time to expiration, volatility, and interest rates.
Strike Price: The price at which the buyer can buy (call) or sell (put) the underlying asset.
Expiration Date: The date on which the option expires. After this, the option becomes worthless if not exercised.
In-the-Money (ITM): A call option is ITM if the underlying price is above the strike price, and a put option is ITM if the underlying price is below the strike price.
Out-of-the-Money (OTM): A call option is OTM if the underlying price is below the strike price, and a put option is OTM if it’s above the strike price.
At-the-Money (ATM): When the underlying price is equal to the strike price.

Bitcoin Testing Resistance with Potential Pullback AheadKey observations:
Range Breakout: Earlier, Bitcoin broke out of a consolidation zone (marked box), which triggered the recent upward move.
Resistance Zone: Price is hovering near the 5.15%–5.42% gain zone, where selling pressure has historically emerged.
Pullback Signal: The drawn arrow suggests a possible rejection at this resistance, pointing to a corrective move down toward the 3% zone.
Momentum Check: If BTC fails to hold above this resistance, a retracement is likely. However, a strong breakout could open the door toward 6% gains.
📌 Conclusion:
Bitcoin is at a decision point. Rejection at resistance could bring a pullback toward 2.8%–3.0%, while a breakout above 5.4% would continue the bullish momentum.

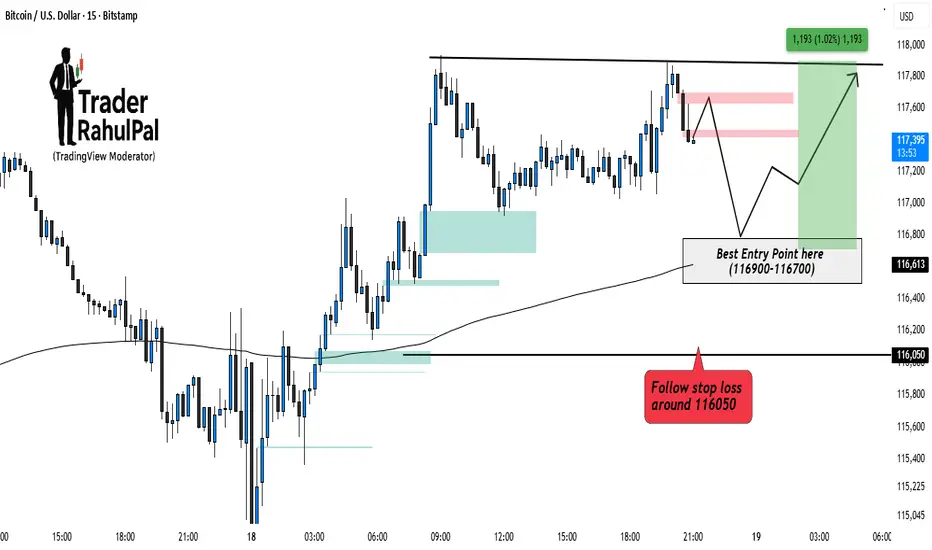
Bitcoin Bullish side Entry Setup Intraday – Key Levels to Watch!Bitcoin is consolidating near its upper resistance zone after a recent bounce. Price action suggests that a pullback into the 116900–116700 range can offer a high-probability entry for buyers. Maintaining a stop loss around 116050 helps to protect against deeper downside risk. As long as this zone holds, the bias remains bullish, with potential upside toward 117800–118000 . Intraday traders should closely watch how price reacts around the entry zone before positioning.
Disclaimer: This analysis is for educational purposes only and should not be taken as financial advice. Please do your own research or consult your financial advisor before investing.
Part 1 Candle Stick Pattern Introduction
Options trading is one of the most versatile and powerful instruments in the financial markets. Unlike traditional stock trading, options allow traders and investors to gain exposure to an asset's price movements without actually owning the asset. Options belong to the derivatives family because their value derives from an underlying asset, such as stocks, indices, commodities, currencies, or ETFs.
Options trading has become increasingly popular in India, the United States, and global markets due to its flexibility, potential for leveraged profits, and ability to hedge risks. Investors use options for speculation, income generation, and risk management, making it a crucial tool in modern portfolio strategies.
Basics of Options
An option is a contract that gives the holder the right, but not the obligation, to buy or sell an underlying asset at a predetermined price on or before a specific date. This differentiates options from futures, where both parties are obligated to execute the contract.
Key terms in options trading:
Underlying Asset: The stock, index, commodity, or currency on which the option is based.
Strike Price: The price at which the option holder can buy (call) or sell (put) the underlying asset.
Expiry Date: The date on which the option contract expires.
Premium: The cost of buying an option, paid by the buyer to the seller.
Intrinsic Value: The difference between the current price of the underlying and the strike price, if favorable to the option holder.
Time Value: The extra value based on the time remaining until expiration and expected volatility.
In-the-Money (ITM), At-the-Money (ATM), Out-of-the-Money (OTM): Terms used to describe an option’s profitability status.
Options provide flexibility, allowing investors to profit from rising, falling, or sideways markets, depending on the chosen strategy.

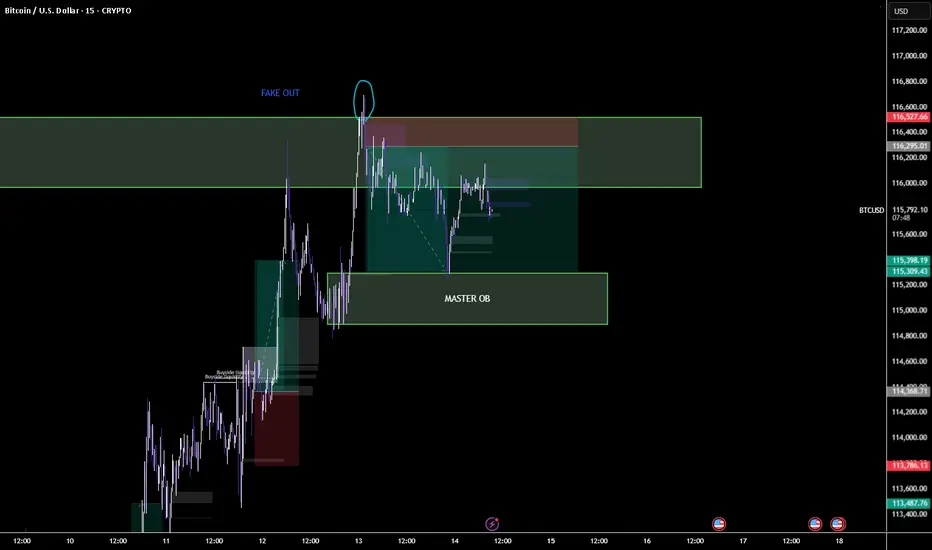
BTCUSD - Fakeout Trap & Master Order Block Setup
BTCUSD – Fakeout Trap & Master Order Block Setup
Price executed a clean **fakeout above liquidity** before dropping back into the **master order block zone**. This setup shows how liquidity hunts trap late buyers before respecting key OB demand. Watching for reaction from the **115.3k zone** to decide next directional move.
Part 8 Trading master ClassWhy Trade Options?
Options are popular because of their flexibility. They can serve multiple purposes:
Hedging (Insurance)
Just like insurance, options protect against downside risk.
Example: Buying a put option to protect your stock holdings.
Speculation (Profit from Price Movements)
Traders use options to bet on direction, volatility, or even stability of prices.
Income Generation
Selling covered calls or cash-secured puts generates steady premium income.
Leverage
Options allow large exposure with smaller capital compared to stocks.
How Options Work: Pricing
Option pricing is complex, but two main values exist:
Intrinsic Value → Difference between stock price and strike (if favorable).
Time Value → Extra value based on time left till expiry and expected volatility.
Example:
Stock = ₹1,000
Call strike = ₹950, Premium = ₹70
Intrinsic = ₹1,000 – ₹950 = ₹50
Time Value = ₹20
Options Market Structure
The options market involves:
Buyers of Options – Limited risk (premium), unlimited potential reward.
Sellers (Writers) of Options – Limited reward (premium), potentially high risk.
Exchanges (like NSE in India, CBOE in US) – Standardized contracts.
Clearing Corporations – Ensure smooth settlement, reduce counterparty risk.

Part 7 Trading master ClassIntroduction to Options Trading
Financial markets offer countless opportunities for investors and traders to grow wealth. Among them, options trading stands out as one of the most versatile, powerful, and misunderstood tools. Options can help protect a portfolio from risk, generate extra income, or allow a trader to speculate on price movements with limited upfront capital.
At its core, options trading is about making calculated decisions on probabilities — the probability of a stock rising, falling, or staying stable. While stocks represent ownership in a company, options are contracts that give special rights tied to those stocks (or other assets).
Before diving deep, remember this: options are not inherently risky. Misuse of options is risky. With the right understanding, options can be a trader’s best friend.
Basics of Options
What is an Option?
An option is a financial contract that gives the buyer the right (but not the obligation) to buy or sell an underlying asset (like a stock, index, or commodity) at a predetermined price (strike price) before or on a certain date (expiry date).
Two main types exist:
Call Option → Right to buy the underlying at strike price.
Put Option → Right to sell the underlying at strike price.
The buyer pays a fee, known as the premium, to acquire this right.
Example:
Stock: Reliance Industries trading at ₹2,500
You buy a Call Option with strike ₹2,600, expiring in 1 month, premium ₹50.
If Reliance rises to ₹2,700 before expiry:
You can buy at ₹2,600, sell at ₹2,700, and profit (₹100 – ₹50 = ₹50 per share).
If Reliance stays below ₹2,600:
The option expires worthless, and you lose only the premium (₹50).
Key Terms
Strike Price → Fixed price at which option can be exercised.
Expiry Date → Last date to exercise the option.
Premium → Cost of buying the option.
Lot Size → Minimum quantity per option contract.
In the Money (ITM) → Option has intrinsic value.
Out of the Money (OTM) → Option has no intrinsic value.
At the Money (ATM) → Strike price is close to current market price.

How Smart Liquidity Shapes Price Movements1. Understanding Liquidity in Trading
Liquidity refers to how easily an asset can be bought or sold without causing a significant change in its price. In a highly liquid market, a trader can enter or exit a position quickly at the desired price. In illiquid markets, even small orders can create sharp price movements.
High liquidity: Stocks like Apple, Amazon, or Nifty 50 stocks.
Low liquidity: Small-cap stocks or exotic cryptocurrencies.
Liquidity affects price stability, volatility, and order execution. Traders often think price moves purely based on supply and demand, but liquidity tells the deeper story: prices move where liquidity exists.
2. Who Controls Smart Liquidity?
Smart liquidity is usually controlled by:
Institutional investors: Banks, hedge funds, mutual funds.
Market makers: Entities that provide liquidity by continuously quoting buy and sell prices.
High-frequency trading (HFT) firms: Using algorithms to detect and exploit liquidity.
Large retail players with significant capital.
These participants often have more information, better technology, and strategic motives, enabling them to move markets subtly without causing abrupt price swings.
Key point: Smart liquidity is not random; it is strategically placed where it can create maximum impact on price.
3. Types of Liquidity
Understanding liquidity types is essential for spotting smart money activity:
a) Visible Liquidity
Orders you can see in the order book. For example:
Limit orders displayed at certain price levels.
Market depth showing buy/sell interest.
b) Hidden Liquidity
Orders that are not visible to the general market. This can include:
Iceberg orders: Large orders split into smaller visible chunks.
Hidden institutional positions built slowly to avoid moving price drastically.
c) Imbalance Liquidity
Occurs when buy orders far exceed sell orders (or vice versa). Smart money exploits these imbalances by pushing prices to areas where retail stops are placed.
4. How Smart Liquidity Moves Prices
Smart liquidity shapes price movements through accumulation, manipulation, and distribution:
a) Accumulation
Smart money accumulates positions at low prices without triggering panic or retail selling.
This is often seen in a consolidation phase or a “range” where prices appear to be moving sideways.
Retail traders often miss this because there is no clear breakout yet.
Example:
A stock trades between ₹100–₹105. Smart money gradually buys large quantities at ₹100–₹102. Price doesn’t rise immediately because selling pressure absorbs the buying, but once accumulation is sufficient, a breakout occurs.
b) Manipulation
Smart money intentionally creates liquidity traps to force retail traders into making mistakes.
This includes stop-hunting, where price briefly dips below support levels to trigger stop-loss orders, providing liquidity for smart money to buy.
Example:
Price of a currency pair is at 1.3450, and many retail traders have stop-loss at 1.3440. Smart money pushes price to 1.3438, triggering retail stops, and then price rises as smart money has acquired positions at lower levels.
c) Distribution
Once positions are large enough, smart money starts selling into strength.
Retail traders often buy late, thinking the uptrend is endless, providing liquidity for smart money to exit.
Example:
After a strong uptrend, institutional traders start selling gradually around ₹120–₹125 while retail traders keep buying. Eventually, the stock reverses, leaving late buyers trapped.
5. Recognizing Smart Liquidity Zones
Smart money typically operates around key price levels. Recognizing these zones helps traders anticipate future movements.
a) Support and Resistance Levels
These are areas where price historically reacts.
Smart liquidity is often hidden just beyond these levels (e.g., a stop-loss cluster).
b) Liquidity Pools
Liquidity pools are areas with a concentration of pending orders.
Smart money often targets these pools to acquire or offload large positions without creating abrupt volatility.
c) Order Book Analysis
Watching the depth of market (DOM) and level 2 order book can reveal where liquidity resides.
Sudden appearance or disappearance of large orders often signals smart money activity.
6. Smart Liquidity in Trend Formation
Price trends are not purely driven by news or fundamentals. They are largely engineered by liquidity flows:
Uptrend: Smart money absorbs selling pressure at lower levels and pushes price upward when liquidity dries out.
Downtrend: Smart money sells gradually into rallies while retail buys impulsively.
Sideways trends: Smart money accumulates or distributes positions while retail chases minor price movements.
7. Tools and Techniques to Detect Smart Liquidity
a) Volume Analysis
Unusual spikes in volume often indicate smart money activity.
Clues: High volume at support/resistance without significant price movement suggests accumulation or distribution.
b) Candlestick Patterns
Long wicks often show liquidity sweeps (stop-hunting) by smart money.
Patterns like pin bars and inside bars around key levels are often liquidity-driven.
c) Market Structure
Smart liquidity targets weak points in market structure: swing highs/lows, breakouts, and fake breakouts.
Recognizing these allows traders to anticipate reversals or continuations.
d) Footprint and Order Flow Charts
Advanced tools that track real-time buy/sell imbalances.
Helps traders see where institutional orders are entering/exiting.
8. Liquidity and Stop-Hunting
Stop-hunting is one of the most famous tactics of smart liquidity:
Retail traders place stops near obvious levels.
Smart money triggers these stops to create temporary volatility.
Once stops are triggered, price moves in the intended direction as smart money executes trades.
Example:
Stock support at ₹50.
Retail stops at ₹49.80.
Price dips to ₹49.78, triggers stops → liquidity provided → smart money buys → price rises.
Conclusion
Smart liquidity is the invisible hand that shapes price movements in every market. While retail traders often focus on visible price action, smart liquidity analysis allows you to understand why price moves, not just where. By identifying accumulation, distribution, stop-hunting, and liquidity zones, traders can align their strategies with the forces driving the market.
The most successful traders don’t fight smart money—they follow liquidity, entering when smart money enters and exiting when it exits. Understanding smart liquidity isn’t just a technical skill; it’s a market intuition built through observation, patience, and practice.
Price is a reflection of liquidity, and liquidity is the language of smart money. Master this language, and you can navigate markets with greater confidence, precision, and profitability.
BTCUSD 4.5R sell side beautiful scenarioBTCUSD is in range from last 5 days but now it is showing Smart Money’s interest. And it appears a down side trade is being developed as it has swept upside liquidity and forming CISD after displacement.
1. It has taken upside liquidity.
2. Formed CISD after displacement.
3. It has formed FVG and BPR on 1h time frame and price is inside POI.
4. POI is created inside OTE zone confirming good RnR.
5. Most probably price will take liquidity of FVG and OTE zone and create MSS/TS in LTF.
6. Price should show rejection/reversal in LTF (5m,1m) at FVG zone.
All these combinations are signalling a high probability and 4.5R trade scenario.
Note – if you liked this analysis, please boost the idea so that other can also get benefit of it. Also follow me for notification for incoming ideas.
Also Feel free to comment if you have any input to share.
Disclaimer – This analysis is just for education purpose not any trading suggestion. Please take the trade at your own risk and with the discussion with your financial advisor.

BITCUSDALWAYS TAKE TRADE WITH CONFIRMATION
Note : Trading in any financial market is very risky. I post ideas for educational purpose only. It is not financial advice. Do not hold us responsible for any potential loss you may incur. Please consult your financial adviser before trading.

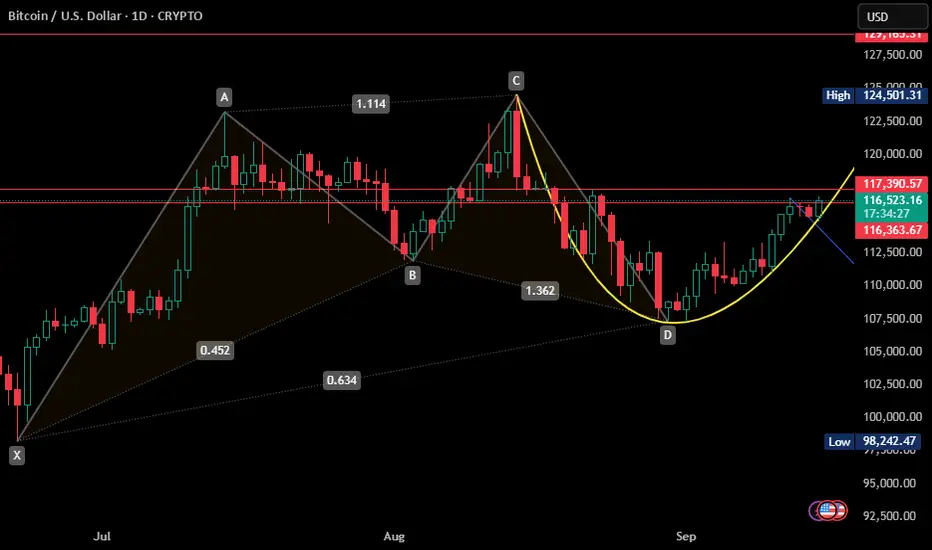
BTC COMLETED BAT PATTERN & FORMING ROUNDING BOTTOMBTC day chart shows that BAT PATTERN is completed now it is forming rounding bottom,But it will go for breakout when previous high get broken which is marked by two red lines as resistance.
after sustaining abov this two resistances it may confirm that it will go to test all time high.
this isnot my buy/sell call.
BTC/USD 15/09/2025: Bullish Potential Pre-Fed DecisionMarket Overview: Steady with Huge Potential
Bitcoin remains the king of crypto with a market cap of 2.31 trillion USD, dominating the space. The 24-hour trading volume is at 33.29 billion USD (+4.72%), showing decent buying interest but not enough for a massive rally yet. With only 19.92 million BTC circulating (94.86% of the 21 million total supply), there’s low inflationary pressure, which is great for long-term value. Can BTC keep its 92.27% yearly gain? Drop your thoughts in the comments below! 📊
Technical Analysis: Double Bottom and Bullish Channel Looking Hot
Support & Resistance: Strong support at 114,000 - 115,000 USD (holding since early September). Resistance is at 116,000 - 116,500 USD—break this, and we could see 120,000 USD next! If it fails, expect a retest of 114,000 USD. Watch for a breakout, traders! ⚠️
Trend: The chart shows a double bottom pattern from September’s low, with the bullish channel still intact. The Fear & Greed Index is at 53-55 (Neutral), meaning no one’s panicking or getting too excited. RSI is neutral, MACD is slightly soft, but the daily timeframe screams “Buy”! 📉
Macro News & Triggers: Fed Decision to Steal the Show?
The market is glued to the Fed’s expected 0.25% rate cut this week—if it happens, risk assets like Bitcoin could see a flood of cash! 🌊 On the bullish side: Billionaire Tim Draper is pushing for BTC adoption, predicting 250,000 USD by December 2025, and Capital Group turned a 1 billion USD investment into 6 billion USD profits. But watch out for whale selling and weak altcoins (like SHIB, down 3.22%)—they could drag BTC lower. Ready for some volatility? 🔥
Forecast & Trading Strategy: Your Game Plan
Short-Term (1-7 Days): BTC likely to trade between 114,000 - 117,000 USD, with the Fed as the big trigger. A rate cut could push it to test 120,000 USD; if not, it might dip to 114,000 USD. There’s a 60% chance of an upside if it holds above 115,000 USD—perfect for a long trade! 📈
Long-Term (2025-2030): Super bullish! Changelly predicts 116,220 USD today, rising to 117,978 USD tomorrow; Investing Haven sees stability around 116,087 USD. With the last halving and institutional buying, BTC could smash past 200,000 USD by year-end. But diversify your portfolio to stay safe! 💡
Fellow traders, it’s time to make your move! Keep the BTC/USD chart open on TradingView and share your predictions in the comments. Do your own research (DYOR) and trade smart! 🙌
#Bitcoin #BTCUSD #CryptoAnalysis #TradingView #FedRateCut #BullishBTC #Crypto2025 #Altcoins #WhaleWatch #FearAndGreed

Btc/usd 4h analysis Bitcoin has broken above the descending trendline from August and is now consolidating near the 115,000 zone. Price action suggests a shift in momentum towards the upside, supported by the series of higher lows forming since early September.
Key Resistance: 115,700 – 116,400.
Support Levels: 114,700 → 112,900 → 111,800 → 110,150.
Trendline: Rising trendline providing support, keeping structure bullish in the short-term.
RSI (14): Currently at 56, holding above the 50 level → indicates bullish momentum remains intact, though slightly cooling from recent highs.
🔑 Trading Plan
Bullish Bias: As long as price holds above 114,700 and the rising trendline, next upside targets sit at 116,400 and 118,000.
Bearish Scenario: A close below 114,700 + RSI under 50 could open the way for a deeper retracement towards 112,900 – 111,800.

btcbearish crossover occurs when the MACD line crosses below the signal line. This indicates a potential shift to downward momentum, especially if it happens above the centerline

BTC Next Move - Bearish or Bullish “The coming week brings a major FED announcement. JP Morgan has already warned that a rate cut could drag markets down, viewing it as a politically driven move. But beyond predictions, the charts are worth watching—Gold has already broken out of its accumulation zone, and now the question is whether Bitcoin can follow the same path.”

BTCUSD | Buy & Sell Setup | 14 Sep 2025 – 10:58 ISTBTCUSD | Buy & Sell Setup | 14 Sep 2025 – 10:58 IST
Buy Zone: 116094.90 – 115961.20
Sell Zone: 115694.50 – 115411.20
Scenario : Buy
Entry: 115975.00
Stop Loss: 115690.00
Targets:
TP1 → 116257.50
TP2 → 117000.00
Analysis:
From Buy Zone (116094.90 – 115961.20) creates possibilities for a buy move.
Scenario 2 : Sell
Entry: 115690.00
Stop Loss: 115975.00
Targets:
TP1 → 114698.00
TP2 → 113370.00
Analysis:
From Sell Zone (115694.50 – 115411.20) creates possibilities for a sell move.
Stay alert on updates here.
⚠️ Disclaimer: This idea is shared for educational purposes only and should not be considered financial advice. Please do your own analysis before making trading decisions.

btc shortCertain candlestick patterns can offer immediate clues for potential reversals, though they are best used with other indicators. Examples include the Evening Star pattern.
