Be alert ? BTC behave different scenerioAfter halving BTC has approached maximum of 518 days last 2 bull run out of 3. This time scenarios showing different theory. so don's belief bilndly. BTC future are above $1M as predicted but if we are going to Bear Market then atleat 1.5 year should be long days.
So be alert
Trade ideas

BTCUSD – Updated Technical AnalysisPrice broke $81,795 (0.236 Fib) with strong bearish candles.
This confirms continuation of the downtrend, not a temporary dip.
RSI continuously making lower highs
RSI is now near oversold zone but not yet reversed
Strong Support 1: $78,000 – $76,500
Strong Support 2: $72,000 – $70,000
Harmonic / Trendline Final Support: $68,200
BTC is currently:
Below trendline
Below EMA(s)
Below 0.236
RSI in a strong downtrend
Lower lows forming
BTC is in a clear downtrend. It just broke a major support level RSI is also trending down strongly No bullish signals yet The next major reversal zone is $72k–$68k.
Disclaimer- All information provided is for educational and informational purposes only.
Crypto markets are highly volatile, and any trading or investing decision you make is strictly at your own risk. Always conduct your own research (DYOR) and consult with a qualified financial advisor before making any financial decisions.

Bitcoin Bybit chart analysis November 20Hello
It's a Bitcoin Guide.
If you "follow"
You can receive real-time movement paths and comment notifications on major sections.
If my analysis was helpful,
Please click the booster button at the bottom.
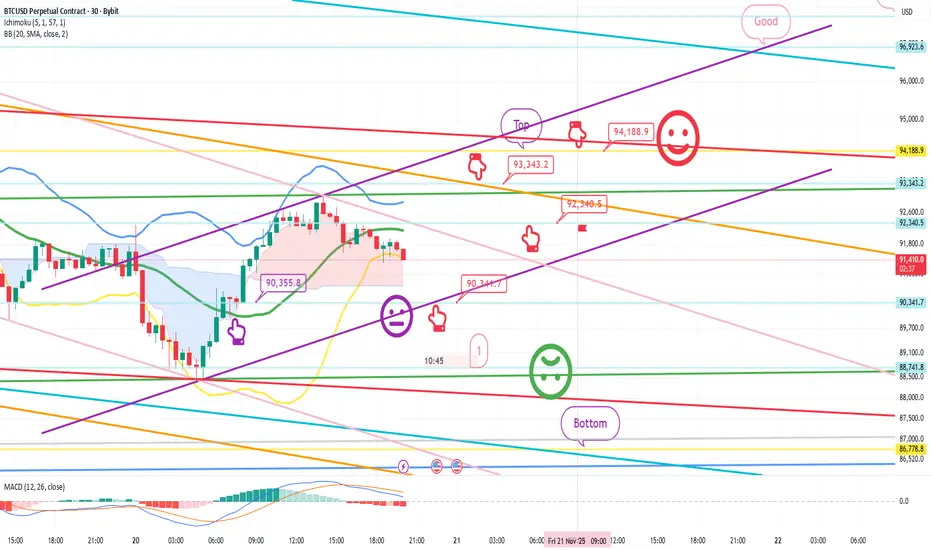
Here's a Bitcoin 30-minute chart.
Shortly, at 10:30 AM and 12 PM, the Nasdaq indicators will be released.
At the bottom left, the purple finger indicates the final long position entry point on the 19th, at $90,355.8. I've linked the strategy to that level.
The bottom area at the bottom is what I consider to be the major support line for this week.
(The center line of the Bollinger Bands monthly chart has moved from the previous $87,665.3.)
Everyone knows this and is waiting for it.
In my experience, if you wait at the bottom,
it generally doesn't come down easily. + Nasdaq volatility
Of course, we'll have to watch today's movement,
but please watch until the very end.
Because today could be a day with a significant move,
I kept my strategy as safe and simple as possible.
*Red Finger Movement Path:
One-Way Long Position Strategy
1. $90,341.7 long position entry point / Stop loss price if the purple support line is completely broken
2. $93,343.2 long position primary target -> Top, Good target price in that order
If the strategy is successful, you can utilize the 92.3K long position re-entry point indicated.
Since the 4-hour Bollinger Bands are repeatedly hitting the center line,
barring a sharp decline in the Nasdaq,
it is poised for a strong upward trend.
Note that the first point at the bottom is a double bottom.
If it falls to this level,
it is more likely to reach the bottom than to rebound.
Today, the Nasdaq and Bitcoin must move as far upward as possible to avoid falling to 86.7K this week. In the event of a weak sideways movement or correction,
I recommend keeping the bottom open until 9:00 AM next Monday.
Please use my analysis to this point for reference only.
I hope you operate safely, with a clear focus on principled trading and stop-loss orders.
Thank you.
Bitcoin is in a clean daily downtrend right nowBitcoin is in a clean daily downtrend right now – every bounce is just providing fuel for the next leg until the structure says otherwise.
Good evening traders, Brian here with a higher-timeframe look at BTCUSD.
Fundamental analysis
Bitcoin has been under sustained pressure even as some funds continue to accumulate spot positions. A few key points:
Macro uncertainty and tighter dollar liquidity are weighing on high-beta assets. While gold has held up relatively well, the performance gap between BTC and XAU has been widening in recent weeks, highlighting a clear risk-off tone towards crypto.
On-chain and fund flows suggest that a number of crypto investors are actually de-risking and pulling capital out, which reduces market depth and makes downside moves more violent when liquidity is thin.
Narrative is still mixed: long-term holders and some institutions are happy to buy lower, but in the short term the order flow is dominated by forced selling, deleveraging and risk reduction.
Bottom line: the macro backdrop does not yet justify an aggressive “buy the dip” approach on BTC. Trend-following shorts remain safer than trying to call the bottom.
Technical analysis
Daily structure is clearly bearish:
We have a confirmed market structure shift on the left of the chart, with the prior higher-low support broken and a series of decisive lower lows since then.
The main bullish trendline from earlier in the year has given way, and price is now travelling within a steep descending leg.
BTC recently tagged the 1.618 Fibonacci extension of the last major swing, aligning with a prior liquidity pocket. That produced a sharp intraday bounce, but so far it looks like a reaction inside a downtrend, not a full reversal.
Around 75.4k we have an important daily support zone. If this level is broken and accepted below, it opens the door to a deeper flush towards the next large support band lower on the chart.
Overhead, there is a clean imbalance/FVG and prior distribution area around 108k, with an intermediate resistance block around 96–97k and a nearer supply zone around 88k. These are prime locations to look for fresh shorts if price retraces.
For now my bias is simple: look to sell rallies into premium levels; any longs are tactical, short-term trades off key support only.
Key levels
Resistance / short zones:
88,000 – first reaction zone, “pay attention to the reaction”
96,500–97,200 – main short entry area for medium-term positions
108,000 – higher FVG / major daily supply
Support / long-only intraday zones:
75,400 – key support + 1.618 Fib/liquidity zone
74,000–72,000 – deeper support if 75.4k fails
Trade scenarios (for reference, not financial advice)
1. Short the first meaningful pullback – 88k area
Entry: 88,000
Stop: 90,000 (above local structure)
Targets: 82,000 → 78,000 → 75,500
Idea: treat 88k as the first supply zone in a downtrend. If price bounces from current levels and stalls here, I’m looking for rejection (wick rejections, failed break, or a clear shift in intraday structure) to join the trend. Once price moves in favour, I would look to pull the stop to breakeven and let the position run.
2. Core swing short – 96.5k–97.2k zone
Entry: 96,500–97,200
Stop: 99,000
Targets: 88,000 → 82,000 → 75,500
This is my preferred “medium-term” sell area. It aligns with a more significant daily supply block and offers better risk–reward if the larger bearish leg continues. Any squeeze into this region after a series of lower lows is, in my view, a controlled opportunity to reload shorts.
3. Tactical long only at deep support
Entry: 75,400–74,800
Stop: 73,800
Targets: 82,000 → 88,000
Here I would only consider a short-term long if we see a clean liquidity sweep into the 1.618 extension and strong rejection (long lower wicks, aggressive buy-back). The idea is simply to trade the bounce back into resistance, not to fight the higher-timeframe downtrend.
If BTC loses 75.4k and starts closing below it on the daily, I would become much more cautious on any long exposure and focus almost entirely on short setups towards the lower “important support” zone on the chart.
Trade with the trend, respect your risk, and don’t get trapped trying to be a hero at the bottom of a falling market.
If this BTC breakdown adds value to your plan, make sure you follow Brian for more daily BTC and gold analysis, and share your own view in the comments so we can compare scenarios.

BTC strong down trend and high RnR sell scenario..BTC is in strong down trend and broke ~ 90K level and targeting further downside levels of 82K and 75K. Price is continuously forming lower highs and BoS. Price has formed a BOS on hourly chart and approaching 1h FVG. We may expect a rejection pattern in LTF inside FVG and further downfall.
1. Price is in strong down trend and formed 1H FVG after creating BOS.
2. FVG is formed on weekly quadrant level, making it more significant,
3. Price is now approaching FVG
4. Most probably price will take liquidity of FVG/RDRB level and create MSS/CISD/TS/iFVG in LTF.
5. Price should show rejection/reversal in respective LTF (5m/15m) at FVG zone.
6. Take the trade only once clear entry model i.e. turtle soup. iFVG break, CDS or MSS happens on LTF
All these combinations are signalling a high probability and ~8R trade scenario.
Note – if you liked this analysis, please boost the idea so that other can also get benefit of it.
Also follow me for notification for incoming ideas.
Also Feel free to comment if you have any input to share.
Join me on live stream for real time update.
Disclaimer: This analysis is for educational purposes only and does not constitute investment advice. Please do your own research (DYOR) and check with your financial advisor before making any trading decisions.

Part 12 Trading Master Class With ExpertsMoneyness of Options
Options are classified as:
In the Money (ITM)
At the Money (ATM)
Out of the Money (OTM)
Call Options
ITM: Stock price > Strike price
ATM: Stock price = Strike price
OTM: Stock price < Strike price
Put Options
ITM: Stock price < Strike price
ATM: Stock price = Strike price
OTM: Stock price > Strike price
Moneyness affects premium value, risk, and probability of profit.

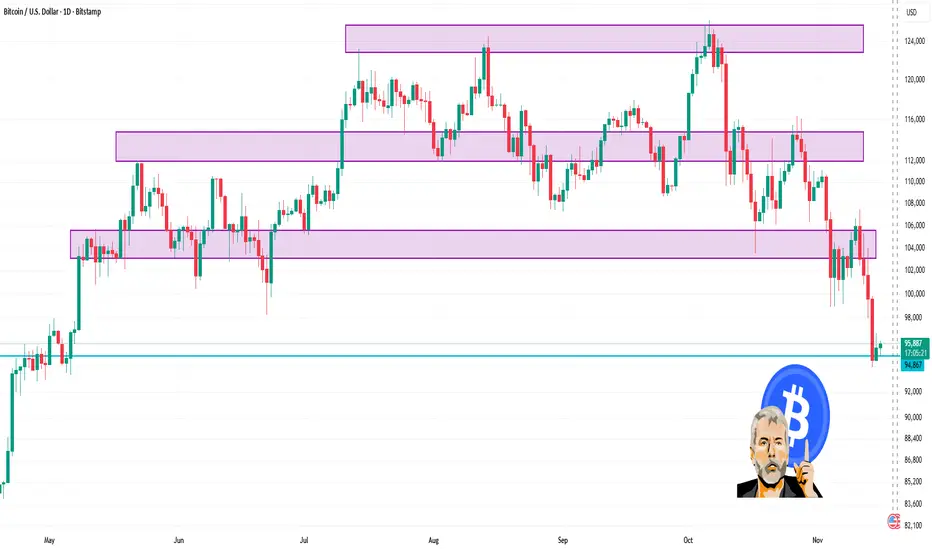
Bitcoin at Support: Bounce Likely, Trend Still WeakBitcoin has been sliding steadily and has now broken its first major support near 103k. The latest drop completed a clear A-B-C decline, with the final C-wave forming an ending diagonal — a pattern that often signals exhaustion at the end of a move. That’s why the selling pressure slowed as price entered the current demand zone.
Oversold Conditions
The RSI on the daily chart has dropped into deeply oversold territory. This is typically where Bitcoin produces a reaction bounce. It doesn’t confirm a trend reversal, but it does hint that sellers may pause.
What Happens Next
A corrective bounce — the X-wave — is the most reasonable expectation. However, X-waves are usually messy and uneven, not clean rallies.
The key area to watch is 100k–103k .
If Bitcoin cannot reclaim this zone, the larger corrective structure remains in control.
Bigger Picture
The moving averages support this caution. The 50-day and 200-day MAs are close to forming a death cross, which signals weakening short-term momentum relative to the long-term trend. It doesn’t imply a crash, but it does suggest that any bounce may face resistance.
If the X-wave fails below 103k, the next leg — the Y-wave — could drive price toward the larger support region around 72k–75k.
In Summary
The decline looks structurally complete, ending with an ending diagonal.
RSI is deeply oversold -> a corrective bounce is likely.
100k–103k is the make-or-break zone.
Failure to reclaim it keeps the W-X-Y correction active.
The final support zone sits lower, near 72k–75k.
A bounce may come first, but the broader structure still leans bearish unless key resistance levels are regained.
Disclaimer: This analysis is for educational purposes only and does not constitute investment advice. Please do your own research (DYOR) before making any trading decisions.

BITCOIN looking for some pull backIt appears A,B,C, major correction is done.
However some concerns.
C wave is not touched the lower line of the channel.
and minor waves indicating still 5 th wave of C wave is pending
immediate target of Bitcoin 94700 tom94900
like this post if it helps ypu.
follow me to get up dates

BTC 1 Day Time Frame 🔍 Price snapshot:
1. It’s trading in the vicinity of ~US$95,900 (as per latest data) per coin.
2. Daily range (roughly) sits between ~US$94,800 and ~US$96,400 (depending on source).
3. Technical summary on the daily timeframe is leaning toward a “Strong Sell / Sell” bias per one analytics page.
📌 Key levels to watch (daily chart):
1. Support zone: Around the US$94,000–95,000 area (recent lows)
2. Resistance zone: Around the US$100,000 + region (psychological + prior highs)
3. Because the data shows price trading below ~US$100,000 and bouncing near US$95,000, the latter areas act as important anchors.
BTC at strong support levelBTC seems to have completed wave E of an expanding triangle.
-- EXPANDING TRIANGLE--
Wave E is generally equal to (101-161.8)% of Wave C.
In rare cases it could also be equal to 261.8% of Wave A or Wave C
---------------------------------
Wave E is already equal to twice of wave C and if it sustains above ~93,800, we could expect an upside from here.
Will keep you guys posted as the move progresses.
HAPPY TRADING !!

BTCUSD WHY MOVE UP- ANALYSIS ?BTCSUSD
*Took the buy side trade. on basis of multitime frame.
* 4 hr -ve poi and 1hr -ve poi become +ve poi once BTCUSD move upside without respect
4hr -ve poi.
* Once BTCUSD reached @ 1hr -VE POI.
*we drew Fibo, got discount zone , where 1hr +ve poi and 15 mins FVA present.
*Trade with good R:R.
*There was no obstacle to move upside
thats it for this trade .see ya in next trade with proper logic.

AI Trading Profits1. What Is AI Trading?
AI trading refers to the use of machine learning models, algorithms, and automation to analyze markets, predict price movements, and execute trades. Unlike traditional trading, where decisions depend on human judgment, AI uses data patterns to make logical, emotion-free decisions.
AI trading systems usually combine:
Machine Learning Models
Neural Networks
Natural Language Processing (NLP)
High-frequency trading (HFT) algorithms
Automated execution engines
These systems can scan thousands of indicators, news events, and market variables in seconds — something that is impossible for a human trader.
2. How AI Trading Generates Profits
AI earns profits primarily through accuracy, speed, pattern recognition, and disciplined execution. Let’s break it down:
a) Predictive Accuracy
AI systems analyze past price action, volume, volatility, order flow, sentiment, and macro data to forecast short-term or long-term price movements.
Profits are generated when AI predicts:
Trend continuation
Trend reversal
Breakouts
Market structure shifts
High-probability entry and exit points
A well-trained AI model can identify winning setups with higher precision than manual analysis.
b) Speed and Efficiency
Markets move fast — especially in intraday or high-frequency trading.
AI reacts in microseconds, allowing it to:
Enter and exit trades before retail traders react
Capture small price inefficiencies
Take advantage of rapid sentiment changes
This speed gives AI a competitive edge that converts directly into profits.
c) Removing Human Emotions
Human traders often suffer from:
Fear
Greed
Overtrading
Emotional reactions
Confirmation bias
AI avoids all emotional biases.
Once trained, it follows logic-based rules, improving consistency and profitability.
d) 24/7 Market Monitoring
AI never sleeps.
It continuously scans market conditions, technical signals, global news, and sentiment changes.
This constant monitoring allows AI to:
Identify opportunities instantly
Avoid bad trades
React faster to volatility
The result? More accurate trades and higher profit probability.
e) Backtesting and Optimization
Before trading live, AI models test strategies on historical data.
This process includes:
Validating accuracy
Measuring risk-reward
Fine-tuning indicators
Eliminating unprofitable setups
Backtesting ensures that only statistically profitable strategies go live.
3. AI Trading Strategies Used for Profit
AI can be deployed in multiple trading styles. Each strategy targets different types of profits:
**1. Trend-Following Algorithms
AI identifies strong bullish or bearish trends early and rides them until the trend weakens.
It predicts:
Higher highs/lows
Momentum strength
Trend exhaustion
Profits come from capturing major directional moves.
**2. Mean Reversion AI Models
AI detects when prices deviate too far from their average (mean).
It forecasts when price is likely to:
Bounce
Revert back
Correct after overbuying/overselling
Profits come from short-term rebounds.
**3. Breakout and Breakdown Detection
AI is excellent at spotting breakout patterns before they occur.
It analyzes:
Volume spikes
Liquidity clusters
Pressure zones
Market structure
Profits come from sharp moves after a breakout or breakdown.
**4. High-Frequency Trading (HFT)
HFT uses ultra-fast algorithms to profit from small price changes.
AI helps:
Detect micro-patterns
Execute instantly
Create thousands of tiny profitable trades
This strategy generates small but consistent profits.
**5. Arbitrage Trading
AI identifies price differences between:
Exchanges
Brokers
Markets
Derivatives vs spot
It instantly buys low and sells high, locking in risk-free profits.
**6. Sentiment Analysis-Based Trading
AI uses NLP to scan:
News
Social media
Analyst reports
Earnings updates
Economic data
It converts sentiment into actionable trades.
Example: detecting early negative sentiment before a stock falls.
**7. Options AI Trading
AI is widely used in options due to complex pricing dynamics.
It predicts:
Implied volatility
Premium movement
Option Greeks shifts
Probability of strike price touching
Profits come from precision in volatility forecasting.
4. Why AI Trading Is So Profitable
1. Pattern Detection Beyond Human Capability
AI sees patterns in data that humans can’t detect.
2. Ability to Process Massive Data
Millions of data points are processed per second.
3. Discipline and Consistency
AI stays consistent in all market conditions.
4. Lightning-Fast Execution
AI acts instantly when price levels hit.
5. Adaptability
AI models adjust to changing market conditions by retraining or rebalancing strategies.
5. Real-World Examples of AI Trading Profitability
Hedge Funds
Many funds using AI (e.g., Renaissance Technologies, DE Shaw) have generated billions in returns, outperforming traditional traders.
Banks
J.P. Morgan, Goldman Sachs, and Citi use AI to improve:
Risk models
Trade execution
Market predictions
Retail Traders
With AI bots and automated systems, retail traders can:
Avoid emotional mistakes
Trade professionally
Increase win rate
6. Risks and Limitations of AI Trading
Even though AI can be highly profitable, it is not foolproof.
Risks include:
1. Overfitting
Model becomes too dependent on past data and fails in live markets.
2. Black Swan Events
AI struggles during unexpected market crashes.
3. Data Quality Issues
Wrong data = wrong predictions.
4. High Cost of Development
Reliable AI models require:
Huge data sets
Expensive training
High computational power
5. Excessive Confidence
Believing AI is 100% accurate can lead to unnecessary risk.
7. Final Summary
AI trading generates profits by:
Predicting market movements with high accuracy
Executing trades at lightning speed
Eliminating emotional decisions
Continuously learning and adapting
Identifying micro-patterns invisible to humans
While it can be extremely profitable, success depends on good strategy, quality data, and proper risk management.

BTC Swing 8R reversal scenario....BTC moved as per our plan throughout last 10-15 days and crashed to ~ 90K levels, now it has reached to its critical level of reversal, which is weekly FVG CE area. Price has already shown change in delivery at 4H level. All these making it a really good contender for a long swing trade which may even lead to all time high.
1. Price has tested CE of weekly strong FVG and formed CISD at 4-hour level.
2. Now it is testing CISD imbalance area to form proper entry model…
3. We may wait for MSS to occur in this area in 15 minutes for more precise entries.
4. Most probably price will take liquidity of FVG/RDRB level and create MSS/CISD/TS/iFVG in LTF.
5. Price should show rejection/reversal in respective LTF (5m/15m) at FVG zone.
6. Take the trade only once clear entry model i.e. turtle soup. iFVG break, CDS or MSS happens on LTF
All these combinations are signalling a high probability and ~8R trade scenario.
Note – if you liked this analysis, please boost the idea so that other can also get benefit of it.
Also follow me for notification for incoming ideas.
Also Feel free to comment if you have any input to share.
Join me on live stream for real time update.
Disclaimer: This analysis is for educational purposes only and does not constitute investment advice. Please do your own research (DYOR) and check with your financial advisor before making any trading decisions.

Bitcoin ShortBTC/USD – Multi-TF Bias & Current Price Action Analysis
✅ 1. Multi-Timeframe Bias Summary
Weekly → Bearish
Daily → Bearish
4H → Bearish
2H → Bearish
1H → Bearish
30min → Bearish
15min → Bullish
rice Structure on Your Chart
Current Price: around $92,091
You have marked a red zone above price which looks like:
🔴 Supply / Resistance Zone – $93,000 to $95,000
This zone has:
Previous swing failure
Break of structure from this level
Heavy selling wick rejections
This means:
📌 If price goes back into 93–95k → probability of rejection is high.

Candle Patterns Risk Management in Options
While options offer opportunities, they also carry risks:
Selling naked options can lead to unlimited losses
High leverage can magnify mistakes
Emotional trading during volatility can destroy capital
Ignoring Greeks can cause unexpected losses
Disciplined traders use:
Stop loss
Position sizing
Hedging
Proper strategy selection
Options should always be traded with clear logic, not hope or fear.

BTCUSDBTC USD
* I want BTCUSD in 92000 range
* i need displacement
* i need good RR
* I need my setup
* Rest no trade

Technical Analysis of BTCUSD – Is a Correction Approaching?BINANCE:BTCUSD is currently moving within a clearly defined falling wedge pattern, with price now pressing against the lower boundary of the structure. This level may act as dynamic support, and if price shows a strong rejection, a corrective move toward the resistance zone near 102,000 could occur.
If sellers manage to defend that resistance area, the bearish structure remains intact, giving BTCUSD the potential to continue dropping to lower levels. But if price breaks above that zone, there is room for a higher correction toward the upper boundary of the wedge.
At this stage, paying close attention to candlestick patterns and volume behavior around this key area is crucial for identifying the best selling opportunities. Make sure every trade setup is supported by clear confirmation, and always apply solid risk management.
If you have any additional insights or a different perspective on this setup, I’d love to hear it. Feel free to share your thoughts in the comments!

Premium Chart Patterns Premium chart patterns are high-quality technical structures that show where big money is entering or exiting, helping you predict future moves with strong accuracy. These patterns are widely used in swing trading, intraday trading, and positional trading.
Below, you’ll find the top high-probability premium patterns, along with how to trade them.

Bitcoin Bybit chart analysis November 11Hello
It's a Bitcoin Guide.
If you "follow"
You can receive real-time movement paths and comment notifications on major sections.
If my analysis was helpful,
Please click the booster button at the bottom.
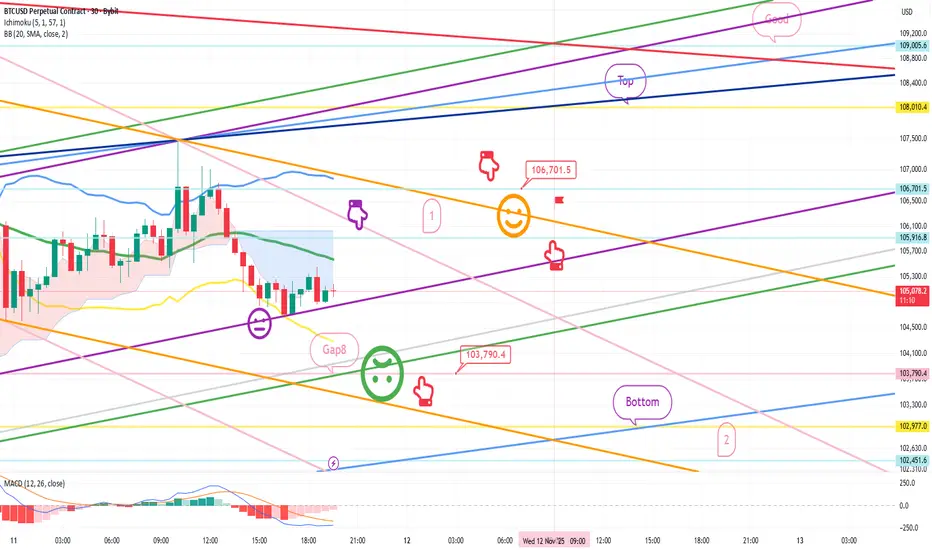
This is a Bitcoin 30-minute chart.
There are no separate Nasdaq indicators.
I developed a strategy based on the lower gap retracement of both Bitcoin and Nasdaq.
*Conditional long position strategy when the red finger moves
1. Confirm the first touch of the purple finger at the top (autonomous short)
Switch to a long position at the bottom at $103,790.4 /
Stop-loss price if the green support line is completely broken or the bottom is touched
2. First target for a long position at $106,701.5 / Target prices are Top and Good in that order.
If the strategy is successful, the first section is used to re-enter the long position.
If a correction occurs immediately without touching the first section at the top,
I'll wait for a long position at the bottom. Looking at the overall picture today, if the price drops to the bottom,
the medium-term pattern will be broken.
The purple support line must be maintained or the upper limit must be reached at 106.7K.
A rebound in the 1+4 range is required without breaking the green support line.
The Nasdaq variable is important, so please keep a close eye on the movement.
I hope you operate safely, with principled trading and stop-loss orders essential.
Thank you.
BTC/USD BUY LIVE TRADE *BTC-USD live trade
* took buy position
*exit with tsl
*there will be bearish fvg, so might fall and than going to hunt sl that stand on trade line

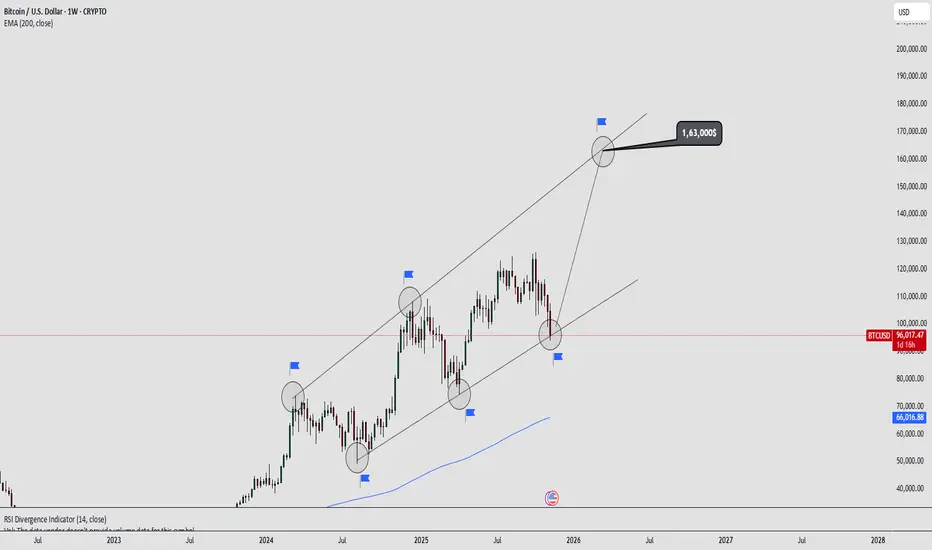
Bitcoin Long-Term Channel Analysis | BTCUSD to $163K Target |Bitcoin is currently respecting a multi-year ascending channel on the weekly chart. The price recently touched the lower trendline support, suggesting that the long-term structure is still intact.
This setup highlights a classic “higher highs and higher lows” pattern within the parallel channel, showing that BTC continues to follow its historical rhythm of expansion and correction phases.
Observations :
• Channel support: around $90,000 – $95,000 zone
• Channel resistance: projected near $160,000 – $165,000
• 200 EMA on the weekly chart near $66,000 providing long-term trend support
• RSI showing signs of recovery from the mid-zone
Technical Outlook:
If Bitcoin maintains the current channel support and forms a bullish reversal candle on the weekly close, the next leg of the rally could target $160K+ within the same channel structure.
Invalidation occurs on a confirmed weekly close below $90K, which would signal a potential trend shift.
Market Sentiment : Bullish (Long-Term)
Timeframe: Weekly
Style: Positional / Long-Term Analysis
Disclaimer: This is a personal technical view for educational purposes, not financial advice.
AI Trading Secrets and the Indian Psychology Trading Era1. The Rise of AI Trading: Invisible Machines Behind Every Move
AI trading refers to the use of machine learning models, predictive algorithms, neural networks, and automation to make trading decisions. These systems process data far beyond human capability — from price movements and volatility to sentiment and macro signals. The real secret of AI trading is that it doesn’t just “see data”; it learns from historical patterns and adapts to real-time conditions.
AI Trading Secret #1: Feature Engineering Is More Important Than Models
Most people think AI magic lies in fancy models. But in reality, the quality of input data (“features”) determines how good the prediction is. Smart AI traders know how to extract features like:
Volume clusters
Volatility squeeze signals
Order book buildup
High-frequency momentum micro-patterns
These allow AI systems to predict not the “future market”, but the probability of short-term moves.
AI Trading Secret #2: AI Does Not Predict — It Works on Probability Mapping
AI systems calculate probability zones. For example:
68% probability: NIFTY may stay within a certain band
55% probability: a breakout may occur
72% probability: volume expansion confirms momentum
This probabilistic thinking makes AI far more disciplined and emotion-free compared to human traders.
AI Trading Secret #3: Alternative Data Is the True Edge
Modern AI traders are not limited to charts. They read “unseen data,” including:
Social media sentiment
Google Trends
WhatsApp retail buzz
FII/DII trading micro-behaviour
Global ETF flow patterns
Options chain clustering
This alternative data gives AI a big advantage — early detection of shifts that humans take hours or days to notice.
AI Trading Secret #4: Automation Protects You From Human Weakness
AI never:
Overtrades
Gets greedy
Averages blindly
Seeks revenge trades
Breaks rules
This discipline alone gives AI traders a massive edge.
AI Trading Secret #5: AI’s Final Power — Backtesting + Optimization
AI systems test thousands of scenarios:
Different stop losses
Different entries/exits
Different indicators
Different position sizing rules
This creates strategies that are mathematically optimized rather than emotionally guessed.
2. Indian Psychology Trading Era: A New Mindset Born After 2020
India has seen a trading revolution after COVID. Nearly 10+ crore retail traders entered the market. But what makes Indian trading psychology unique?
2A. India’s Retail Trader Behaviour: Emotional Yet Evolving
Indian traders historically operated on:
Tips
WhatsApp calls
Penny stocks
Rumours
Overconfidence
But after 2020, a shift began — more awareness, YouTube learning, Algo tools, and community learning transformed the mindset.
Psychology Trend #1: Hope-Based Trading to Data-Based Trading
Earlier:
People traded based on “feeling Nifty will go up.”
Now:
People analyse:
OI data
PCR
Volume profile
Institutional flow
This marks the birth of the Indian Data-Driven Retail Era.
Psychology Trend #2: From Heroic Trading to Systematic Trading
Earlier:
“Bhai, full margin laga do, kal upper circuit jayega!”
Now:
Traders prefer:
Swing + risk-reward
Stop-loss
Algo automation
Hedged option strategies
The ego of “catching tops and bottoms” is slowly dying.
Psychology Trend #3: Options Mania Changed Behaviour
Indians love leverage. Options gave them:
Low capital
High ROI possibility
Fast trading cycles
This created both growth and chaos. But now traders are learning:
Sell-side edges
Premium decay
IV crush
Weekly expiry psychology
This learning curve is transforming the Indian retail community into a more sophisticated force.
3. Blending AI With Indian Psychology: The New Era of Smart Retail
This is where the magic happens. When AI meets Indian trading psychology, three powerful shifts occur:
Shift #1: AI Reduces Emotional Mistakes of Indian Traders
Indian traders struggle with:
Fear of missing out (FOMO)
Holding losers
Exiting winners early
Overtrading for “thrill”
AI solves these with:
Rule-based systems
Automatic execution
Pre-fixed risk management
Objective signals
Disciplined execution removes 80% emotional damage.
Shift #2: Indian Traders Bring Intuition AI Cannot See
AI understands data, but not “political sentiment,” budget buzz, or Indian-style retail behaviour. Indian traders understand:
Election season moves
Dubbed “operator activity”
Midcap burst cycles
Sectoral rotations
Market mood swings
This intuition plus AI’s objectivity creates the perfect trading duo.
Shift #3: The Rise of Hybrid Systems in India
This is the future:
A blend of human analysis + AI execution.
Example workflow:
Trader analyses volume profile + market structure
AI system generates probability zones
Human selects scenario
AI trades automatically
This hybrid edge will dominate the Indian markets in coming years.
4. Biggest Psychological Barriers Indian Traders Must Break
To fully enter the AI + psychology era, Indian traders must overcome:
Barrier 1: Overconfidence Bias
Thinking “I know the market” instead of “market can do anything.”
Barrier 2: Tip Addiction
Relying on outside voices instead of system-based confidence.
Barrier 3: Quick-Rich Fantasy
Expecting to make 50,000/day with 10,000 capital.
Barrier 4: Revenge Trading
Trying to “win back” lost money emotionally.
Barrier 5: Impulse Trading
Taking a trade because the candle “looked good.”
AI erases most of these — if traders let the system work.
5. What the Future Looks Like
India is entering a very powerful trading era:
AI will handle execution
Humans will handle market structure
Psychology will be increasingly coded into systems
More retail traders will use algos
Market will become more competitive
Only disciplined + data-driven traders will survive
The ones who stay in the game the longest will be those who embrace AI discipline + Indian intuition.

BTCUSD – Key Level Rejection with Potential Liquidity Sweep TowaChart Analysis
1. Price Context
BTCUSD is trading around $90,675.
The chart shows price rejecting the Key Level and failing to hold above the Daily CLS (daily close level).
Recent candles indicate loss of bullish momentum with a series of lower highs forming.
2. Key Zones on Your Chart
🔴 Daily CLS (Resistance)
Marked in red.
Price tried to break and hold above this level but rejected, showing it is acting as strong overhead resistance.
The shaded gray area above looks like the stop-loss zone for shorts, suggesting a bearish setup.
🟢 Key Level
Marked slightly below the Daily CLS.
Price broke above it earlier but is now retesting from the top, failing to reclaim.
This retest-rejection pattern signals a shift from bullish to bearish sentiment.
3. Trade Bias Indicated by the Chart
Your marked zone suggests a short position setup:
Entry around current price or just under the Key Level.
Stop-loss in the gray shaded box above the Daily CLS.
Take Profit 1 at 50% CLS TP1, a midpoint liquidity target.
Final TP near the green support at the bottom.
This structure reflects a liquidity-based short setup, expecting:
A sweep of local highs → rejection → push down to fill inefficiencies or revisit liquidity pools below.
4. Market Structure
Price printed a strong move up earlier, leaving inefficiency below.
Now forming lower highs and lower lows on the lower timeframe.
Hold below Key Level suggests continuation downward.
5. Bearish Confirmation Signals
✔ Failure to hold above Daily CLS
✔ Break of Key Level and retest as resistance
✔ Weak bullish follow-through
✔ Liquidity target below at 50% CLS
