Bitcoin (BTC/USD) – 1D Timeframe✅ Closing Summary:
Closing Price: ~$119,138 USD
Change: +$836 (+0.7%)
Opening Price: ~$118,302
Intraday High: ~$120,714
Intraday Low: ~$117,715
Bitcoin continued to show resilience by holding above the crucial $118,000 support level, despite facing overhead resistance near its previous high. The price action reflects bullish consolidation following recent surges above $120,000.
🔍 Key Reasons Behind the Price Action:
Institutional Demand Strengthening:
Bitcoin ETFs in the U.S. are witnessing rising inflows.
Hedge funds and family offices are seen increasing allocations, especially as digital assets gain legitimacy post-regulation discussions.
Regulatory Momentum:
U.S. Congress is pushing clearer frameworks around crypto taxation and stablecoins.
Global regulatory certainty (from EU & Japan) boosts confidence among investors and traders.
Weakening U.S. Dollar Index (DXY):
The DXY declined slightly, indirectly aiding BTC’s upward momentum.
Bitcoin remains a favored alternative store of value during fiat uncertainty.
Limited Miner Selling:
On-chain data shows a decline in miner distribution, meaning less sell-side pressure.
Miners seem optimistic about long-term prices and are holding reserves.
📈 Technical Outlook (Short-Term):
Support Zone: $117,500 to $118,000
Price found strong buyers in this range. It’s crucial that Bitcoin holds this level to maintain bullish structure.
Resistance Zone: $120,700 to $122,500
Previous highs around $122K serve as the next resistance. A daily candle close above this may trigger momentum buying.
Indicators:
RSI (Relative Strength Index): ~62 (bullish but not overbought)
MACD: Bullish crossover confirmed
Volume: Moderate, but above 20-day average
📆 Recent Trend Performance:
1-Day Return: +0.7%
1-Week Return: +2.1%
1-Month Return: +12.8%
3-Month Return: +35.4%
YTD Return: +61.2%
Bitcoin continues to outperform traditional asset classes, showing strong long-term growth despite short-term volatility.
🧠 What Traders & Investors Should Know:
Short-Term Traders: Consider range trading between $118K–$122K. Breakout above $122K may signal fresh upside potential.
Swing Traders: Watch for bullish continuation patterns (bull flags or cup-and-handle). Enter long if price closes above $121.5K on high volume.
Long-Term Investors: Accumulation at current levels could be ideal before the next halving cycle and broader adoption via ETFs and institutions.
🛠️ Chart Behavior and Candlestick Analysis:
Candle Type: Bullish candle with long lower wick, indicating buying pressure near support.
Pattern: Minor flag formation with potential breakout above $121K on next daily move.
🧭 Macro-Level Catalysts to Watch:
U.S. Bitcoin ETF weekly flows (Friday updates)
Fed interest rate guidance (next FOMC meeting)
Crypto regulation developments in U.S., EU, and APAC
On-chain metrics: exchange inflow/outflow, whale accumulation
💬 Conclusion:
BTC/USD is showing solid structure in the 1D chart. With strong institutional demand, improving global regulation, and technical support holding, Bitcoin is in a healthy uptrend. The short-term outlook remains bullish as long as BTC holds above $118K. A breakout above $122K could fuel the next leg towards $125,000–$130,000.
Trade ideas

Advance Option Trading✅ What is Advanced Options Trading?
At the advanced level, traders use option combinations, multi-leg strategies, and hedging techniques to:
Maximize profits
Minimize risks
Take advantage of market volatility and time decay (Theta)
You don’t just predict direction; you trade direction, volatility, and time decay together.
✅ Core Concepts in Advanced Options Trading
1. Greeks Mastery
Delta: Measures how much the option price moves with the underlying asset.
Gamma: Rate of change of Delta.
Theta: Time decay — how much the option loses value every day.
Vega: Sensitivity to volatility changes.
Rho: Impact of interest rate changes (used less by retail).
Understanding Greeks helps you manage profits and risks more precisely
3. Volatility Trading
Institutions trade implied volatility (IV), not just price direction. Advanced traders use tools like IV Rank and IV Percentile to:
Sell options when IV is high (premium rich)
Buy options when IV is low (cheap options)
4. Hedging Techniques
Use options to protect your portfolio from major losses.
Example: Holding stocks and buying Protective Puts to limit downside risk.
Example: Selling Covered Calls to generate monthly income on stock holdings.
✅ Benefits of Advanced Options Trading
💸 Profit in Any Market Condition (up, down, sideways)
⏳ Earn from Time Decay (Theta Decay)
🛡️ Control Risk with Defined Risk Strategies
🎯 Higher Probability of Consistent Returns
📉 Less Capital, More Leverage
✅ Who Should Learn Advanced Option Trading?
✅ Traders with basic options knowledge
✅ Investors wanting to hedge portfolios
✅ Intraday or positional traders
✅ Those seeking consistent monthly income
✅ Final Thoughts
Advanced Options Trading transforms you from a simple buyer/seller to a strategic trader who uses market forces smartly. You don’t chase trades — you set up calculated, high-probability positions and let the market work for you.

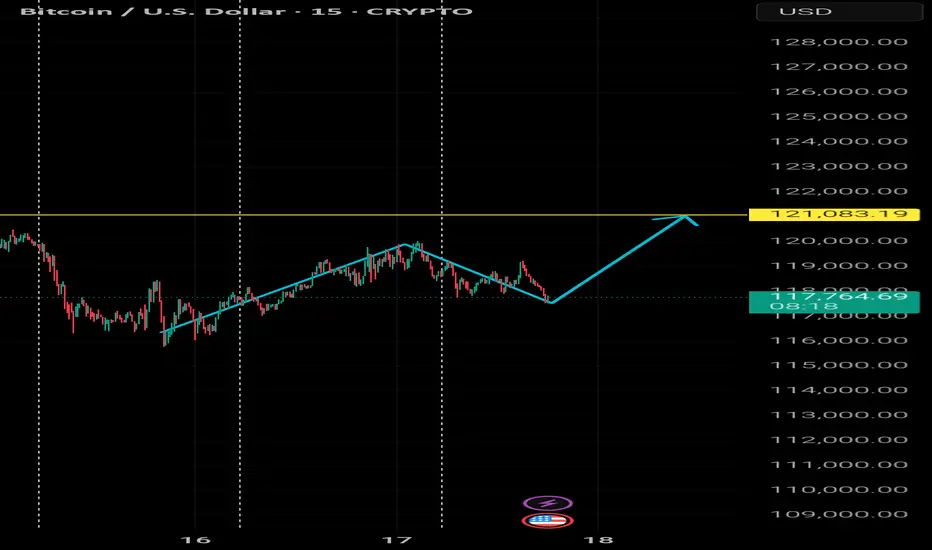
BTCUSD Forming Bullish W Pattern – Targeting 121083In this 15-minute chart of BTCUSD, we can observe a potential bullish reversal pattern forming—commonly referred to as a "W" or double bottom. The price recently retraced from the 119000 zone and found support around 117000, completing the second leg of the pattern.
The structure indicates strong buying interest at lower levels and a possible continuation to the upside. If the pattern completes, we can expect the price to break above the neckline resistance at 119500 and target the next key resistance level at 121083.19, marked by the yellow horizontal line.
Trade Plan:
Entry: Around 117500–118000 (after confirmation of support)
Target: 121083
Stop Loss: Below recent swing low ~116500
Risk-to-Reward: Approximately 1:2+
This setup is valid as long as the price holds above the 116500 level. A break below that would invalidate the bullish structure.
Difference Between Technical Analysis and Option Chain Analysis✅ 1. What is Technical Analysis?
Technical Analysis (TA) is the art and science of predicting future price movements based on historical price and volume data.
It’s like checking a stock’s past behavior on a chart to guess what it might do next.
🧠 How Does It Work?
Uses charts (candlestick, line, bar)
Studies patterns (head and shoulders, cup & handle, flags, etc.)
Applies indicators (RSI, MACD, Moving Averages, Bollinger Bands)
Identifies support & resistance levels
Helps time entry and exit points
📊 What Does It Tell You?
Is the stock trending up or down?
Is it overbought or oversold?
Where are strong support/resistance zones?
Is a breakout or breakdown happening?
🧰 Tools Used in Technical Analysis:
TradingView, Chartink, Zerodha Kite, Upstox Pro, etc.
Indicators: RSI, MACD, EMA, VWAP, Supertrend
Patterns: Breakout, Double Top, Flag Pattern, etc.
✅ 2. What is Option Chain Analysis?
Option Chain Analysis is specific to derivatives trading. It looks at open interest (OI), premiums, and strike prices to understand what option traders are betting on.
It helps you decode the behavior of big players (institutions) in the options market — especially on indices like Nifty, Bank Nifty or liquid stocks like Reliance, HDFC Bank, etc.
🧠 How Does It Work?
An option chain shows all available strike prices and their:
Call (CE) and Put (PE) premiums
Open Interest (OI) — how many contracts are outstanding
Changes in OI — fresh buying/selling activity
Volume traded
Implied Volatility (IV) — market’s expectations of volatility
📊 What Does It Tell You?
Where is the market expecting resistance? (High Call OI = resistance)
Where is the market expecting support? (High Put OI = support)
What are option writers (big players) doing?
Is the market bullish, bearish, or neutral?
🧰 Tools Used in Option Chain Analysis:
NSE Website (Option Chain)
Sensibull, Opstra, QuantsApp, StockMock
Open Interest Analysis Tools
PCR (Put Call Ratio)
Max Pain Theory
⚖️ Key Differences: Technical Analysis vs Option Chain Analysis
Feature Technical Analysis Option Chain Analysis
Used For Any stock, index, or crypto Only in derivatives (Options)
Data Based On Price, volume, chart patterns OI, strike prices, premiums, IV
Who Uses It? All traders (equity, F&O, forex, crypto) Mostly F&O traders and option
Time Horizon Intraday to long-term Intraday to expiry-based
📌 Practical Example (Nifty)
🔍 Technical View:
Nifty is making higher highs, higher lows
RSI = 60 → Momentum is still strong
20 EMA is acting as support
➡️ Suggests bullish trend — buy on dips
📈 Option Chain View:
Highest Call OI at 24,000 → Strong resistance
Highest Put OI at 23,500 → Strong support
Put writing increasing at 23,600 → Bulls defending this level
➡️ Suggests market may stay between 23,500–24,000
🎯 When to Use Which?
Situation Use This
Want to analyze a stock's trend Technical Analysis
Trading non-derivativ e stocks Technical Analysis
Intraday scalping Both (TA + OI levels)
Trading Nifty/Bank Nifty Options Option Chain Analysis
Looking for expiry range predictions Option Chain
Want to confirm breakout strength Combine both!
💡 Best Strategy: Combine Both!
Professional traders don’t treat these as either-or.
They often use:
📉 Technical analysis to find chart setups
🧠 Option chain data to confirm big player positions
Example:
A breakout on chart + strong Put OI at breakout level = high-probability trade.
✅ Summary
Aspect Technical Analysis Option Chain Analysis
Based on Charts, price, volume OI, premiums, strike data
Used for All trading instruments Only options
Helps in Timing trades, spotting patterns Predicting expiry range
Tools RSI, MACD, Patterns, EMAs OI, IV, Max Pain, PCR
Users Retail + institutional traders Mainly option traders, F&O players
🚀 Final Thought
Both tools are powerful in their own right. But when used together, they give you a 360° edge in the markets.
Technical analysis shows you what's happening on the chart.
Option chain analysis shows you what traders expect to happen behind the scenes.
Mastering both is the true trader’s advantage
BTC/USD Pullback: What’s Next for Bitcoin?Hello, passionate and wealthy traders! What are your thoughts on BTC/USD?
After a strong surge above the 122,500 USD zone, BTC/USD has started to experience a slight pullback. This is completely normal and necessary for Bitcoin to gain new momentum.
In my personal view, the recent peak of BTC/USD signals that this correction is in play. But where do you think BTC/USD will adjust to? Personally, I believe the 111,500 USD zone is quite reasonable. It’s also the previous breakout level, and this pullback aims to test the uptrend safely.
What about you? Where do you see BTC/USD heading? Looking forward to hearing your thoughts!
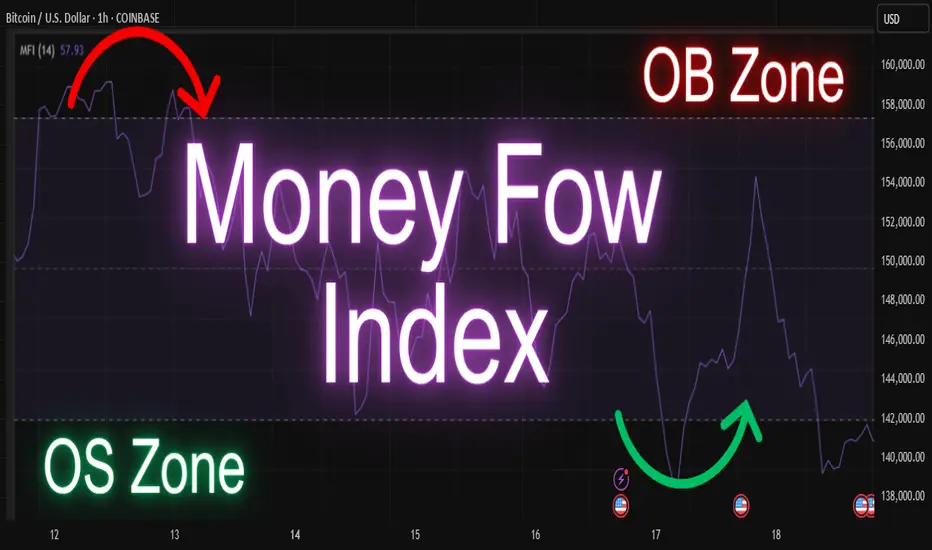
How To Use Money Flow Index (MFI) Indicator ??? the money flow index (mfi) is a momentum indicator that uses both price and volume to measure buying and selling pressure
🧠 unlike rsi, which only considers price, mfi gives deeper insights by combining volume into the calculation
mfi values range from 0 to 100
1)above 80 = overbought zone
2)below 20 = oversold zone
🔍 traders use mfi to spot potential reversals, divergences, and to confirm trends
🛠️ you can combine mfi with other indicators like moving averages or support/resistance for better decision-making
🧪 test it on different timeframes to understand how it behaves with your strategy
Disclaimer :
This idea post is not financial advice, it's for educational purposes only, I am not a SEBI-registered advisor. Trading and investing involve risk, and you should consult with a qualified financial advisor before making any trading decisions. I do not guarantee profits or take responsibility for any losses you may incur.
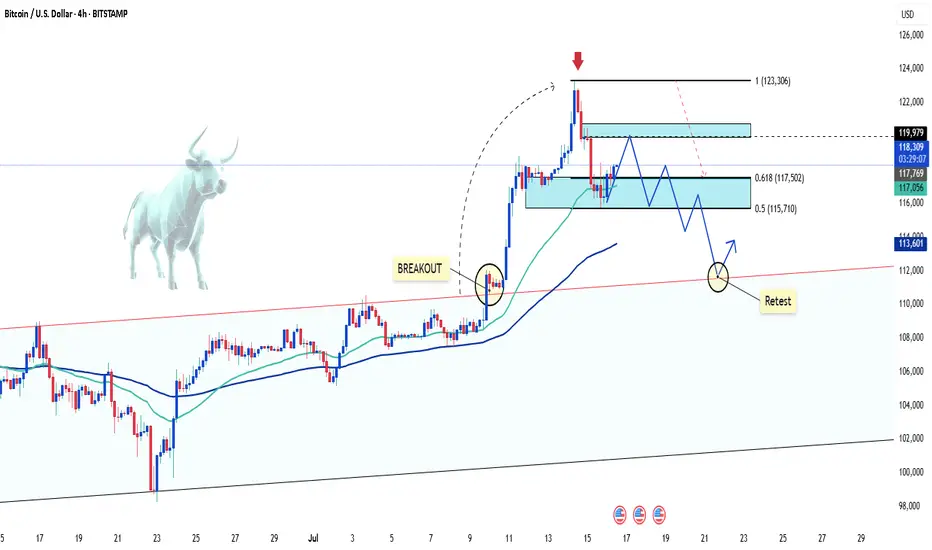
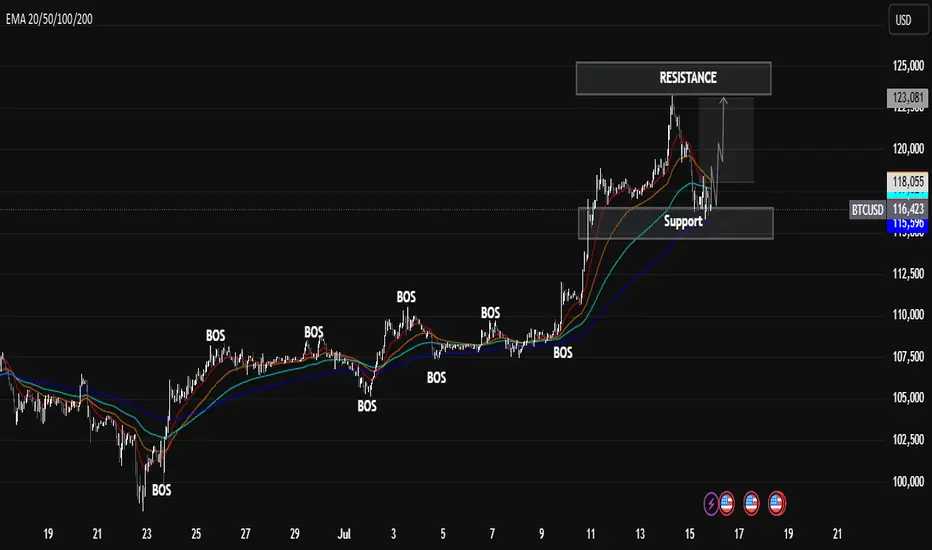
BTCUSD Technical Analysis – Break of Structure + SupportBTCUSD Technical Analysis – Break of Structure + Support/Resistance Strategy
🔍 Market Structure Insight
The chart clearly shows multiple Breaks of Structure (BOS) throughout the uptrend, indicating strong bullish momentum. Each BOS confirms a higher high formation and continued market strength.
📌 Key Zones
Resistance Zone: Price recently tested this level and faced rejection, indicating potential short-term selling pressure.
Support Zone: Price is currently retesting this level after a correction, showing signs of a possible bounce. It aligns well with the EMA support cluster (20–200 EMAs).
🔄 Current Price Action
After a significant impulse move to the upside, BTC is now in a corrective phase. However, the support zone is holding, and there's potential for a new bullish wave if price sustains above $115,000.
📈 Bullish Scenario
Price holds above support
EMA cluster continues to act as dynamic support
Break above $118,000 resistance could trigger the next rally toward $122,000+
BTC/USD Technical Analysis — Educational BreakdownBTC/USD Technical Analysis — Educational Breakdown (July 13, 2025)
🔍 Market Context
Bitcoin (BTC/USD) is currently trading around $117,913, exhibiting a clear reaction from a well-defined resistance zone between $118,439 and $119,000. This resistance aligns with a previously unfilled 4H Bullish Fair Value Gap (FVG) — a price inefficiency left behind during a strong bullish move — which has now been filled, triggering a pause and reaction in bullish momentum.
🧠 Key Concepts Explained
📘 1. Fair Value Gap (FVG)
In Institutional Price Delivery models (often used in Smart Money Concepts), a Fair Value Gap represents an imbalance in price action — usually between the wicks of candles where price moved too quickly, leaving inefficient trading zones. Price often retraces to these areas before resuming its direction. Here, BTC has filled the 4H Bullish FVG, which acts as a magnet for price and a potential reversal point once filled.
📘 2. Liquidity Sweep
The chart highlights a Sell-Side Liquidity Sweep — this occurs when price dips below a key short-term low or consolidation range to trigger stop-losses and collect liquidity before making its next move. This move is typically engineered by larger market participants to capture orders before deciding on true directional intent.
📘 3. Resistance and Support
Resistance ($118,439 – $119,000): This area is acting as a supply zone where sellers are stepping in after price filled the FVG.
Support ($115,580): This level has previously provided demand and also holds liquidity (stop-losses from long positions), making it a probable target if bearish pressure follows through.
🧭 Technical Interpretation
Price Action: After an impulsive rally, BTC entered a sideways consolidation phase below resistance, forming a short-term range. This is often a sign of distribution or indecision.
Liquidity Behavior: The chart indicates a liquidity sweep just below the consolidation range — this is a common tactic to trap breakout traders and collect stop orders before a potential larger move.
Reaction Zone: Price is now reacting from a filled FVG, coinciding with resistance. The lack of strong continuation above this zone suggests rejection and possible reversal.
Probable Scenario: Unless BTC cleanly breaks and closes above the $119,000 level with volume and conviction, the current structure favors a retracement toward the $115,580 support zone.
📈 Potential Trade Insight (Educational)
⚠️ This is not financial advice but an educational scenario based on the current technical setup.
Bearish Setup: If price rejects from resistance and forms a lower high, a short entry targeting the support zone at $115,580 could be considered, using a stop above $119,000.
Bullish Invalidator: A break and hold above $119,000 would suggest bullish continuation, potentially targeting higher time frame imbalances or resistance.
📚 Summary & Takeaway for Learners
This chart presents an excellent case study in understanding how institutional concepts like FVGs, liquidity sweeps, and key supply/demand zones interact in real price action. Traders can learn the following from this setup:
Price doesn’t move randomly — it often targets liquidity and imbalances.
Patience is key — waiting for confirmation at known reaction zones can improve trade accuracy.
Market context matters — a filled FVG at resistance combined with a liquidity sweep gives confluence to a bearish outlook.

July 14 Bitcoin Bybit chart analysisHello
It's a Bitcoin Guide.
If you "follow"
You can receive real-time movement paths and comment notifications on major sections.
If my analysis was helpful,
Please click the booster button at the bottom.
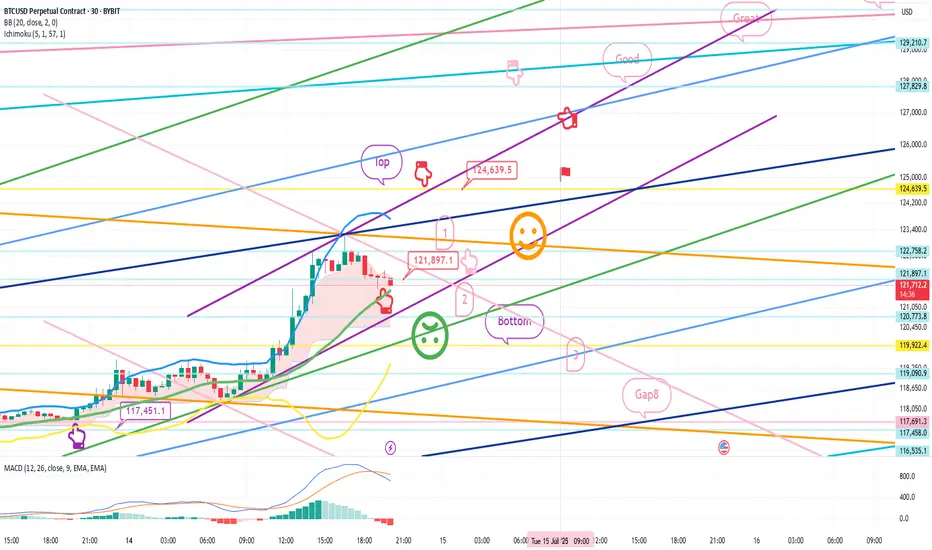
This is a Bitcoin 30-minute chart.
There is no separate Nasdaq indicator announcement.
Nasdaq upper gap reversal condition and
Bitcoin is moving sideways after a sharp rebound until the afternoon.
I created today's strategy based on the vertical decline condition based on the 5-minute trend reversal in Tether Dominance.
On the lower left, I connected the long position entry section of 117,451.1 dollars that I entered on the 11th.
* In the case of the red finger movement path,
This is a one-way long position
current position chase purchase strategy.
1. Chasing purchase at 121,897.1 dollars / Stop loss price when the green support line is broken
2. 124,639.5 dollars long position 1st target -> Good, Great in order of target price
Since I left a simulation in the middle,
I think it would be good to use it for re-entry after liquidating the long position.
The movement within the 1st section at the top and the 2nd section at the bottom
is an extreme sideways movement, and from a long position,
if it succeeds in rebounding within the 2nd section, it becomes a strong upward condition.
From the 3rd section breakout today,
the low point is broken in the newly created weekly and daily chart candles this week,
so please note that the upward trend may be delayed.
The next support line is the Gap8 section created last week.
Up to this point, I ask that you simply refer to and utilize my analysis
and I hope that you operate safely with principle trading and stop loss prices.
Thank you.
BTCUSDAs we can see from the chart, price has taken down the Break out liquidity and now moving lower !
As we always do, to continue it to upwards it has to again create base and create liquidity.
After taking that liquidity it might push up again !! As you can see from the chart.
So how much lower it can go!!! No idea!!

BTC/USD Soars: A Surge That Took the Market by SurpriseBitcoin BITSTAMP:BTCUSD has shocked the market with a massive surge, reaching new highs in recent days. This unexpected jump has taken many traders and analysts by surprise, as BTC breaks through previous resistance levels.
The driving forces behind this surge appear to be increased institutional interest, positive market sentiment, and strong demand from retail investors. As Bitcoin enters new territory, it's essential for traders to stay vigilant and manage their risk, as volatility remains high.
Will Bitcoin continue its rally or face a correction? Keep an eye on the charts for the next move!

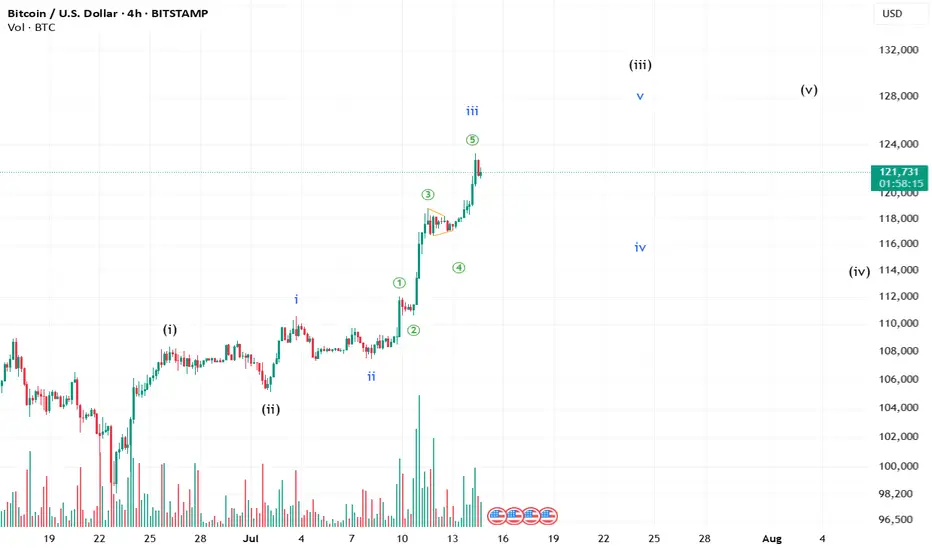
There is some steam still left in BTC!!BTC might still try again to push the levels to complete its sister waves. Whether it will sustain in the future is still yet to be answered.
**This is an educational market outlook, not investment advice. Please consult a SEBI-registered advisor before taking any investment decisions.**
BTCUSD BUYING IDEAbut bitcoin for short term trade
For intra day we could buy btc and book some small profit
trade wisely

Advance Option Trading Why Institutions Prefer Options
Leverage – Control large positions with small capital
Risk Management – Protect portfolios
Cash Flow – Earn premium income
Volatility Play – Earn from IV rise/fall
Customization – Tailored exposure using exotic options
Core Strategies Used by Institutions
1. Protective Puts
Buy puts to insure large stock holdings against downside risk.
2. Covered Calls
Earn premium income on long-term stock holdings.
3. Calendar Spreads
Take advantage of time decay and volatility differences.
4. Straddles & Strangles
Bet on volatility movement, not direction.
Tools Used by Institutional Option Traders
Bloomberg Terminal – Real-time data, pricing models
Quantitative Models – Black-Scholes, Binomial Trees
Algo Execution – Smart order routing
Risk Management Software – VaR, Greeks analysis
Option Analytics Platforms – Orats, Trade Alert

Are we there yet !? Btc - 123k -> 135k -> ~150k -> 180k -> ~210kATH back into the Historical Rails
Btc towards
Are we there yet !? Btc - 123k -> 135k -> ~150k -> 180k -> ~210k

Bitcoin 121000-125000 positional target still pending How My Harmonic pattern projection Indicator work is explained below :
Recent High or Low :
D-0% is our recent low or high
Profit booking zone: D13% -D15% is
range if break them profit booking start on uptrend or downtrend but only profit booking, trend not changed
SL reversal zone : SL 23% and SL 25% is reversal zone if break then trend reverse and we can take reverse trade
Target : T1, T2, T3, T4 and .
Are our Target zone

BTCAs it gave a strong breakout from the base at ATH to the upside, now ofcourse price would go up for sometimes.
But to it to go up, I m thinking of 2 possibilities.
And 2nd one is the one I am preferring "sweep and continuation."
Although I would any outcome ofcourse. 😂

BTC 30 Mins Timeframe Analysis 12 July 2025 #intraday #BTCCRYPTOCAP:BTC Bitcoin is currently testing a strong resistance zone near $118K, forming a bullish ascending channel on the 30-min chart. Breakout or breakdown from this level could dictate the next directional move. Multiple entry points and risk zones identified for both scalpers and swing traders.
📌 Key Technical Highlights:
Ascending trendline support intact
Resistance zone: $118,040 – $118,422
Fibonacci levels plotted for precision targets
“Safe Entry” level above resistance for reduced risk
Breakdown level near $117,170 marked clearly
Volume building into resistance zone
🎯 Upside Target Levels:
Target 1: $118,909
Target 2: $119,365
Extended Target: $119,852 – $120,048 (monthly range)
⚠️ Downside Risk Levels (if breakout fails):
Breakdown Trigger: $117,170
Risk Zone 1: $116,633
Risk Zone 2: $115,690 – $115,226
📈 Strategy Outlook:
Bullish Bias: If BTC breaks and sustains above $118,422 with volume
Bearish Setup: On rejection or breakdown below $117,170
Use tight SLs near ascending trendline for intraday trades
Scalp long if price retests support zones and holds with volume
🛡️ Disclaimer:
We are not SEBI-registered analysts. This content is for educational and informational purposes only. Please consult your financial advisor before making any trading decisions.

BTCUSD DAILY GANN PRICE AND TIME ANALYSIS 12 JULY 2025BTCUSD daily chart analysis shows a price and time happening at price of 123943 on 06 Aug 2025. Earlier important price was 105351 where we got resistance till 04 Feb 2025. We got correction till 74366 till 06 April 2025. We got a higher low on 06 may 2025 at important price level of 92957. We will watch both price of 123943 and date of 06 Aug 2025.
Happy Trading !!!

Bitcoin at Monthly resistance!Bitcoin is showing resistance currently at 108339 last month and 109327 this month.
Historically in monthly chart whenever the price touched the trendline, the price has seen a reversal.
Stay alert new investors and traders.

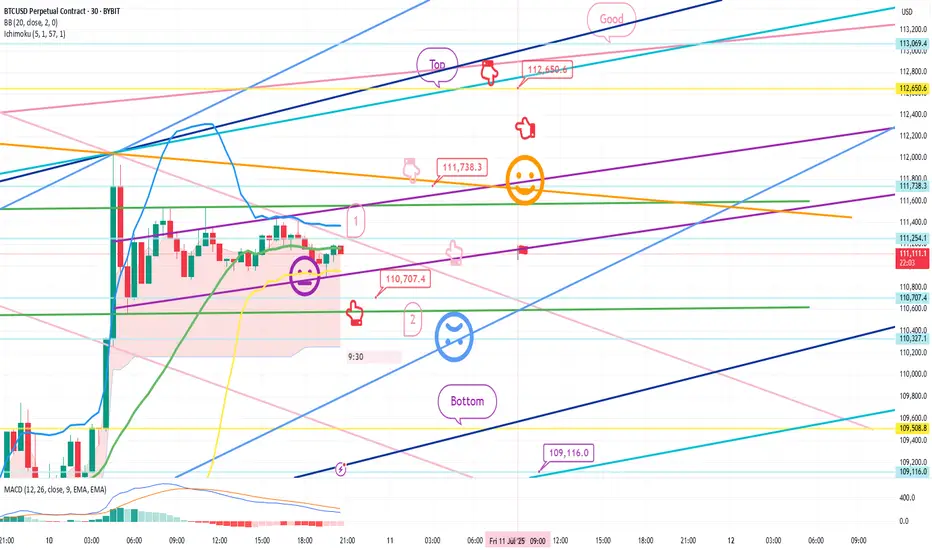
Bitcoin Bybit chart analysis July 10Hello
It's a Bitcoin Guide.
If you "follow"
You can receive real-time movement paths and comment notifications on major sections.
If my analysis was helpful,
Please click the booster button at the bottom.
Here is the Bitcoin 30-minute chart.
There will be a Nasdaq indicator announcement at 9:30 in a little while.
There is a high possibility that Nasdaq will shake up and down significantly,
but Bitcoin still looks safe in terms of signal and pattern.
In the analysis article on July 7,
I connected the strategy as it was at the last long position entry point of 107,484 dollars.
*When the red finger moves,
it is a one-way long position strategy.
1. 110,707.4 dollars long position entry point / stop loss price when the sky blue support line breaks
2. 111,783.3 dollars long position 1st target -> Top 2nd -> Good 3rd target price
The 1st section at the top is today's best short position entry point,
and the 2nd section at the bottom is a sideways market.
In the middle, with a pink finger,
I left a re-entry position after liquidating a long position, so
I think it would be good to use it.
From the breakout of the sky blue support line, it can be pushed to Bottom -> 109,116 dollars.
The report is not yet renewed,
but from now on, it will be very important, right?
This week, it seems like it will continue to shake up and down,
so I hope you operate safely with principle trading and stop loss prices.
Thank you.
BITCOIN NEAR COMPLETOIN OF ITS CYCLEHere ploted fib circle which is showing what i want to say you all and what i told in my previous post you can see here resistance and symmetrical triangle is ploted as it is now you should be carefull however it has potential to go up but it may take some rest after squaring its previous price.Cycle is going to comlete but squaring is remained to comlete even after this biger move.this is not my buy/sell call just informing you all.

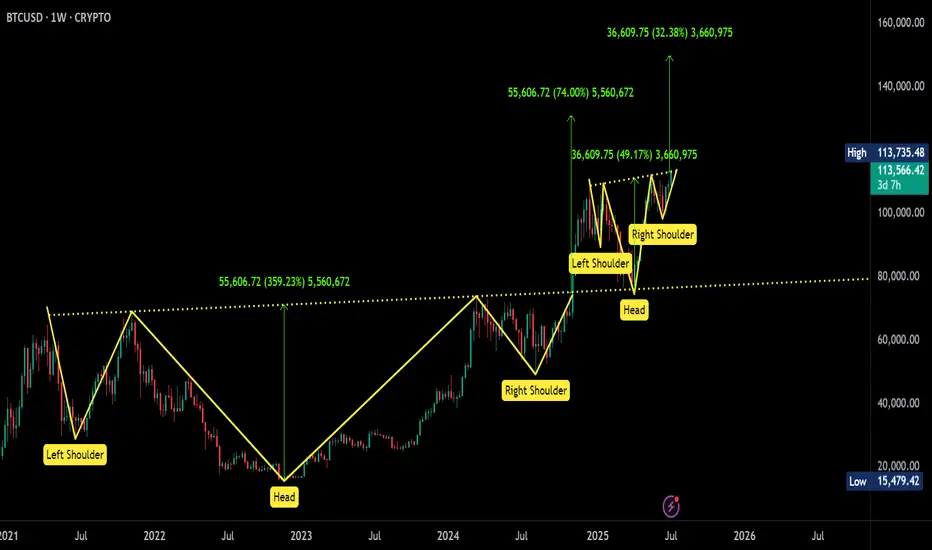
BTC forms back-2-back Inverse Head & Shoulders — BO in progress!CRYPTOCAP:BTC has formed two consecutive Inverse Head & Shoulders (#IH&S) patterns, signaling strong bullish momentum.
Breakout Confirmation: We need a weekly close above $130,080 to confirm the breakout.
Previous IH&S Target: $130,750 – still in play.
Current IH&S Target: Around $149,700, which represents over 30% upside from current levels.
Keep a close watch on weekly closing levels — a confirmation could trigger the next leg up.
#Bitcoin #CryptoAnalysis #BTC #ChartPattern #TechnicalAnalysis