BTC/USD Soars: A Surge That Took the Market by SurpriseBitcoin BITSTAMP:BTCUSD has shocked the market with a massive surge, reaching new highs in recent days. This unexpected jump has taken many traders and analysts by surprise, as BTC breaks through previous resistance levels.
The driving forces behind this surge appear to be increased institutional interest, positive market sentiment, and strong demand from retail investors. As Bitcoin enters new territory, it's essential for traders to stay vigilant and manage their risk, as volatility remains high.
Will Bitcoin continue its rally or face a correction? Keep an eye on the charts for the next move!
Trade ideas

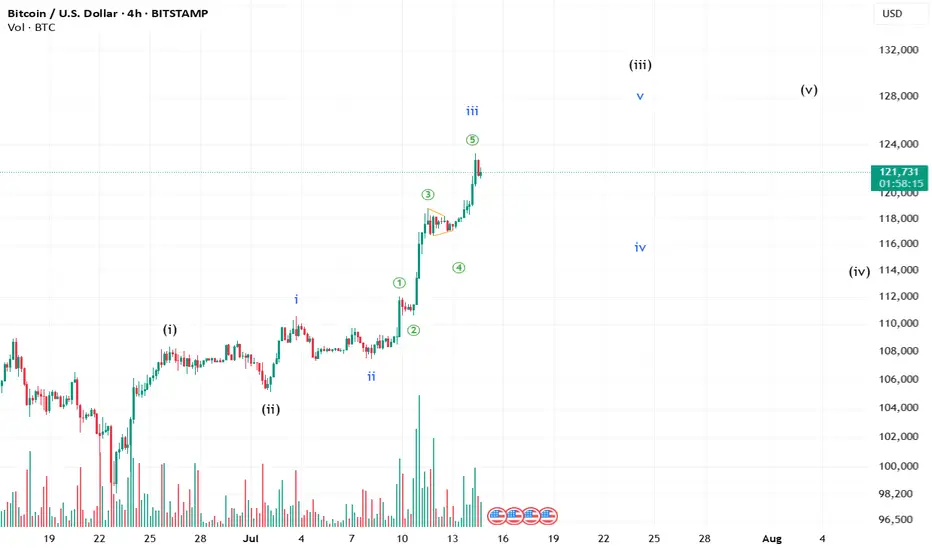
There is some steam still left in BTC!!BTC might still try again to push the levels to complete its sister waves. Whether it will sustain in the future is still yet to be answered.
**This is an educational market outlook, not investment advice. Please consult a SEBI-registered advisor before taking any investment decisions.**
BTCUSD BUYING IDEAbut bitcoin for short term trade
For intra day we could buy btc and book some small profit
trade wisely

Advance Option Trading Why Institutions Prefer Options
Leverage – Control large positions with small capital
Risk Management – Protect portfolios
Cash Flow – Earn premium income
Volatility Play – Earn from IV rise/fall
Customization – Tailored exposure using exotic options
Core Strategies Used by Institutions
1. Protective Puts
Buy puts to insure large stock holdings against downside risk.
2. Covered Calls
Earn premium income on long-term stock holdings.
3. Calendar Spreads
Take advantage of time decay and volatility differences.
4. Straddles & Strangles
Bet on volatility movement, not direction.
Tools Used by Institutional Option Traders
Bloomberg Terminal – Real-time data, pricing models
Quantitative Models – Black-Scholes, Binomial Trees
Algo Execution – Smart order routing
Risk Management Software – VaR, Greeks analysis
Option Analytics Platforms – Orats, Trade Alert

Are we there yet !? Btc - 123k -> 135k -> ~150k -> 180k -> ~210kATH back into the Historical Rails
Btc towards
Are we there yet !? Btc - 123k -> 135k -> ~150k -> 180k -> ~210k

Bitcoin 121000-125000 positional target still pending How My Harmonic pattern projection Indicator work is explained below :
Recent High or Low :
D-0% is our recent low or high
Profit booking zone: D13% -D15% is
range if break them profit booking start on uptrend or downtrend but only profit booking, trend not changed
SL reversal zone : SL 23% and SL 25% is reversal zone if break then trend reverse and we can take reverse trade
Target : T1, T2, T3, T4 and .
Are our Target zone

BTCAs it gave a strong breakout from the base at ATH to the upside, now ofcourse price would go up for sometimes.
But to it to go up, I m thinking of 2 possibilities.
And 2nd one is the one I am preferring "sweep and continuation."
Although I would any outcome ofcourse. 😂

BTC 30 Mins Timeframe Analysis 12 July 2025 #intraday #BTCCRYPTOCAP:BTC Bitcoin is currently testing a strong resistance zone near $118K, forming a bullish ascending channel on the 30-min chart. Breakout or breakdown from this level could dictate the next directional move. Multiple entry points and risk zones identified for both scalpers and swing traders.
📌 Key Technical Highlights:
Ascending trendline support intact
Resistance zone: $118,040 – $118,422
Fibonacci levels plotted for precision targets
“Safe Entry” level above resistance for reduced risk
Breakdown level near $117,170 marked clearly
Volume building into resistance zone
🎯 Upside Target Levels:
Target 1: $118,909
Target 2: $119,365
Extended Target: $119,852 – $120,048 (monthly range)
⚠️ Downside Risk Levels (if breakout fails):
Breakdown Trigger: $117,170
Risk Zone 1: $116,633
Risk Zone 2: $115,690 – $115,226
📈 Strategy Outlook:
Bullish Bias: If BTC breaks and sustains above $118,422 with volume
Bearish Setup: On rejection or breakdown below $117,170
Use tight SLs near ascending trendline for intraday trades
Scalp long if price retests support zones and holds with volume
🛡️ Disclaimer:
We are not SEBI-registered analysts. This content is for educational and informational purposes only. Please consult your financial advisor before making any trading decisions.

BTCUSD DAILY GANN PRICE AND TIME ANALYSIS 12 JULY 2025BTCUSD daily chart analysis shows a price and time happening at price of 123943 on 06 Aug 2025. Earlier important price was 105351 where we got resistance till 04 Feb 2025. We got correction till 74366 till 06 April 2025. We got a higher low on 06 may 2025 at important price level of 92957. We will watch both price of 123943 and date of 06 Aug 2025.
Happy Trading !!!

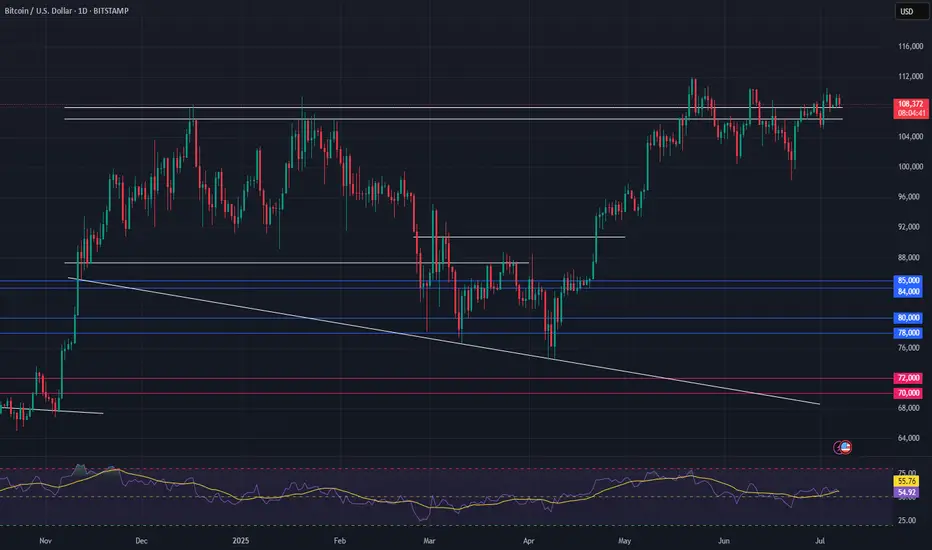
Bitcoin at Monthly resistance!Bitcoin is showing resistance currently at 108339 last month and 109327 this month.
Historically in monthly chart whenever the price touched the trendline, the price has seen a reversal.
Stay alert new investors and traders.

Bitcoin Bybit chart analysis July 10Hello
It's a Bitcoin Guide.
If you "follow"
You can receive real-time movement paths and comment notifications on major sections.
If my analysis was helpful,
Please click the booster button at the bottom.
Here is the Bitcoin 30-minute chart.
There will be a Nasdaq indicator announcement at 9:30 in a little while.
There is a high possibility that Nasdaq will shake up and down significantly,
but Bitcoin still looks safe in terms of signal and pattern.
In the analysis article on July 7,
I connected the strategy as it was at the last long position entry point of 107,484 dollars.
*When the red finger moves,
it is a one-way long position strategy.
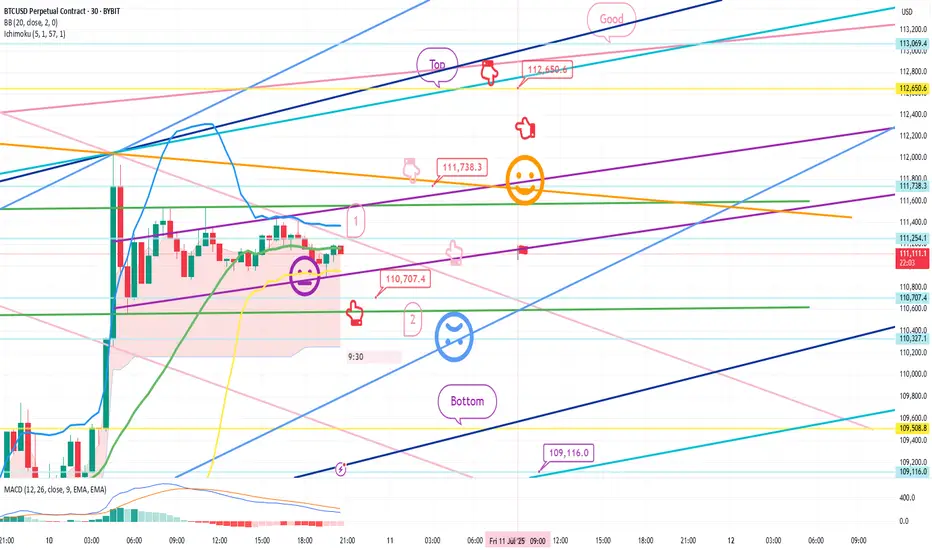
1. 110,707.4 dollars long position entry point / stop loss price when the sky blue support line breaks
2. 111,783.3 dollars long position 1st target -> Top 2nd -> Good 3rd target price
The 1st section at the top is today's best short position entry point,
and the 2nd section at the bottom is a sideways market.
In the middle, with a pink finger,
I left a re-entry position after liquidating a long position, so
I think it would be good to use it.
From the breakout of the sky blue support line, it can be pushed to Bottom -> 109,116 dollars.
The report is not yet renewed,
but from now on, it will be very important, right?
This week, it seems like it will continue to shake up and down,
so I hope you operate safely with principle trading and stop loss prices.
Thank you.
BITCOIN NEAR COMPLETOIN OF ITS CYCLEHere ploted fib circle which is showing what i want to say you all and what i told in my previous post you can see here resistance and symmetrical triangle is ploted as it is now you should be carefull however it has potential to go up but it may take some rest after squaring its previous price.Cycle is going to comlete but squaring is remained to comlete even after this biger move.this is not my buy/sell call just informing you all.

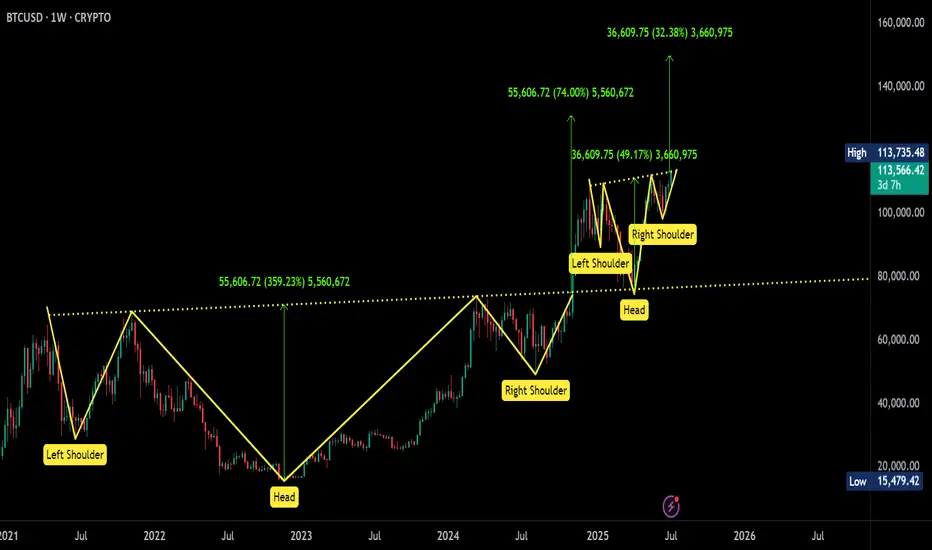
BTC forms back-2-back Inverse Head & Shoulders — BO in progress!CRYPTOCAP:BTC has formed two consecutive Inverse Head & Shoulders (#IH&S) patterns, signaling strong bullish momentum.
Breakout Confirmation: We need a weekly close above $130,080 to confirm the breakout.
Previous IH&S Target: $130,750 – still in play.
Current IH&S Target: Around $149,700, which represents over 30% upside from current levels.
Keep a close watch on weekly closing levels — a confirmation could trigger the next leg up.
#Bitcoin #CryptoAnalysis #BTC #ChartPattern #TechnicalAnalysis
btc usdt tap to 113500$ sudden dump to 109000$ then pump to 150kbtc usdt tap to 113500$ sudden dump to 109000$ trader open short then pump to 150k liqudate all short

Bitcoin Bybit chart analysis July 7 Hello
This is Bitcoin Guide.
If you "follow"
You can receive real-time movement paths and comment notifications on major sections.
If my analysis was helpful,
Please click the booster button at the bottom.
Here is the Bitcoin 30-minute chart.
There is no separate Nasdaq indicator announcement today.
I think the Nasdaq lower gap section retracement will be the focus.
Recently, sideways movement or adjustments have been coming out before the trend,
So I proceeded safely in preparation for variables.
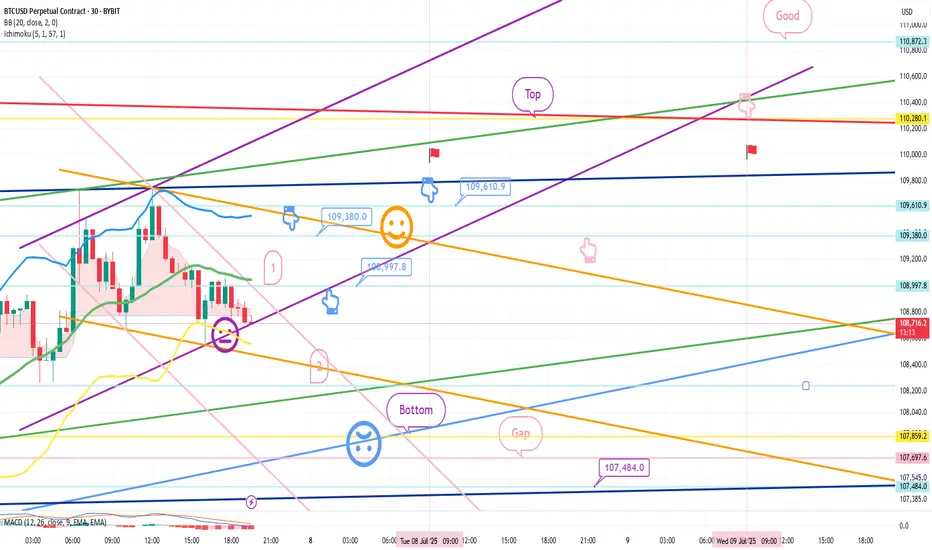
*When the blue finger moves
Bidirectional neutral
Short->long switching or 2nd section long waiting strategy
1. $109,380 short position entry section / cut-off price when orange resistance line is broken
2. $108,997.8 long position switching / cut-off price when purple support line is broken
3. $109,610.9 long position 1st target -> Top 2nd target -> Good 3rd target
It seems important whether the purple support line is broken from the current position. If the first section at the top touches 108,997.8 dollars and comes down,
it may become a vertical decline section.
If it comes down right away, it is a long-waiting strategy in the final second section,
and if it deviates from the bottom section today
(6+12 pattern)
because it is a full candle when the gap section is touched,
it may fall to 107,484 dollars indicated at the very bottom.
I have important work to do tomorrow,
so I will take a day off and come back on Wednesday.
Please use my analysis so far for reference and
I hope you operate safely with principle trading and stop loss prices.
Thank you.
Trendline Breakout in BTCUSDBitcoin has successfully broken above a descending trendline resistance on the 15-minute timeframe, indicating a short-term bullish breakout. The price action shows a clean structure of lower highs being invalidated, supported by strong bullish candles.
📈 Entry: Just above the breakout
🎯 Target Zone: Highlighted in green – potential to test recent highs
🛑 Stop-loss: Below the breakout candle or trendline retest zone
This setup aligns well with intraday breakout traders looking to capitalize on short bursts of momentum. Watch for confirmation and volume to sustain the move.

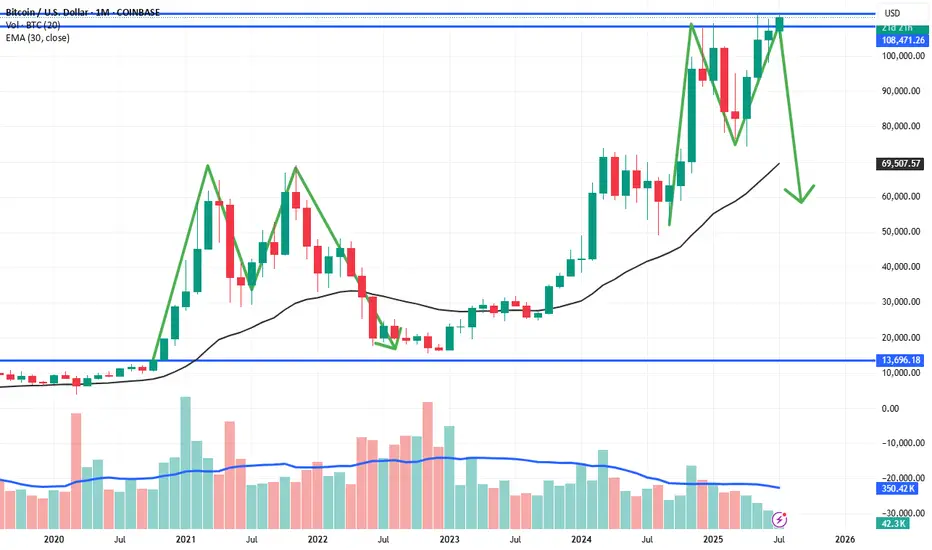
is Bitcoin starts becoming Double Top or M Pattern ???I think Bitcoin Starts becoming Double top or M Pattern in this or next month or it will become new high and then comes to bear zone to 65-75k zone . you can see historical Monthly chart , where M pattern shows clearly , and current scenario looks like same .
BTCUSD long setupPrice is ranging after giving a good upmove.. now its time for anothe push up..
We ll go short below only below the last support shown in the chart

BTCUSD – Short Setup on 15min ChartBitcoin has formed a range with multiple rejection wicks near the $108,970 resistance zone. Currently, price is showing weakness after a minor bounce and has started to turn bearish again.
🚨 Short Position Triggered
Entry: Around $108,725
Stop Loss: Above $108,970 (supply zone)
Target: $108,480 – Previous minor support & potential liquidity zone
If BTC breaks below $108,600 with volume, it could accelerate toward the lower support levels. Watch closely for a retest of the broken structure.
📉 Structure: Minor Distribution / Lower High
⏱️ Timeframe: 15-minute

Inside candle At the Top Inside candle forming and a new consolidation happening looking at 114k as target

Bitcoin Eyes Breakout — Bullish Setup Gathers StrengthConsolidation Above Key Support:
Bitcoin continues to hold firmly above the $100,000–$105,000 support zone, a critical area that acted as major resistance earlier in 2025. This sustained price action reinforces the prevailing bullish momentum and signals strength beneath the surface.
Wedge Formation Nearing Resolution:
The prolonged wedge pattern now taking shape suggests a substantial move is imminent. The structure supports a breakout scenario, with an initial target of $130,000–$135,000 in play.
Uptrend Intact, No Signs of Exhaustion:
Despite recent weeks of sideways action, Bitcoin continues to consolidate near its highs—a pattern that historically favors continuation, not reversal. The broader trend remains upward and firmly intact.
Focus & Opportunity:
Bitcoin's technical setup justifies close attention in the days ahead. At the same time, traders and investors should keep an eye on select altcoins, which could offer amplified upside as capital rotation picks up momentum.
#Bitcoin #BTC #Crypto #TechnicalAnalysis #BullishSetup #WedgeBreakout #PriceAction #Altcoins #CryptoMarket #MarketUpdate #AllTimeHigh
BTC/USD Stuck in Range | Watch VWAP & Key Support at 107.5K The recent rejection from near $110K and persistent selling pressure below VWAP across all intraday timeframes (45m/15m/5m/1m) shows bearish momentum building.
$BITSTAMP: BTCUSD
🔍 Key Observations:
VWAP: Price is trading below session VWAP on all short timeframes, showing intraday bearish sentiment.
Structure: Lower highs on the 4H chart signal weakening strength.
Support Zone: Immediate intraday support is seen near $107,500; a breakdown could lead to $106,000 or lower.
Resistance: Sellers are active at $109,000–$110,000.
Optionally add RSI (14) on 1H or 4H to watch for divergences near support/resistance levels.

