Cup and Handle Breakout in BTCUSDA classic Cup and Handle pattern has been spotted on the 15-minute BTC/USD chart, signaling a potential bullish continuation. After a well-formed consolidation and healthy pullback (the handle), price action has successfully broken above the resistance neckline, confirming the breakout. 📈
🔹 Pattern: Cup and Handle
🔹 Timeframe: 15-Min
🔹 Breakout Zone: ~$103,900
🔹 Bias: Bullish
🔹 Targets: Measured move suggests a potential upside continuation
🔹 Invalidation: A breakdown below the handle’s low
🧠 Technical patterns like these often provide high-probability setups when confirmed with volume and price action. Keep trailing your stop-loss and manage risk wisely.
Trade ideas

Bitcoin Price Analysis 21-22 June 2025COINBASE:BTCUSD is in downtrend.
STRATEGY:
1. If the price breaks above the upper level, consider a long position. This is supported by the higher lows formation in a smaller timeframe, suggesting a continuation of the upward trend.
2. Bearish Scenario: If the price breaks below the lower level, consider a short position, targeting potential stop-loss orders or liquidity pools created during the higher lows formation.
AREA TO AVOID
Area between the upper and lower levels due to price consolidation.

Compression Before Expansion: Market Awaits Its Next MoveBTCUSD – Compression Before Expansion: Market Awaits Its Next Move
Bitcoin is trading within a compressed structure after rejecting key resistance and retesting support. While the overall sentiment remains cautious, the technical setup is beginning to show signs of strength — if buyers can reclaim control.
🧭 Macro Check-In: Calm Before the Crypto Storm?
No rate cut from the Fed yet, but markets are starting to price in the possibility of a pause in Q3 or Q4.
ETF inflows slowing, but institutional positions are not closing — suggesting long-term conviction remains.
Political momentum in the US is shifting towards crypto adoption, with Bitcoin emerging as a talking point in election debates.
Dollar index (DXY) continues to chop, giving crypto room to breathe if inflation data remains mild.
In short: liquidity is building, but the trigger hasn’t fired — yet.
📊 Chart Structure (H1–H4): Levels That Matter
BTC is holding just above 103,100, a key level where previous demand stepped in.
The mid-range resistance lies at 104,184 — this needs to break for bulls to gain short-term control.
Above that, eyes are on 106,047, then 107,586 (top of the descending channel).
EMA alignment is still bearish → wait for structure shift, not FOMO.
📌 Trade Map
🔵 Buy Setup
Zone: 103,100 – 103,300
Condition: Bullish reaction + rejection wick / engulfing
SL: 102,600
TP: 104,184 → 106,047 → 107,586
🔴 Sell Setup (Only if trap triggers)
Zone: 107,500 – 107,800
Condition: Rejection + volume fade
SL: 108,200
TP: 106,000 → 104,500
🧠 Trader Insight
“When the chart compresses, smart money positions early.”
Bitcoin is not trending — it's accumulating or distributing. Retail is waiting for breakout. Smart traders are preparing for both scenarios.
Watch the reaction, not the prediction.
Stay objective. Let levels lead the logic.

Trendline Breakout in BTC/USDBitcoin has successfully broken above the descending trendline resistance on the 15-minute chart — a potential signal of short-term bullish momentum building up. 📈
📍Breakout Level: $105,380
🎯 Target: Around $106,600
🛡️ Stop-Loss: Below $104,390
Keep an eye on volume confirmation and price action near the breakout zone. This setup could offer a promising risk-to-reward opportunity! 💹

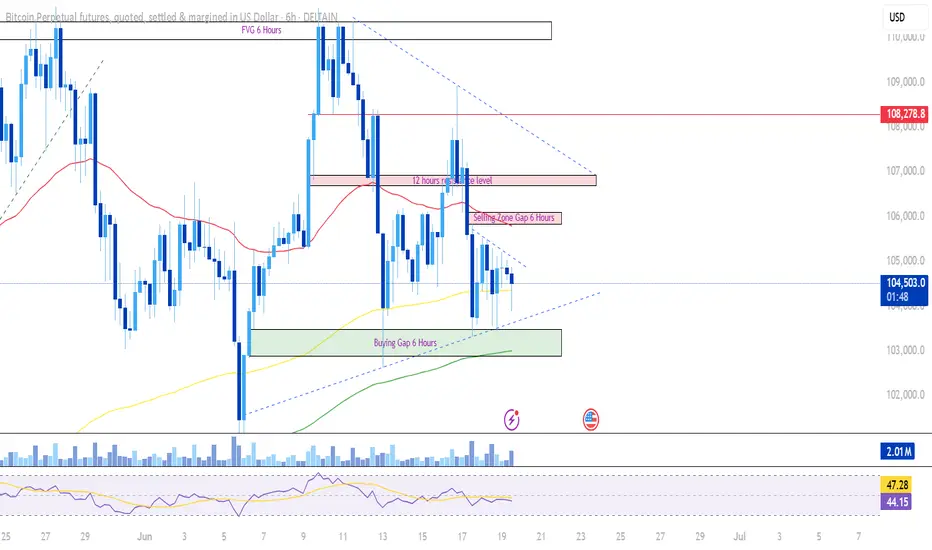
Trading Level for BTCBitcoin is currently trading in a triangle pattern, It would be interesting to see how BTC would it react at FVG level marked on the chart. If market breaks triangle pattern upside or downside it is important that candle should sustain either in 30 min or 15 min, then only one can plan trade towards the respective FVG levels. Personally I will take a trade near FVG level only, till then Only watching and Small level scalping.
Bitcoin more fall possible upmove possible on Ceasefire newsHow to take trades using Harmonic pattern projection Trade setup is explained below :-
Entry : 1st SL point : 0% is recent top or bottom.
Trailing D: 15.1% is work as trailing SL of buy or sell trade if hit then we have to book profit
.If price goes below 2nd D 22.5% to 24.5% range then early traders can make fresh reversals trade after breaking 1st D 15.1% safe traders can reversal trade after breaking Point D 22.5.4% to 24.5% range
Targets :
Target T1 : 36.1% to 38.3%
Target T3 : 49.1% to 52.5%
T3: 60.9% to 64.8% is our 3rd Target since this is reversal zone so must book profit if break then take fresh trade again
Target T4 : 76.4% to 79.7%
Next Targets are 100% , 127.2% ,141.4% and final Target 161.8%.
How to take reversal trade :
If price going upside/ downside then then buy or sell levels appear on Chart ( Automatically show when price reach any reversal zone of harmonic projection ).
Trailing SL:
After reach 1st Target trail SL to just above or below cost ( for example we are holding sell trade from 100 1st Target 110 hit then move trailing sl to 104-105 and move SL as price move upside or Downside)
Re- Entry :
For Re-entry in any pull back Point D ( 15.1% ) is used for re-entry then SL recent high or low Point SL ( 0% ) .
Blue Line is 1st support/ Resistance
Green line is 2nd support/ resistance
Red line is 3rd Support/ resistance
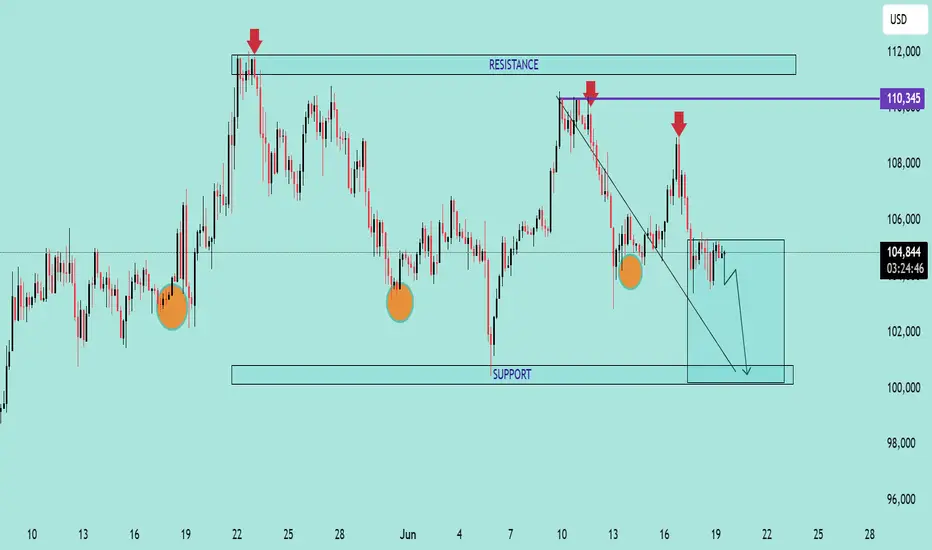
BTC/USD Bearish Outlook Analysis BTC/USD Bearish Outlook Analysis 📉🧠
📊 Technical Overview:
The BTC/USD chart is showing signs of a bearish structure formation, suggesting increased downside momentum in the short term.
🔻 Resistance Zone:
Clear resistance is identified near $110,345, marked by multiple price rejections (🔴 red arrows).
Price failed to break above this zone several times, indicating strong selling pressure.
🔸 Support Zone:
Strong support lies near the $100,000 psychological level.
Price has respected this zone multiple times (🟠 orange circles), indicating buyer interest.
📉 Current Price Action:
A descending trendline breakout attempt failed and price is now consolidating just below $105,000.
Price is forming a bearish flag/consolidation structure after recent rejection.
A breakdown from the current box range is likely to push BTC toward the support zone at $100,000.
📉 Bearish Scenario:
If BTC breaks below $104,000, expect continuation towards $100,000.
A daily candle close below support could signal further downside.
📈 Invalidation:
Bullish invalidation occurs if BTC reclaims and closes above $108,000, with volume, retesting resistance at $110,345.
🧭 Summary:
BTC/USD is exhibiting a lower highs structure within a descending channel. Unless it breaks above the resistance zone, the bias remains bearish with a high probability of retesting support.
BTC Traders: Crucial Levels Incoming 🚨 BTC Traders: Crucial Levels Incoming 👇
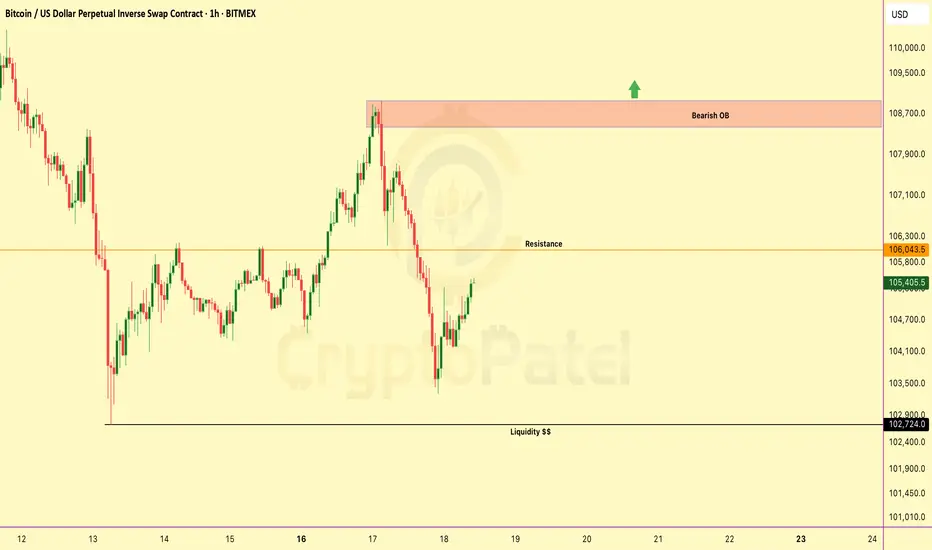
Bitcoin is hovering around $105,399 — and things are heating up.
$106K = Resistance.
A clean break could send us to the Bearish Order Block ($108K–$108.95K).
But here’s the danger zone:
🟥 OB = Last drop's origin.
Rejection here = major sell-off risk.
🔻 $102K = Liquidity pool.
Lose this level, and sub-$100K is on the table.
Current Bias:
– Hold below OB = Bearish
– Reclaim OB = Relief bounce
– Drop below $102K = Trend Accelerates Down
What’s your game plan here?
💬 Comment your next move
🔁 Retweet if useful
🔖 Bookmark for later

Bitcoin Bybit chart analysis June 17Hello
This is Bitcoin Guide.
It's been a while.
I took a break recently because the participation rate was not good.
Since it's been a while since I did an analysis, I did it in a short form,
I hope you enjoy it.
If you "follow"
You can receive real-time movement paths and comment notifications on major sections.
If my analysis was helpful,
Please click the booster button at the bottom.
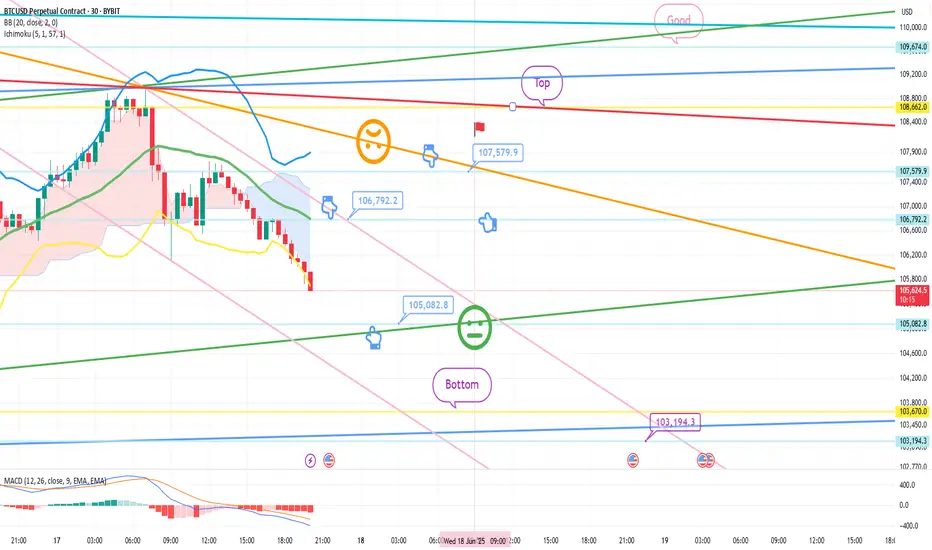
Here is the Bitcoin 30-minute chart.
I created a strategy based on the possibility of sideways movement in Nasdaq and the rebound of Tether Dominance.
* When the blue finger moves,
It is a two-way neutral short->long switching strategy.
1. $106,792.2 short position entry point / stop loss price when orange resistance line is broken
2. $105,082.8 long position switching / stop loss price when green support line is broken
3. $107,579.9 long position 1st target -> Top 2nd target price
If it goes down from the current position,
Check the bottom section -> up to $103,194.3.
Please use my analysis as a reference only
I hope you operate safely with principle trading and stop loss price.
Thank you.
BTC/USD Potential Bullish ReversalBTC/USD Potential Bullish Reversal 🟢📈
🔍 Technical Overview:
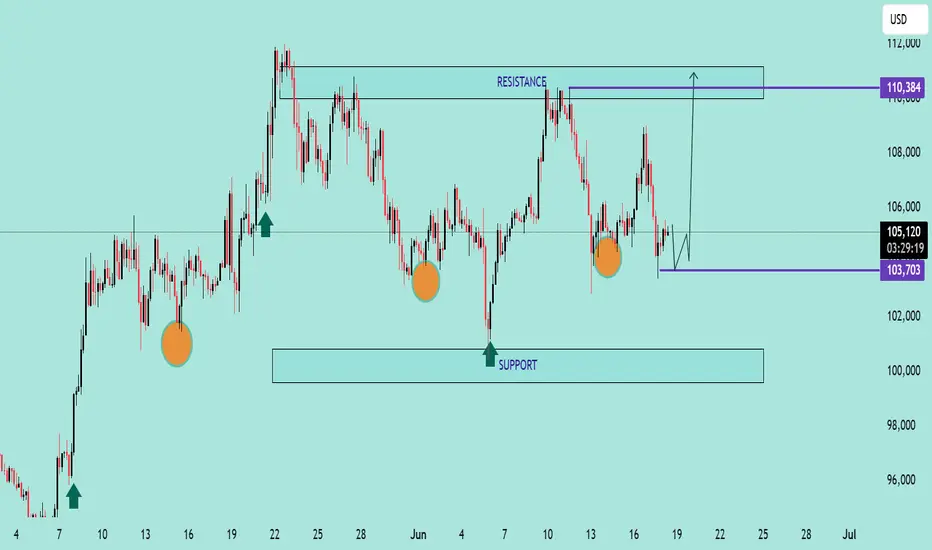
The chart shows a potential bullish reversal pattern forming near a key support zone. Price action has consistently bounced from the support range between $100,000 – $103,700, marked by multiple higher lows (🟠 orange circles), suggesting strong buyer interest.
📌 Key Levels:
Support Zone: $100,000 – $103,700 🛡️
Immediate Resistance: $110,384 🔼
Current Price: $105,202 💰
📊 Pattern Observed:
The price structure shows a possible inverted head and shoulders pattern forming, with the right shoulder currently developing. If this structure completes and breaks the $106,000–$107,000 neckline region, we can expect a bullish breakout toward the resistance target of $110,384 or higher.
📈 Bullish Confirmation:
Bullish rejection from support area ✅
Clean structure with repeated higher lows 📈
Potential breakout arrow suggests move toward the top resistance zone
⚠️ Watch For:
Price must hold above $103,700 to maintain bullish bias
Break below this level may invalidate bullish setup and retest the broader support zone near $100,000
📌 Conclusion:
BTC/USD is setting up for a potential upside breakout if the neckline is broken. Traders should monitor for bullish confirmation before entering long positions.
🔔 Strategy Suggestion:
Buy Zone: $103,700 – $104,500 (on bullish confirmation) 🛒
Target Zone: $110,000 – $111,000 🎯
Stop-Loss: Below $103,000 🛑
Bitcoin Ready to Blast or Waiting under $100k?BTC is currently trading near $105,399, showing a corrective bounce after a recent sell-off.
Resistance Ahead – $106k:
Price is approaching a key resistance level. A break above could lead to a short-term move toward the Bearish Order Block at $108000–$108950.
🟥 Bearish Order Block (OB):
This is the supply zone that initiated the previous drop. If price fails to break and hold above this OB, we could see renewed selling pressure and continuation of the downtrend.
🔻 Liquidity Pool – $102k:
This level holds resting sell-side liquidity. A failure to hold this area may trigger a sweep — and if $102K breaks, it could unlock deeper downside potential, possibly sending BTC below $100K.
Summary Outlook:
▪️ Rejection from OB = strong bearish continuation
▪️ Break of $106K = short-term bullish move toward OB
▪️ Break of $102K = high probability of sub-$100K levels
▪️ Overall bias remains bearish unless price reclaims and holds above the OB zone with strength.
NFA & DYOR
BTCUSD SHOWING A GOOD UP MOVE WITH 1:7 RISK REWARD BTCUSD SHOWING A GOOD
UP MOVE WITH 1:7 RISK REWARD
DUE TO THESE REASON
A. its following a rectangle pattern that stocked the market
which preventing the market to move any one direction now it trying to break the strong resistant lable
B. after the break of this rectangle it will boost the market potential for break
C. also its resisting from a strong neckline the neckline also got weeker ald the price is ready to break in the outer region
all of these reason are indicating the same thing its ready for breakout BREAKOUT trading are follws good risk reward
please dont use more than one percentage of your capitalfollow risk reward and tradeing rules
that will help you to to become a bettertrader
thank you

BTCUSDHello, I am BIDISHA.
In this post, we will analyze the BTCUSD symbol. Mark my words Friends-- as you can see, that bullish channel structure from 7 April. Now near support level is 103.300
If any reversal candle creates in D. chart above major resistance level with 2 days consecutive close. Then next target is set on the 30 DAYS time frame 127.000( within 15 July,2025)

BTC/USD Potential Reversal & Bullish Breakout SetupBTC/USD Potential Reversal & Bullish Breakout Setup 🔄🚀
Technical Analysis Overview:
🔹 Pattern Formation:
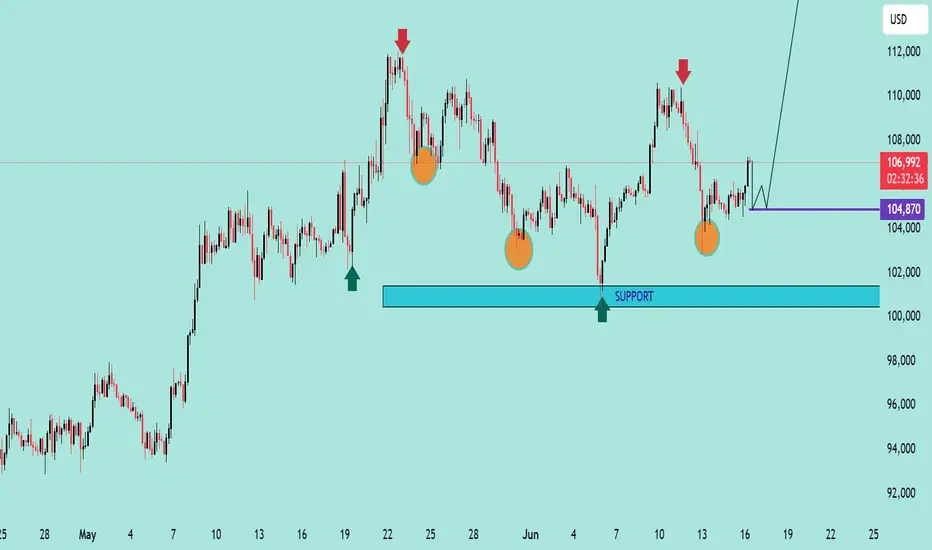
The chart displays a potential Triple Bottom pattern (🟠), a classic reversal signal forming at the $104,870–$100,000 support zone 🛡️. This structure suggests a strong base is being established for a potential upside move.
🔹 Support Zone:
📉 The price has consistently bounced off the major support area around $100,000–$104,870, indicating strong buying interest.
🔹 Resistance Zone:
📊 The key resistance level lies around the $114,000–$115,000 range 🔵, which has been tested multiple times in the past (🔴 arrows) and could act as a future profit target.
🔹 Price Action & Projection:
Currently, price is trading near $107,025 and is showing signs of bullish continuation after forming a higher low. If the price consolidates above the $104,870 zone and holds support, we could see a potential breakout targeting the $114,000 resistance 📈.
📌 Key Takeaways:
✅ Triple Bottom formation signals trend reversal.
🔄 Bullish structure confirmed above $104,870.
🎯 Next target: $114,000 if breakout holds.
⚠️ Watch for potential consolidation before continuation.
Bitcoin Bounce & Breakout PlayChart Analysis:
🔹 Support Holding Strong:
BTC is respecting a key support area (~$105,600), which previously acted as resistance (marked by recent ATH).
🔹 EMA 70 (Blue Line):
Price is hovering above the EMA, adding bullish confirmation.
🔹 Bullish Projection Path:
The chart shows a projected bullish move toward the sell zone near $113,200 – $113,300, representing a potential 4.4% gain from the breakout.
🔹 Key Zones:
Support Zone: $105,600
Supply Zone: $100,500
Sell Zone (TP Zone): $113,200+
📌 Outlook:
If BTC breaks and holds above the resistance (~$107,000), a strong upward rally could follow.
Entry near support or on breakout, with tight risk management, offers a favorable risk/reward.
✅ Entry Options:
Breakout Entry:
Trigger: Break and close above $107,200
Confirmation: Retest and hold above the breakout zone
Entry: $107,300 – $107,500
Support Bounce Entry:
Trigger: Pullback to support zone (~$105,600) with bullish reversal candle
Entry: $105,600 – $105,800
🎯 Target Zones (TP):
TP1: $110,400 (minor resistance)
TP2: $113,200 – $113,300 (major sell zone)
TP3 (aggressive): $114,000+
🔻 Stop Loss (SL):
For breakout entry: SL below $106,200
For bounce entry: SL below $105,200 or $104,800 (structure break)
📈 Risk–Reward Ratio:
Approx. 1:2.5 to 1:3+ depending on entry and target
🧠 Trade Management:
Move SL to breakeven after hitting TP1
Partial profit booking at TP1
Trail remaining with manual or dynamic SL (e.g., below EMA or recent low)
⚠️ Risk Notes:
Avoid chasing price without breakout confirmation
Watch for fakeouts and heavy selling near TP zones
Adjust position size based on your risk tolerance

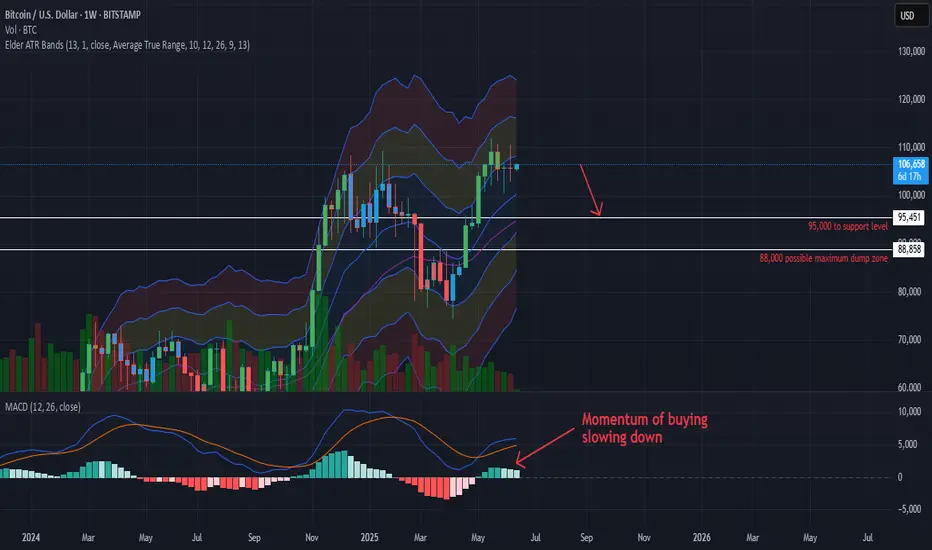
Weekly BTC Chart showing weakness on the MACD, drop to 95k?BTC’s weekly MACD is showing warning signs while price coiled under key resistance—setting the stage for a potential pullback.
Pullback to 95K
A bearish MACD crossover plus break of trend support could lead to $95K and possibly further to $88K–$90K.
But a strong breakout above $112K would shift momentum back sharply bullish.
Then by September / October in the fourth quarter, positive momentum comes back.
BITCOIN - STRUCTURAL SHIFT AMID CORRECTION & LIQUIDITY TESTSymbol - BTCUSD
CMP - 1,05,634
Bitcoin is experiencing a recovery following a liquidity sweep in the 1,00,000 zone. Despite the broader bullish trend, the local technical outlook remains mixed.
Bitcoin is currently undergoing a shift in market structure, with a change in character observed around the 1,06,700 level and a breakdown of the bullish structure at 1,03,000 during a corrective phase. This downward movement is testing liquidity beneath the 1,00,700 support zone. Several factors contribute to the ongoing liquidation: notably, the unexpected market reaction to tensions between Donald Trump and Elon Musk, and the liquidation activities of large holders (whales), which appear to be repeating historical patterns.
While traders are actively buying back Bitcoin, the overall market structure remains technically bearish. Locally, a downtrend is present, and a countertrend move interpreted as a form of 'liquidity hunting' is currently developing.
A key area of interest lies between 1,05,900 and 1,06,700. The initial retest of this zone may result in a false breakout due to insufficient momentum for sustained upward movement following the strong buyback.
Resistance levels: 105900, 106720, 110400
Support levels: 103000, 101400, 100,000
Following a correction from the 1,05,900 level, which may target the 50% retracement of the recent trading range, the market could potentially re-enter a bullish phase, provided buyers manage to maintain price levels and prevent a drop to new local lows. In the short term, a decline from 1,05,900 to 1,03,000 is anticipated. However, if the price subsequently recovers to the 1,05,500–1,05,900 range, there may be an opportunity for further upward movement toward the 1,10,000 level.

Bitcoin - Latest ReviewWeekly and Daily is Bullish.
4h in Bearish range.
4h LH needs to be breaken with imbalance and inducement candle. After there needs to be a retest till 50% of Fib level.
Smart Money and Market Structure will always save you from unnecessary entries. Save your capital, play SMART. KISS - keep it simple and straight.

BTCUSD – Bullish Breakout Retest on 15m Chart
Bitcoin has successfully broken above a key resistance zone and is now retesting it as support. The clean breakout followed by a retest around the $105,580–$105,620 area suggests bullish continuation if this zone holds. Risk-reward remains favorable with the potential for further upside towards the $106,250 zone.
📈 Entry: $105,600
📉 Stop-loss: $104,987
🎯 Target: $106,250
Keeping a close watch for bullish momentum confirmation on the next few candles.

BTC Decision Point – Are You Watching This?BTC Decision Point – Are You Watching This?
Bitcoin is reclaiming momentum after sweeping liquidity at $102.7K. It's now pushing toward major resistance at $106.1K.
But the real battle? The bearish OB at $107.2K–$108.9K — where price nuked last time.
✅ Break above = clear skies toward new ATHs
❌ Rejection = another trip to $102K or even Under $100K
🔁 Retweet if this helped
💬 Drop your bias below: Long or short?👇

Upside expected FibZone give good reversal...
Crypto market slow slow read to very big movement and is come soon

Bearish Retest at Wedge ResistanceBitcoin is currently showing signs of weakness on the 1H chart after a clean rejection from the top of the falling wedge structure. The move aligns with a bearish retest of the dynamic EMA ribbon and local trendline resistance.
Price failed to break above the wedge resistance and is now pushing lower, suggesting bearish continuation toward the lower wedge boundary near $101.3K–$102K.
This short setup invalidates above $106K.
Rejection candle confirming local resistance
Target: $102K (mid-zone confluence)
SL: Above $106K (structure break)

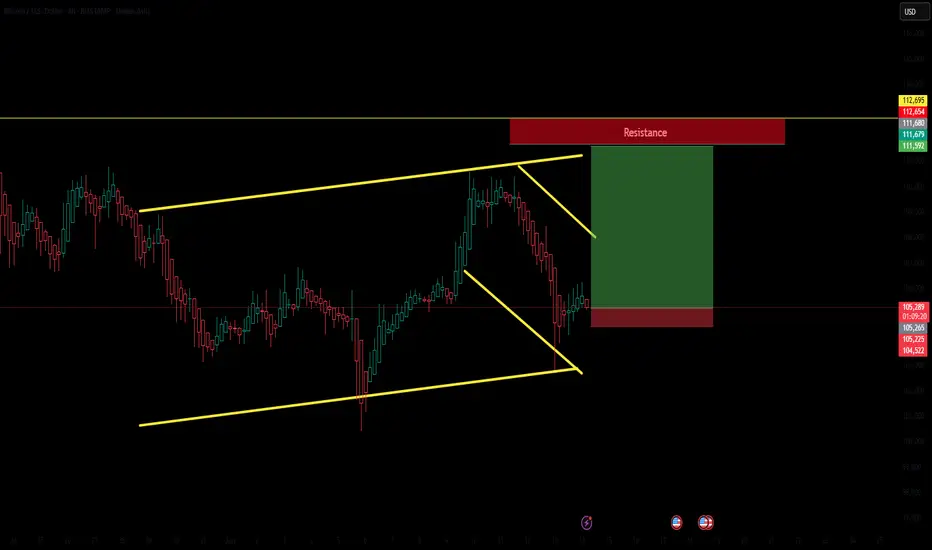
Bullish Falling Wedge Breakout Within Ascending ChannelBitcoin is currently presenting a strong bullish setup on the 4H chart. Price has bounced from the lower boundary of a long-standing ascending channel, forming a falling wedge — a classic bullish continuation pattern.
The breakout from this wedge aligns with a key support level and suggests a potential move toward the upper resistance zone at $111.5K–$112.7K, which also aligns with the upper trendline of the broader ascending structure.
Momentum confirmation above $106K could accelerate the upside move.
Target zone: $111.5K–$112K
Invalid if price breaks below $104.5K