BTC on verge of a major BreakoutBTC if closes above 108330 then we will see an ATH . Resistance is expected at 114565 but if we close above then we will see 131550. I am not expecting mkt to change direction anymore even if it touches 114565 maybe slight retracement or sideways for a couple of days only but we will soon see 131550.
Trade ideas

BTCUSD buying setupWe can see a good move to upper side in bitcoin :-
1.support
2.sellers trap
3.moving avrage setup

BTC/USD-Bullish Continuation 📍 Entry: 106,015
📈 Long Bias
Bitcoin is showing a healthy pullback after a strong upward move, offering a potential buy-the-dip setup in the $106K zone.
✅ Setup Highlights:
Higher low structure holding above $105,800
Strong bullish impulse followed by a corrective retracement
Buyer interest seen near the previous resistance-turned-support
🛑 Stop Loss: Below $105,500
🎯 Target: $107,400+ for initial TP
📊 Risk/Reward: ~1.5+


I am back with my BITCOIN prediction!! New all time high.....As per my analysis bitcoin is ready to break the roof top with it's long term rocket booster🚀.
Price takes the higher time frame liquidity and give nice push towards upside.
So the next resistance is consider as new all time high and get on the if you want.
Time is ticking, 3,2,1 suiiiiii🚀.
Just making fun with you guys.
Don't just follow mine blindly.
As you guys know the ongoing clash between musk and Trump.
I am with musk, so dollar will get hit( because of Trump).
They will show dollar is soo good. But America is falling.
You may ask, Trump is supporting the bitcoin, it will affect if he fails?
Yes I agree. It will affect a bit with some noise of market condition. Because
Trump is just a news,( like if you throw a stone into a water it will waves with sudden, overtime water will become to it own shape( fundamental is important) , bitcoin is also like water).
Consider that America is falling, new power is rising IYKYK.
This happens many times in the history ( rising and falling of empires).
I can say bit more , but this is enough to make a decision.
These are all my opinion, not a financial advise.
Comment your thoughts and share some of your knowledge with me.
I am ready to learn.

BTCUSDHello FRIENDS!
The BTCUSD price formed an ascending channel pattern in D. chart
At the moment, Price revers from support line!
So, if cross the resistance line than I expect a Bullish move .

BITCOIN FAILED HEAD & SHOULDERHere mentioning THREE things
First HEAD & SHOULDER PATTERN FAILED
Second fib .7 is not broken and bounced back
Third taken reversal from previous boBOTTOM which is in blue color.
this one is not my buy/sell call.

Bitcoin short upcoming Bitcoin is continuing its downside push. Huge press till dollar index makes shorts.

Bitcoin sell given near 106000, made low 100400 near huge profitHow to take trades using Harmonic pattern projection Trade setup is explained below :-
Entry : 1st SL point : 0% is recent top or bottom.
Trailing D: 15.1% is work as trailing SL of buy or sell trade if hit then we have to book profit
.If price goes below 2nd D 22.5% to 24.5% range then early traders can make fresh reversals trade after breaking 1st D 15.1% safe traders can reversal trade after breaking Point D 22.5.4% to 24.5% range
Targets :
Target T1 : 36.1% to 38.3%
Target T3 : 49.1% to 52.5%
T3: 60.9% to 64.8% is our 3rd Target since this is reversal zone so must book profit if break then take fresh trade again
Target T4 : 76.4% to 79.7%
Next Targets are 100% , 127.2% ,141.4% and final Target 161.8%.
How to take reversal trade :
If price going upside/ downside then then buy or sell levels appear on Chart ( Automatically show when price reach any reversal zone of harmonic projection ).
Trailing SL:
After reach 1st Target trail SL to just above or below cost ( for example we are holding sell trade from 100 1st Target 110 hit then move trailing sl to 104-105 and move SL as price move upside or Downside)
Re- Entry :
For Re-entry in any pull back Point D ( 15.1% ) is used for re-entry then SL recent high or low Point SL ( 0% ) .
Blue Line is 1st support/ Resistance
Green line is 2nd support/ resistance
Red line is 3rd Support/ resistance

Bitcoin (BTC/USD) 1H Chart Analysis – Double Top Signals BearishPattern Formed: DOUBLE TOP
⚠️ Bearish Reversal Pattern Spotted!
📍 Formed near 111,794.8
⬆️ Price tested the top twice and failed – strong resistance confirmed!
Key Zones:
🔶 SUPPLY ZONE (Resistance):
🟧 111,794.8 - 111,829.8
🔼 Expect selling pressure here!
🔷 SUPPORT Zone (Broken!):
🔻 Price fell below this level, confirming a bearish breakout
🟩 TARGET ZONE:
🎯 102,500.0
✅ This is the likely drop target based on the pattern
🧊 Other minor supports:
* 102,820.6
* 102,750.8
* 102,227.0.
Indicators:
📈 Trend Line
* Supported the price during the uptrend
* ❌ Now broken — indicates momentum shift
📉 EMA 70 (Red Line)
* Current Price (108,238.6) is below EMA 70 = 109,245.0
* Indicates bearish pressure.
Trade Setup:
🔽 Short Entry Idea: After support break
🛑 Stop Loss: 111,829.8
🎯 Take Profit: 102,500.0
⚖️ Risk-Reward looks attractive!
Summary:
📉 Bearish bias confirmed by:
* Double Top pattern
* Supply zone rejection
* Support break
* EMA crossover
🚨 Traders Watch Out: Bears are in control — next major stop likely at 102,500.0!


Bitcoin sell 106500-700 SL 109300 Target 98900-98500How to take trades using Harmonic pattern projection Trade setup is explained below :-
Entry : 1st SL point : 0% is recent top or bottom.
Trailing D: 15.1% is work as trailing SL of buy or sell trade if hit then we have to book profit
.If price goes below 2nd D 22.5% to 24.5% range then early traders can make fresh reversals trade after breaking 1st D 15.1% safe traders can reversal trade after breaking Point D 22.5.4% to 24.5% range
Targets :
Target T1 : 36.1% to 38.3%
Target T3 : 49.1% to 52.5%
T3: 60.9% to 64.8% is our 3rd Target since this is reversal zone so must book profit if break then take fresh trade again
Target T4 : 76.4% to 79.7%
Next Targets are 100% , 127.2% ,141.4% and final Target 161.8%.
How to take reversal trade :
If price going upside/ downside then then buy or sell levels appear on Chart ( Automatically show when price reach any reversal zone of harmonic projection ).
Trailing SL:
After reach 1st Target trail SL to just above or below cost ( for example we are holding sell trade from 100 1st Target 110 hit then move trailing sl to 104-105 and move SL as price move upside or Downside)
Re- Entry :
For Re-entry in any pull back Point D ( 15.1% ) is used for re-entry then SL recent high or low Point SL ( 0% ) .
Blue Line is 1st support/ Resistance
Green line is 2nd support/ resistance
Red line is 3rd Support/ resistance

BTCUSD selling view BTCUSD can be seen bearish :-
1.Resistance on the upper level
2.Buyers trap
3.Trading below moving averages

BITCOIN HOURLY CHANNELBITCOIN forming ascending hourly channel and respecting both the resistance and support trend line once it was broken which is clear here in chart.

BITCOIN BTCUSD MAJOR SUPPORT LEVELS- $88-92K
2ND MAJOR SUPPPORT LEVEL- $77-88K
Long Term Target- $180k minimum.

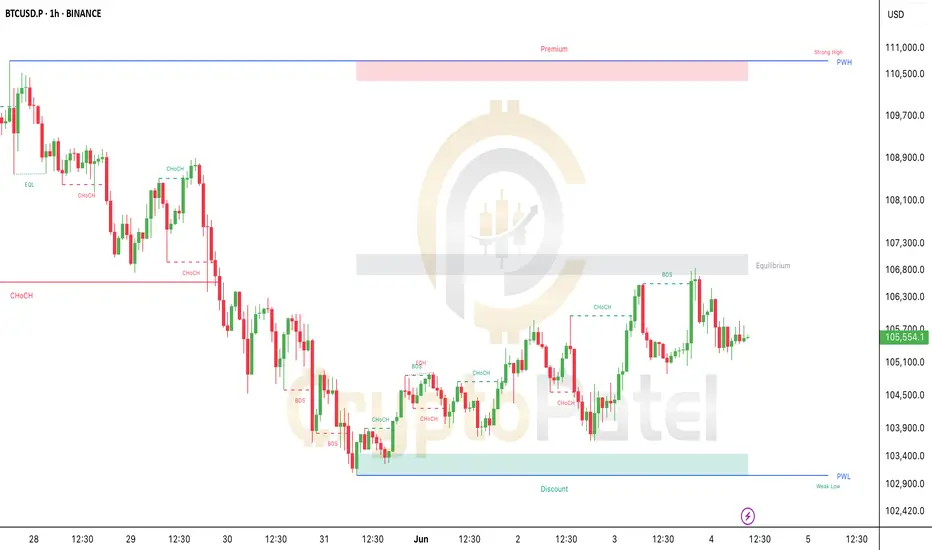
Breakout or Breakdown? BTC at Critical Level!Breakout or Breakdown? BTC at Critical Level!
#Bitcoin is showing early bullish signs after a clean reversal from the discount zone (~$103K).
We saw a CHoCH → BOS → Retest sequence play out perfectly!
Price is now consolidating just below a key supply zone (~$106.8K). This is the Equilibrium Zone – where smart money decides the next move.
🔹 As long as BTC holds above $104.2K, we stay bullish.
🔻 BUT – if we break below $103.4K, expect a deeper pullback, and we could even see Bitcoin drop under $100K for a proper liquidity sweep.
What’s Next?
If we reclaim $106.8K with strength, the next target is the Premium Zone around $110K–$111K, where major liquidity sits!
Watch for breakout or rejection – don’t FOMO. Patience = Profits.
BTC UPDATE-04-juneBTC UPDATE-
Yesterday We expected fall from top of the 106500 around a fall for downward price movement was expected.
Since price has not broken to the downside as we had as a second thought.
Now looks like pattern is forming diagonal. The wave we taken as C is not performing and also broke to the upside, it looks like WXY. so the changed marking looks like this and Y wave ABC move is expected to upside. We have a support zone around. 61.8% from 104908 to 104655 if price provide us upside move from above fall & breaks 38.2% of entire fall from B than we will look to go long from support for the swing of C wave.
Lets see how it plays out.

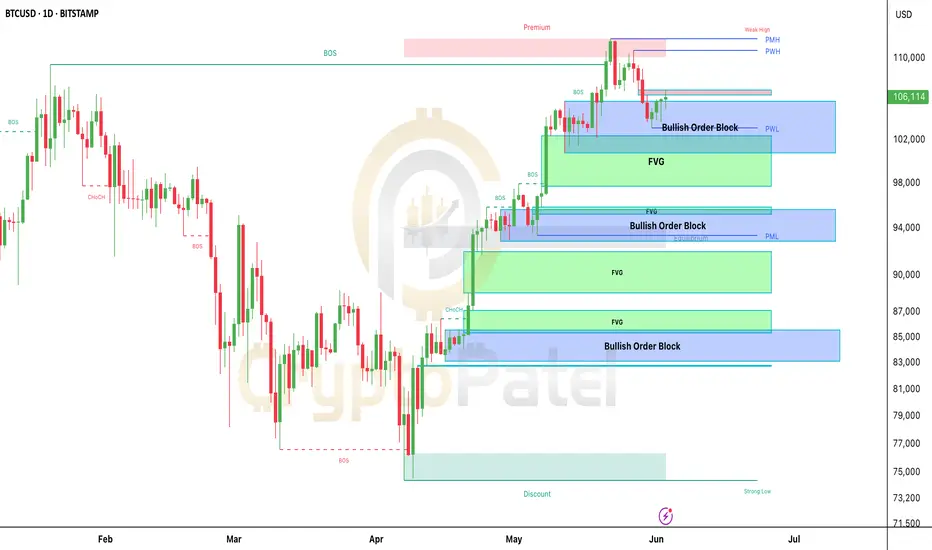
Bitcoin's Next Move: $110K Breakout or $94K Dip? SMC Decides#Bitcoin Daily Chart Analysis – Smart Money Update
As of today, BTC is trading around $105,800 and is showing signs of consolidation after reaching a key resistance zone near $110K.
Let’s break down what’s happening on the chart 👇
Current Market Structure
▶️ BTC has been in a clear uptrend, with multiple Breaks of Structure (BOS) confirming bullish momentum throughout April and May.
▶️ However, price recently entered a premium zone (above $110K), where it faced strong resistance.
▶️ This created a weak high, and we saw a Change of Character (CHoCH) that suggests buyers are slowing down.
Key Levels to Watch
$102K–$106K Zone (Current Area)
▶️ Price is sitting inside a Bullish Order Block + Fair Value Gap (FVG).
▶️ This is a strong support zone.
▶️ If this area holds, we could see a move back up toward $110K or even higher.
$93K–$96K Zone
▶️ Another clean Bullish OB + FVG combo.
▶️ If BTC breaks down from the current zone, this is the next major area where Smart Money might step in to buy.
$83K–$87K Zone
▶️ Deep discount zone, far below equilibrium.
▶️ If price reaches here, it’s a high-probability reversal area.
What Smart Money Might Do
▶️ If BTC holds above $102K–$105K, bulls could regain control and retest the highs near $110K.
▶️ If we break below this zone, expect a pullback toward $94K–$95K or even $87K, where more demand is waiting.
Fair Value Gaps (FVGs)
▶️ Several FVGs are visible, especially between $98K–$103K and $93K–$96K.
▶️ These gaps are areas of imbalance where price is likely to return and fill before the next move.
Summary
▶️ BTC is currently in a decision zone.
▶️ Holding above $102K = bullish continuation likely.
▶️ Breakdown = retracement into deeper bullish zones.
⚠️ As always, wait for confirmation on lower timeframes before entering any trade. Let the market show its hand.
Stay patient. Smart Money doesn’t chase—It waits.
NFA & DYOR
BTC -EW 3JUNE UPDATE||BTC- EW
PATTERN from recent low of 103151 now forming ABC pattern (expanding diagonal),
in which B is a irregular flat correction and is C is
looks like completing at now around 105600. downward price action is expected now, it can also become diagonal pattern in future if low of the pattern holds.
|Lets see what comes out.

BTC Market Sentiment Today (June 3, 2025) – In ShortSentiment: Neutral (Fear & Greed Index at 57)
• Price: ~$104,825 (down 0.38%)
• Volume: ~$43B (healthy activity)
Technical Indicators:
• MACD: Bearish crossover forming (possible short-term dip)
• RSI: 68 (near overbought – caution)
• Pattern: Bullish continuation, but facing resistance at $106K
Key Levels:
• Support: $103K–$104K
• Resistance: $106K
👉 Cautiously bullish, but a short-term pullback is possible.

Bitcoin 1D Technical Commentary & Bias Path - Bitcoin is currently trading at 104,521$
- The previous weekly close for BTC wasn't bullish and the following print or the current candle print does not indicate any bullishness based on the current price behaviour
- The drawings indicate that Bitcoin printed a new ATH, trapped many retail longs, and deviated right below the ATH by publishing a strong bearish print
- The following print after the ATH liquidated many late longs and also showed high sellers interest getting aggressive, now we have 2 possible playouts for BTC
- 1st path shows we can fall and fill the inefficient gap at 97,000$ flip a market structure shift to bullish and then pierce fresh highs
- The 2nd path shows we can simply purge the 1st inefficient gap and pierce through the second one which will eventually cascade a lot of liquidation and then we can finally move higher by bringing in extreme Fear

Bitcoin Crossroads: Will It Fall to $84K or Climb to $130K First🧠 Let’s break it down like a true crypto detective 🕵️♂️👇
📈 Classic Cup ☕ & Handle ☝ Breakout
After chilling below $74K for almost 3 years, #Bitcoin finally made its move and soared to $110K! 🔥
🔙 But then came the pullback… 😬
⚡ Bounced back from strong support at $74K – bulls didn’t give up yet 💪
📊 Current Setup?
👉 Moving inside an ascending channel 🔼
🔝 Resistance at $130K – coincides with breakout potential 🚀
🔻 Support at $84K – channel base ⚓
💡 Technical Signals You Shouldn't Ignore:
✅ Still above 50 & 100 EMA – trend intact 📈
⚠️ RSI at 61 & falling – momentum weakening ⚡
⚠️ Weekly RSI Divergence – clear bearish warning 🚨
🎯 Conclusion:
We’re in an indecisive zone ⚖️ – bullish structure but short-term bearish pullback signs are flashing 🟥
📍 Levels to Watch Closely:
$84K 🔻 | $110K ⚖️ | $130K 🔺
DYOR 🔍 & stay updated – markets move FAST!

Bitcoin to 101.500 support ?Bitcoin continues to trade within a well-defined descending channel, respecting both the upper and lower bounds consistently. Price is currently rejecting the midline of the channel, suggesting bearish continuation. A fresh short position has been marked, with a tight stop above local structure and a projected target at the lower boundary near $101,528, offering a favorable risk-reward ratio. Until price breaks convincingly above the channel, the trend remains bearish.
