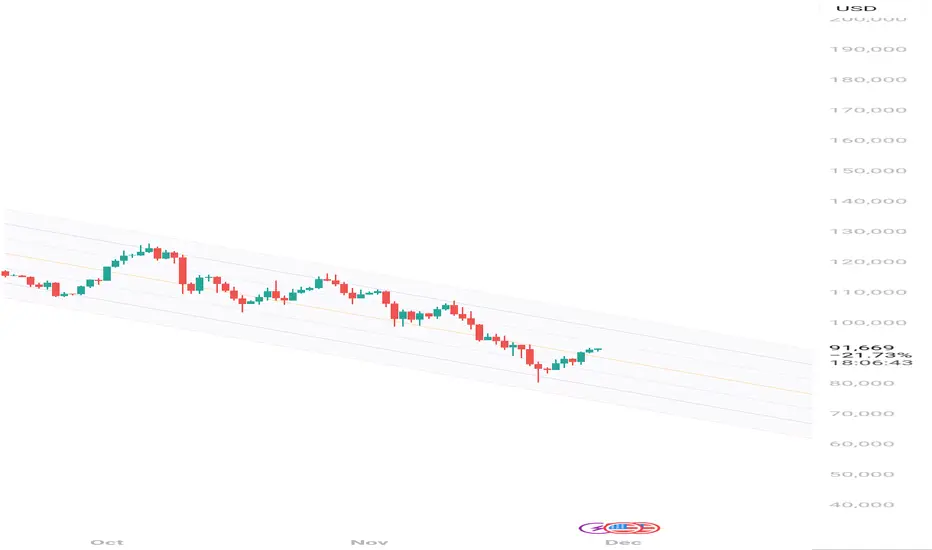
BTCUSD TREND BUY MOOD✅ Trend Analysis
Price is moving inside an upward channel (purple lines) → Trend = Positive / Bullish.
Market is consolidating just below a strong resistance zone around $91,800–$92,200.
Multiple demand (support) zones below → buyers active.
✅ Buy Levels (Entries)
Use confirmation (bullish candle / breakout / retest).
1️⃣ Breakout Buy
Buy above: $92,300 (after candle close)
Reason → Breaking the supply zone → fresh bullish continuation.
2️⃣ Pullback Buy (Safe Entry)
Buy near support: $90,300 – $90,800
Reason → Strong demand zone + channel support confluence.
3️⃣ Deep Dip Buy (Strong Demand Zone)
Buy: $87,000 – $87,500
Reason → Multiple rejections earlier + structure demand.
🎯 Targets (TP Levels)
For Breakout Entry
TP1: $93,000
TP2: $94,400
TP3: $96,000
For Pullback Entry
TP1: $91,800
TP2: $92,300
TP3: $93,800
For Deep Dip Entry
TP1: $89,500
TP2: $91,800
TP3: $94,000
⛔ Stop-Loss Levels
Breakout Buy SL
Below $91,300
Pullback Buy SL
Below $89,600
Deep Dip Buy SL
Below $85,500 (below demand zone)
📌 Final Summary
Entry Type Buy Level Stop-Loss Targets
Breakout Above $92,300 $91,300 $93,000 → $94,400 → $96,000
Pullback $90,300 – $90,800 $89,600 $91,800 → $92,300 → $93,800
Deep Dip $87,000 – $87,500 $85,500 $89,500 → $91,800 → $94,000
Trade ideas

Parallel Channel Idea 1 day TF
For intraday traders, no trading zones are 98k and 104k.
My opinion is, BTC will go up till 98k and fall down to 86-88k for final correction phase.
Also, please don't follow any opinions.
Look at the chart yourself, the channel trend, ema support areas, and candle pattern in various TFs.
BTCUSD - Wave 5 Decline Still Likely AheadPrevious Analysis:
BTC is approaching a critical reaction zone where the current rise looks more like a corrective push than the start of a new trend. Price is moving toward the highlighted supply region, which aligns with a potential wave 4 completion inside the descending channel. The structure from the recent low shows an internal a–b–c formation, suggesting this bounce could run into exhaustion as it enters the red zone. Unless BTC breaks out of the channel with conviction, the broader momentum still leans bearish. A rejection from this region would likely trigger the final wave 5 leg, driving price toward deeper Fibonacci levels and completing the corrective cycle before any meaningful recovery attempt can begin.
Stay Tuned!
@Money_Dictators

short BTCbitcoin on higher time frame is at a strong supply zone and gave ltf confirmations for downside potential.
study the reaction at any retracement for potential down move.

Part 12 Trading Master Class How Put Options Work
A Put Option gives the buyer the right to sell the underlying asset at the strike price.
You buy a put when you expect the market to fall.
Example:
Nifty at 22,000
You buy 21,800 PE at ₹45 premium.
If Nifty drops to 21,600:
Intrinsic value = 21,800 – 21,600 = ₹200
Profit = 200 – 45 = ₹155
If Nifty stays above 21,800, you lose only the premium.

Part 9 Trading Master Class With Experts What Are Options?
Options are derivative contracts. This means their value is derived from an underlying asset—such as Nifty, Bank Nifty, stocks like Reliance or TCS, commodities, or currencies.
There are two types of options:
Call Options (CE) – Right to buy at a specific price
Put Options (PE) – Right to sell at a specific price
But remember this key point:
Options give a right, not an obligation.
This is what makes options asymmetric:
Buyers have limited risk and unlimited potential gain.
Sellers (writers) have limited profit but potentially high risk.

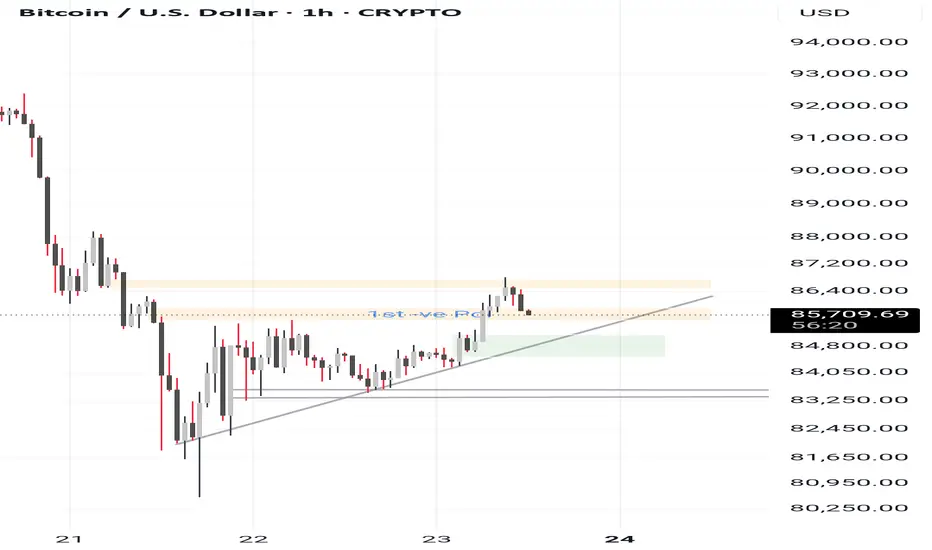
BUY BITCOIN FOR SHORTTERM SWINGbuy bitcoin at 85500 for target of 94100 for short term with stoploss of 83300 it is at a harmonic support can give a pull back

BTCUSD Liquidity Sweep Setup Before Bearish ContinuationBTCUSD Liquidity Sweep Setup Before Bearish Continuation
Overview
BTCUSD continues to display persistent downside pressure across the mid-term structure. Price action on the 3H timeframe shows a sequence of lower highs and lower lows, reflecting sustained bearish control. Despite short periods of stabilization, the overall market environment remains distribution-driven.
Market Structure
Recent price behavior confirms multiple break-of-structure (BOS) events, each reinforcing the broader downward momentum. Every attempt at upward expansion has been met with supply absorption, indicating that buyers are failing to regain initiative. The consolidation developing in the current region suggests an accumulation of short-term liquidity, but without structural evidence of reversal.
Supply & Liquidity Context
Price is positioned directly beneath a key supply zone highlighted on the chart. This zone remains unmitigated and acts as the primary area where counter-trend reactions are likely to be absorbed. The tightening range beneath this level indicates liquidity buildup, commonly preceding engineered sweeps by institutional players.
The current model suggests that the market may execute a short-term liquidity run above local highs before resuming its downward trajectory. Such a move would align with previous behavior in this trend cycle, where short-term rallies were primarily used to deliver liquidity into higher-timeframe supply.
Downside Expansion Risk
Should the market complete a liquidity sweep into the supply zone, the next phase of downside continuation becomes probable. The structural projection on the chart anticipates a revisiting of the lower demand region around 74,300 – 75,000, an area aligning with previous inefficiencies and untested demand.
This target supports the continuation of the broader bearish structure unless a significant shift in order flow emerges.
Summary
BTCUSD remains positioned within a well-defined bearish cycle, characterized by repeated structure breaks and unmitigated supply zones controlling price. Current compression suggests the market is preparing for another liquidity-driven move. Unless buyers regain structure above the key supply region, the market retains a high probability of extending toward lower demand zones.

BTC What IF || Bull or bear$70K is the critical support, As long as price holds that trendline, the bull structure remains intact Upside only confirms if price reclaims $92K → $100K.
Support: around $70K–$72K, Resistance: around $92K EMA-100 is near $112K (long-term dynamic resistance above). RSI was oversold ~32 and is trying to recover, also a falling RSI trendline, showing potential bullish divergence.
I’ve marked a possible 5-wave impulse:
1 → bounce
2 → deeper retest (near 70K)
3 → strong move up
4 → pullback
5 → final push (above $100K)
The information shared is for general purposes only and should not be considered as professional advice. All views expressed are my own and do not represent the opinions of any organization I am associated with.

#bitcoin respected #fibbo#bitcoin respected #fibbo
all fibbonaci ratio being respected by chart pattern
waiting for reversal hope for best

How many wants to join free live market analysis?How many interested?
Join live market
Learn live market sentiment
That is everything , closing market looks good to trade but what we learn in live market will make u understand the real behaviour of market.
Let go
Just like it, we will update asap where u want to join
BTC SELL SIDE TRADE WHY? BTC sell side trade
* why choose to sell?
* All over trend is sell side.There was 1hr -ve POI. we required to make sure in smaller time frame as well, in 15 mins three was a Liquidity cluster, so hit all sell side people, and that we want.
* In 1min time frame there was trendline breakout as well structure break.
* so we took sell trade and target would be nearest liquidity as we discussed online.
thanks

BTC out of box and retest done.. going upBitcoin long position is on the way. Btc is now out of critical box expected now to get reward same like range of box. So as marked it can go upto trendline to test it and completes the range on buying side in short term then after trendline hits we need to see for next move.

Bitcoin harmonic 73-81k bitcoin
Volume support+ harmonic shark pattern+ harmonic crab pattern complete at 81k/80k

Cryptocurrency as a Digital AssetUnderstanding Cryptocurrency as a Digital Asset
A digital asset is anything stored electronically that can provide value. Examples include images, documents, software, and digital currencies. Cryptocurrency falls within this category but stands apart because it is programmable, transferable, scarce, and secured through cryptographic algorithms.
A cryptocurrency is a digital or virtual currency that uses blockchain technology and cryptography to secure transactions, verify ownership, and regulate the creation of new units. Unlike traditional money issued by governments (called fiat currency), cryptocurrencies are usually decentralized, meaning no single authority controls them.
The idea behind cryptocurrency is to create a trustless system, where people can transact securely without needing banks, payment processors, or intermediaries.
Key Features of Cryptocurrency
1. Decentralization
Most cryptocurrencies operate on a distributed network of computers (nodes) worldwide. Instead of being stored on one central server, the entire ledger of transactions is shared among thousands of participants.
This decentralized nature:
Reduces the risk of manipulation
Prevents single points of failure
Makes the system transparent and censorship-resistant
Bitcoin, for example, is maintained by a network of miners and nodes spread across the globe rather than by any government or corporation.
2. Blockchain Technology
Blockchain is the underlying technology that makes cryptocurrencies possible. It is a chain of blocks, where each block contains:
Transaction data
A timestamp
A cryptographic hash
Once data is added to the blockchain, it becomes nearly impossible to alter, ensuring immutability and security.
Blockchain acts as a public ledger. Anyone can view transactions, but identities are hidden behind cryptographic addresses, offering both transparency and privacy.
3. Cryptographic Security
Cryptocurrencies use advanced cryptography to secure transactions and control the creation of new units. Public-key cryptography ensures that:
You can share your public address safely
Only you can spend your funds using your private key
The private key acts as a digital signature, proving ownership of the asset.
4. Limited Supply and Scarcity
Many cryptocurrencies have a fixed supply, which gives them scarcity—one of the key factors that drive value.
For example:
Bitcoin has a maximum supply of 21 million coins
This scarcity creates a digital form of gold
In contrast, fiat currencies can be printed endlessly, causing inflation. Limited supply helps certain cryptocurrencies hold value over time.
5. Peer-to-Peer Transactions
Cryptocurrency enables direct transactions between users without intermediaries. This:
Reduces transaction fees
Speeds up cross-border payments
Increases accessibility for the unbanked population
A Bitcoin transaction can be sent across continents within minutes, regardless of banking systems or government restrictions.
Types of Cryptocurrencies
Cryptocurrencies can be classified based on their purpose and technology.
1. Bitcoin (BTC) – Digital Gold
Bitcoin was the first cryptocurrency, introduced in 2009 by the anonymous creator Satoshi Nakamoto. Its main purpose is to act as:
A store of value
A medium of exchange
A hedge against inflation
Bitcoin is often referred to as digital gold due to its scarcity and decentralized nature.
2. Altcoins – Alternatives to Bitcoin
Thousands of cryptocurrencies followed Bitcoin, called altcoins. Examples include:
Ethereum (ETH): A blockchain that supports smart contracts and decentralized applications (dApps)
Ripple (XRP): Focused on fast and cheap international payments
Litecoin (LTC): Faster and lighter version of Bitcoin
Each altcoin has unique features or improvements over Bitcoin.
3. Stablecoins
Stablecoins are cryptocurrencies whose value is pegged to stable assets like the US Dollar or gold. Examples:
USDT (Tether)
USDC (USD Coin)
They are widely used in trading and decentralized finance because they reduce price volatility.
4. Tokenized Assets and Utility Tokens
Many blockchains allow digital assets to be created on top of them. These tokens represent:
Access to services (utility tokens)
Ownership in projects (security tokens)
Real-world assets like real estate or stocks
Tokenization expands the use of blockchain beyond currency.
How Cryptocurrency Works as a Digital Asset
1. Creation of New Units
New cryptocurrency units are created in different ways:
Mining: Solving complex mathematical problems (Bitcoin, Litecoin)
Staking: Locking cryptocurrency to validate transactions (Ethereum 2.0, Cardano)
Algorithmic issuance: Based on demand and supply mechanisms
Mining and staking secure the network and process transactions.
2. Storing Cryptocurrency
Cryptocurrencies are stored in digital wallets, which can be:
Hot wallets: Connected to the internet (mobile or desktop apps)
Cold wallets: Offline storage (hardware wallets or paper wallets)
Wallets store private keys, not the coins themselves.
3. Transferring Ownership
A cryptocurrency transaction involves:
Sending funds from one address to another
Verifying the transaction through miners or validators
Adding it to the blockchain
This digital transfer of ownership is secure, fast, and irreversible.
Why Cryptocurrency Has Value
Cryptocurrency holds value due to several factors:
1. Scarcity
Fixed supply creates demand over time.
2. Utility
Smart contracts and decentralized applications give certain cryptocurrencies real-world use cases.
3. Decentralization
People value assets not controlled by governments.
4. Trustless System
Blockchain eliminates the need for middlemen.
5. Global Acceptance
Businesses, investors, and governments are increasingly adopting cryptocurrencies.
Advantages of Cryptocurrency as a Digital Asset
Borderless transactions
Lower fees compared to traditional banking
Secure and transparent system
24/7 market accessibility
High liquidity in major coins
Supports financial inclusion
Cryptocurrencies also introduce entirely new industries:
Decentralized finance (DeFi)
Non-fungible tokens (NFTs)
Web3 applications
Risks and Challenges
Despite advantages, cryptocurrencies face risks:
Price volatility
Regulatory uncertainties
Scams and hacks
Loss of private keys leading to loss of funds
Awareness and proper risk management are essential.
Conclusion
Cryptocurrency, as a digital asset, represents a major shift in how value is created, stored, and transferred. Powered by blockchain technology, it enables decentralized trust, global accessibility, and programmable financial systems that challenge traditional banking models. While it offers immense opportunities, it also requires careful understanding due to its risks and evolving regulatory landscape. As technology matures, cryptocurrency is likely to play an even greater role in global finance and digital ownership systems.
Trading Is So Simple Trading Is So Simple 😅😅
I know you not agree with me but really trading is simple.
look the chart BTC make double top and also take retest how easy setup any go get massive profit via trial your stoploss.
Another way we can say this is a big advantage of TECHNICAL ANALYSIS
CRYPTO:BTCUSD

BITCOIN NEED BREATHE CRYPTO:BTCUSD
BTC need take relief of selling because selling is continuously happened so one little bounce is possible and that bounce works as retest of channel breakdown.
Reverse Scenario:
Formation of any bottom pattern
V shape recovery
Long consolidation after with volume brake out.
All chances is possible but there are low possibility
🧠 Always DYOR (Do Your Own Research)
⚖️ This is not financial advice or suggestion
👉 “Risk Is Real 💸 Stay Practical🚀”
💬 Please feel free to ask any questions (It's Free)

Part 7 Trading Master Class With Experts Non-Directional Strategies
Used when markets are expected to be sideways or volatile.
1. Straddle (Buy Call + Buy Put)
Profit from high volatility in any direction.
2. Strangle
Cheaper version of straddle, using OTM options.
3. Iron Condor
Sell OTM call and put spreads.
Used for stable markets to earn premium.
4. Butterfly Spread
Low-cost strategy for low volatility expectations.
These strategies help traders benefit from volatility, time decay, and neutral price movements.

BITCOIN POSSIBLE SCENARIOHello traders,
Bitcoin is in correction phase, circle wave 3of3 has been completed, now we have to wait for price enter in our point of interest might be price will go for 3 of 5 wave. if price react in our poi area then we have to act accordingly.

If This Is Just Beginning Than End Is Danger.CRYPTO:BTCUSD
Weekly Closing Is Importance For Confirmation And If We Get Confirmation Than Follow Through Is Another Confirmation.
Channel breaking started. if we calculate channel target then around $45000 USD 💀
Please Do Your Own Research Before Talking Any Trade.
I am not finical advisor.
If you have any questions, please feel free to ask me.

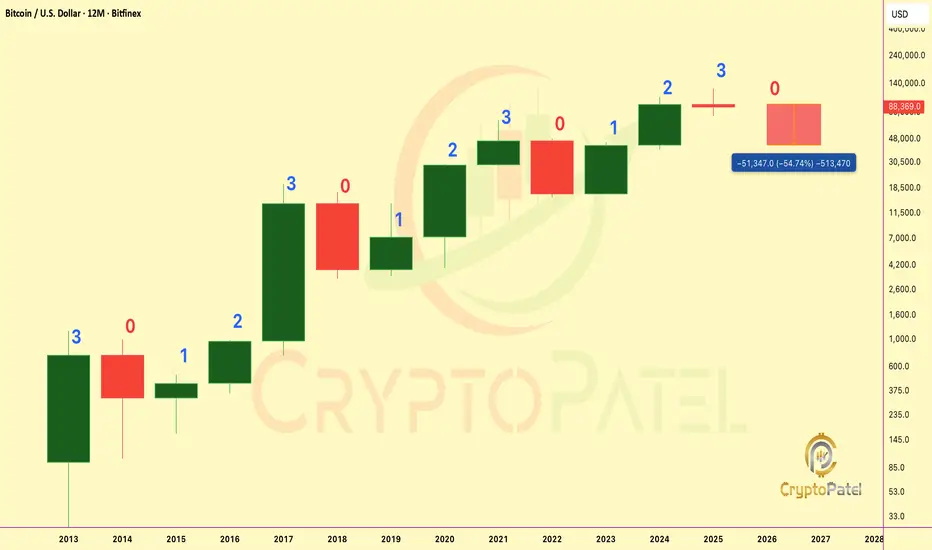
Bitcoin Most Critical 40 Days of the Entire Cycle🚨 Bitcoin Most Critical 40 Days of the Entire Cycle 🚨
CRYPTOCAP:BTC Yearly Fractal is clear: RED → 3 GREEN → BIG RED.
2025 = Candle 3, historically the strongest and always breaks ATH.
Bitcoin can hit a new ATH ONLY this year.
If BTC does not break ATH in the next 40 days, history shows it never breaks the 3rd candle high the following year: Meaning 2025 becomes the cycle top, and 2026 turns into a 50–70% retracement year ($30k–$40k).
✔ Break ATH → $150k–$180k
❌ No ATH → Biggest Correction of the Cycle in 2026
NFA & DYOR

BTC shortshort setup on bitcoin aligning with higher time frame.
study the reaction from markings on ltf for direction
