Bitcoin looks bullish BTC looks bullish with volume and ascending in price , given with targets and safe exits, Just for educational purpose
Trade ideas

Bitcoin 4H Technical Analysis Bullish Continuation Toward $111kCurrent Price Context:
BTC/USD: $103,696.63
EMA (70): $96,211.07
Trend: Bullish 📈
---
Key Zones & Analysis:
1. RBR Zone (Demand Zone) 💙
Price Range: $95,435.39 – $97,986.81
This area is a bullish support zone where price previously consolidated before the breakout.
Potential entry/buy zone 📍
If price pulls back: Bounce expected here 🔁
🟦 RBR Zone:
🔵 97,986.81
🔵 96,211.07 (EMA support)
🔵 95,435.39
---
2. Resistance / Short-Term Supply 🟥
Small blue box above current price
May cause a minor rejection before a breakout
Keep an eye out for price action signals here 👀
🟥 Resistance:
🟥 ~103,700 – 105,000
---
3. Target Zone 🎯
Main Target Point: $111,415.32
Target Range: $111,281.04 – $112,959.60
If price breaks above resistance, this is the next major target
Take profit zone 💰
🎯 Target Area:
🔵 111,281.04
🔵 111,415.32
🔵 112,959.60
---
Possible Price Path:
1. 🔼 Break above current resistance
2. 🔁 Or pull back to RBR zone
3. 🎯 Final move toward target zone

BTC next bull cycle has just started!The bull cycle for BINANCE:BTCUSDT is different.
While everyone waited to start the cycle in December 2024, the actual cycle is starting now.

Bitcoin 101000 Target hit ,next 104800 and 107500 , How to take trades using Harmonic pattern projection Trade setup is explained below :-
Entry : 1st SL point : 0% is recent top or bottom.
Trailing D: 15.1% is work as trailing SL of buy or sell trade if hit then we have to book profit
.If price goes below 2nd D 22.5% to 24.5% range then early traders can make fresh reversals trade after breaking 1st D 15.1% safe traders can reversal trade after breaking Point D 22.5.4% to 24.5% range
Targets :
Target T1 : 36.1% to 38.3%
Target T3 : 49.1% to 52.5%
T3: 60.9% to 64.8% is our 3rd Target since this is reversal zone so must book profit if break then take fresh trade again
Target T4 : 76.4% to 79.7%
Next Targets are 100% , 127.2% ,141.4% and final Target 161.8%.
How to take reversal trade :
If price going upside/ downside then then buy or sell levels appear on Chart ( Automatically show when price reach any reversal zone of harmonic projection ).
Trailing SL:
After reach 1st Target trail SL to just above or below cost ( for example we are holding sell trade from 100 1st Target 110 hit then move trailing sl to 104-105 and move SL as price move upside or Downside)
Re- Entry :
For Re-entry in any pull back Point D ( 15.1% ) is used for re-entry then SL recent high or low Point SL ( 0% ) .
Blue Line is 1st support/ Resistance
Green line is 2nd support/ resistance
Red line is 3rd Support/ resistance

Bitcoin At Big Resistance level so What Next?#BTC/USDT Update – Price at Critical Resistance
The chart structure remains unchanged from our previous update.
🔸 After entry, price dipped ~5% below our zone, but has now printed a strong bullish candle, signaling potential upside momentum.
🔸 However, Bitcoin is currently trading at the upper boundary of the ascending channel, acting as resistance.
Key Level to Watch:
If the HTF candle closes above $99,500, it will signal strength, and I’ll consider closing short positions and initiating fresh long setups.
Important Note:
The current pattern resembles a liquidity trap, not a clean bullish continuation. That’s why I remain cautious.
✅ Plan:
🔸 Wait for confirmation > $99,500
🔸 Use tight stop-loss – no blind trades.
Stay sharp, monitor price action closely.

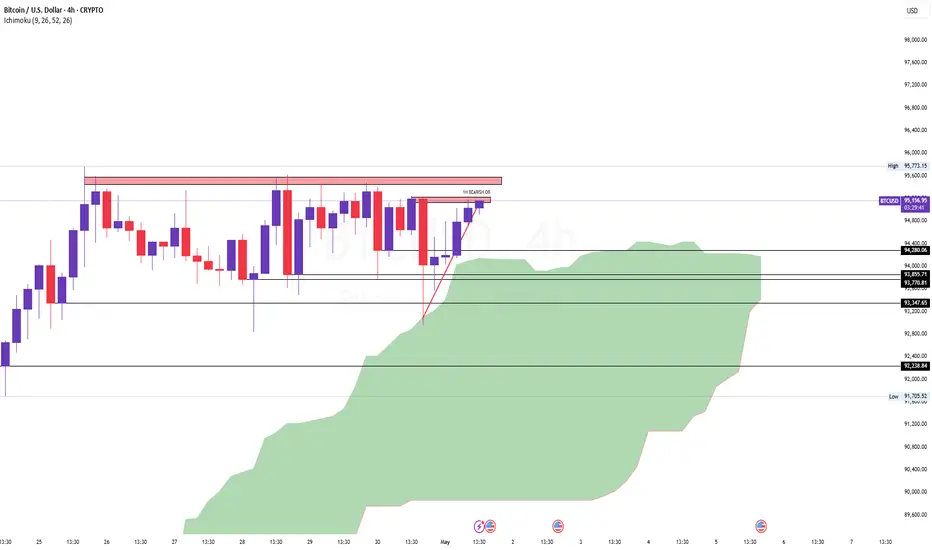
Bitcoin Bybit chart analysis May 2 Hello
It's a Bitcoinguide.
If you have a "follower"
You can receive comment notifications on real-time travel routes and major sections.
If my analysis is helpful,
Please would like one booster button at the bottom.
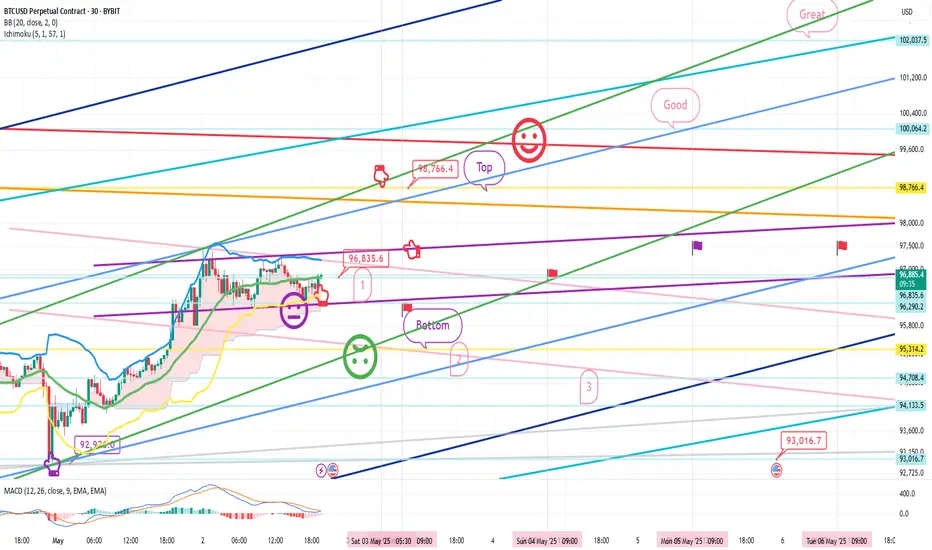
Here is the Bitcoin 30-minute chart.
There will be an indicator announcement at 9:30 in a little while.
Unlike Nasdaq, Bitcoin touched the upper Bollinger Band first and is on the verge of an upward trend.
Since there is a possibility of missing the entry point at the current position,
I set the stop loss price short and proceeded aggressively.
*One-way long position strategy when the red finger moves
1. Pursuit purchase at $96,835.6 / When the purple support line is broken,
or when the bottom section is touched, stop loss price
2. Long position target price at $98,766.4 -> Good 2nd target -> Great 3rd target
If the Great section is broken at the top,
the probability of a new high price is high.
From the bottom touch, the mid-term pattern will be broken
(currently 6+12 in progress)
When looking at the candle shape, from the green support line bottom breakout
It can break out strongly, so please refer to the bottom 2, 3 times up to 93016.7 dollars, and if 93K breaks, a downward trend can be connected again, so
You should be careful.
I left the analysis article up to May 6th
and the main points and the drawing section on one page, so it's hard
Please just refer to and use my analysis article up to here
I will see you next week after the holiday.
Thank you.
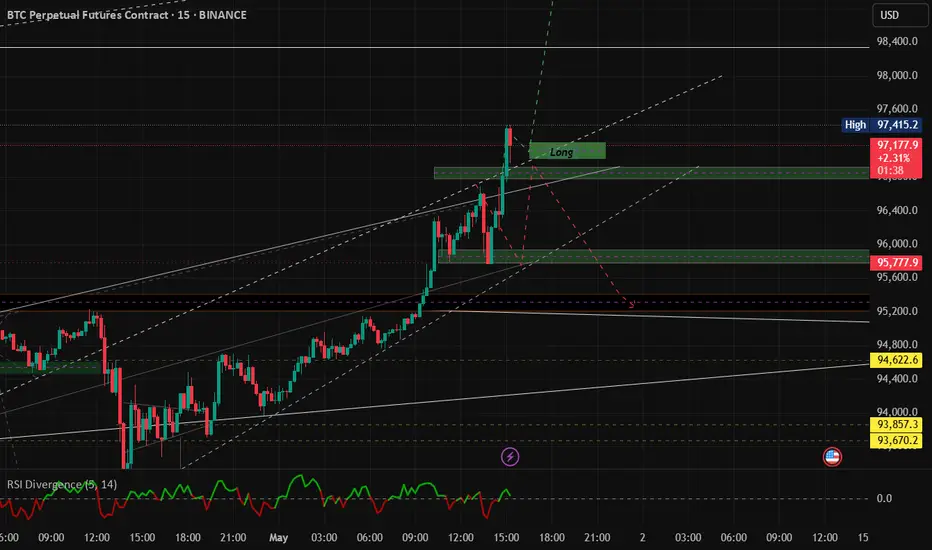
BITCOIN ON THE MOVE - BULLS IN CHARGE OR A TRAP AHEAD?Symbol - BTCUSD
CMP - 96000
BTCUSD has reached a new local high of 97900. The overall market structure remains constructive. However, its sustainability continues to be influenced by macroeconomic fundamentals and the performance of the S&P 500 index.
Recent gains have been supported by improvements in the US tariff landscape and the ongoing stabilization of US-China relations. Bitcoin's rally was further reinforced by the concurrent rise in the SPX 500, with which it maintains a relatively strong correlation. During the second half of this week, BTCUSD broke out of a two week consolidation phase, surpassing the resistance level at 95500 and establishing a new local high. A corrective movement is now developing within the confines of the existing upward channel.
The 95000 level represents a key liquidity and risk zone. If bullish momentum sustains above this threshold during a potential retest, the upward trend is likely to persist in the short to medium term. Conversely, a decisive break below 95000 may lead to a deeper decline toward the 92000–88000 range.
Resistance levels: 97425, 99475
Support levels: 95500, 92000
Market attention is focused on the 95500 support level, beneath which a significant liquidity pool has accumulated. Continued growth may result from a retest-induced rebound or a market imbalance favoring buyers. However, caution is warranted as upcoming economic data releases may significantly influence price action.
Important note: A return to the sell zone below 95000–95500, accompanied by an inability to sustain upward momentum, could lead to a broader correction and potential liquidation events.

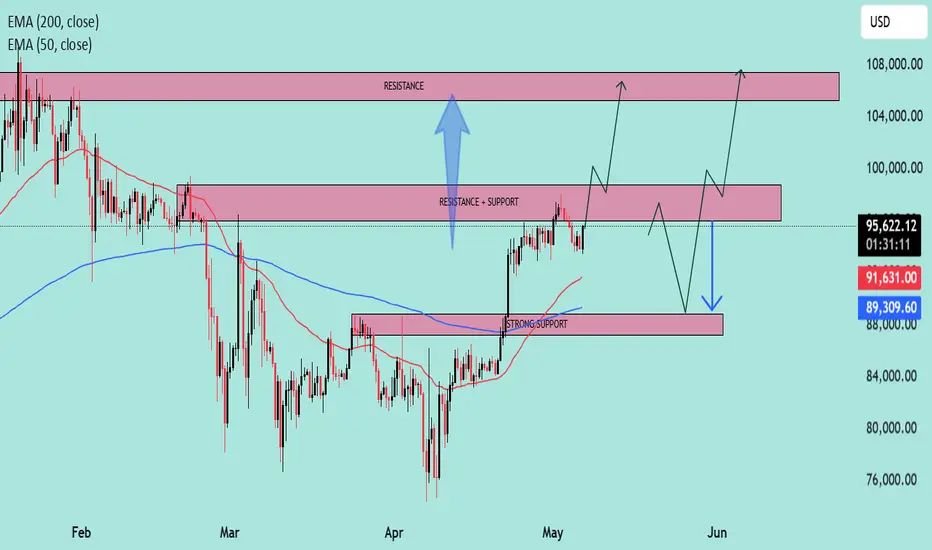
BTC at Key Inflection Zone – Breakout or Rejection Ahead?Asset: BTC/USD
Timeframe: 4H or Daily (based on visual pattern structure)
As of: May 6, 2025
Indicators:
50 EMA (Red): $91,615.79
200 EMA (Blue): $89,305.75
Key Technical Zones:
🔴 Resistance Zone: ~$104,000 – $108,000
This area has historically acted as a major supply zone.
Price has been rejected from this level multiple times, indicating strong selling pressure.
🔁 Flip Zone (Resistance turned Support/Support turned Resistance): ~$95,500 – $100,000
The current price ($95,234.23) is testing this zone from below.
A confirmed break and hold above could signal continuation toward the higher resistance.
🟢 Strong Support Zone: ~$88,000 – $91,000
Confluence of 50 EMA and 200 EMA adds strength to this demand zone.
Previous breakout level and accumulation area.
EMA Outlook:
50 EMA > 200 EMA: Short-term bullish crossover is active, indicating bullish momentum.
Both EMAs are sloping upward slightly, suggesting trend strengthening.
Price is currently above both EMAs, which acts as dynamic support.
Potential Scenarios:
✅ Bullish Scenario:
If price reclaims the $95,500–$100,000 resistance-turned-support zone:
Expect upward momentum to continue.
Target: $104,000–$108,000 zone.
Break of $108K could lead to a macro bull continuation.
⚠️ Bearish Scenario:
If price rejects the current zone and fails to hold above the $91,000 support:
Look for retest of $88,000–$89,000 area (confluence with EMAs).
Breakdown below that zone would invalidate bullish structure and signal potential deeper correction.
Summary:
Bias: Bullish above $91K, Neutral between FWB:88K –$91K, Bearish below $88K.
Key Confirmation Needed: Daily close above $100,000 for strong bullish continuation.
Risk Management: Watch for fakeouts within the $95K–$100K range due to past volatility.
Bitcoin Ready to Dump Again till $85000?CRYPTOCAP:BTC just tapped a key Short POI near resistance!
Bears stepping in hard below $99,550 — this is prime sniper zone.
▶️ Trade Setup (SMC x ICT):
▶️ Entry: $93,800–94,200
▶️ Targets: $90,000 → $86,000
▶️ Stop Loss: $99,600 (above structure)
Liquidity swept ✅
FVGs below ✅
Momentum shifting ✅

Bitcoin Breakout Above 95K – Next Target Locked at 110KBitcoin has successfully cleared the 95,000 milestone, which was our earlier target. After a retracement, it broke out of the consolidation range with strength, signaling buyers are firmly in control. The breakout zone around 92,000–95,000 now acts as solid support, and this structure shift favors a continued bullish leg.
The recent move also came with increasing momentum, showing fresh interest after a multi-week base. With no significant resistance until the 110K zone, the path remains open. A clean daily close above 97K will further strengthen the bullish drive.
As long as Bitcoin stays above the breakout box, this move is not done. The breakout structure is intact — let the market do the rest.
110K is on the radar.

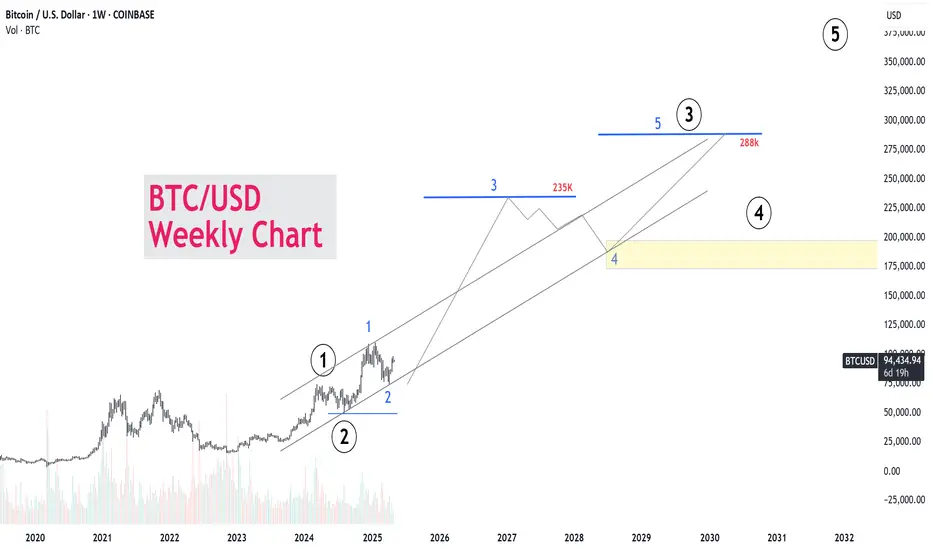
“Bitcoin Weekly Elliott Wave Analysis: Wave 3 Targeting $235K”📈 BTC/USD Weekly Elliott Wave Outlook
🗓️ Chart Published: May 5, 2025
💰 Current Price: $94,359
🚨 Wave 3 Has Begun — Long-Term Bullish Outlook
According to the Elliott Wave count on this weekly chart:
1️⃣ Wave 1 (2023–2024) is complete.
2️⃣ Wave 2 (a deep correction) successfully held support at the channel base.
3️⃣ Wave 3 is now unfolding and could reach between $235K and $288K — potentially a +215% rally from the current price.
4️⃣ Wave 4 correction expected in the $175K–$200K zone around 2029.
5️⃣ Wave 5 could take BTC beyond $300K+ in early 2030s.
📊 This is a macro impulse structure, where Wave 3 is historically the strongest. Price is trending well within the long-term ascending channel, giving confidence in a multi-year bull trend.
📍 Key Levels to Watch:
Wave 3 targets: $235,000–$288,000
Wave 4 correction zone: $175,000–$200,000
Final wave 5: To be projected post-Wave 4
📚 "Patience is profit." We're early in Wave 3 — the biggest opportunity for high R:R setups.
📎 #Bitcoin #ElliottWave #BTCUSD #CryptoForecast #TechnicalAnalysis #Wave3 #MacroTrend #BTCto250K #CryptoBullRun #TradingView #BTC2030
(BTC/USD) 1H Trade Setup – Key Entry, Stop Loss & Dual TargetEntry Point: 95,431
Stop Loss: 95,264
Target Points:
Upside (Target 1): 100,674 (Potential gain: +5.36%)
Downside (Target 2): 86,614 (Potential loss: -7.57%)
Trade Setup:
Risk-Reward Ratio:
Approx. 1:0.7 (Not ideal; the reward is smaller than the potential loss)
Support Zones:
Highlighted in purple beneath the entry zone — this indicates a historically strong support area.
Resistance Zones:
The upper purple zone marks the next significant resistance around 100,000–100,795.
Technical Indicators:
50 EMA (Blue Line): Indicates mid-term trend support, currently holding price action.
Price Action: BTC appears to be retracing toward support after a bullish rally.
Interpretation:
The setup implies a long (buy) position with a very tight stop loss.
The price is nearing a support zone, and if it holds, there's potential for an upward move to the target at 100,674.
However, if price breaks below 95,264, a sharp drop to 86,614 is anticipated.

BTC next 24 hours Important Zones are we heading to $100K Yes/NoHello Guys,
Follow up to our Morning Post, DELTAIN:BTCUSD.P responds exactly to the support base of 95000 Zone and
roaming around those.
What to expect now, if we cross the Supply Zone 1 mentioned in the chart, the next target is
It will test Supply Zone 2, till we are comfortably close above this and trade strongly, doors for Historic $100k will open after that level only, btw you know Target for Bitcoin was predicted by our 10x Bulls Team in year 2021.
An vice versa not holding the 95000 demand zones, will make this difficult for bulls.
Plan your trade with risk properly managed.
-10x Bulls
Courtesy: 10x Bulls (An educational helpdesk platform for investors and traders to find the best investment decisions, faculty trained by ex-fund managers, from Top Finance Institutions such as JP Morgan Chase and Goldman Sachs)

BTC SHORT 3/5/2025Price initially attempted to respect the order block, but failed to sustain bullish momentum or close above the previous high.
A bearish move followed, resulting in a break of the recent low—indicating a shift in market structure.
We then waited for a retracement back to a minor order block or fair value gap (FVG) for a potential entry.
A strong bearish engulfing candle confirmed selling pressure, providing a high-probability entry signal.
Entry was taken at this point, with targets set at previously identified liquidity levels below.
🔔 Like, follow, and comment for more market insights and trade breakdowns.

BTC 97800, Red Balloon Area, Buy Above this onlySince 24 hours after breakout of 95700 zone BTC is struggling to get more attraction and halted near 97800 for a time being where weekly chart is showing higher high candles but in daily chart last 24 hours red candle is obstructing the further uprally for time being, some shorts has been built near 97800, and fresh longs only once these liquidity is squeezed else will watch this BTC Ping Pong show, downside 95000 is crucial support bed, any breach of either zone will decide the fate for next week.
Happy Trading and Investing
~10x Bulls
Courtesy: 10x Bulls (An educational platform for investors and traders to find the best investment decisions, faculty trained by ex-fund managers, such as JP Morgan Chase and Goldman Sachs)
Classic Forecast:
COINBASE:BTCUSD
$15000 to $100000 in 2021 completed in 2024.

Power of boring candle In trading, a "boring candle" usually refers to a candlestick on a price chart that shows low volatility and small price movement during a given time period. It often has:
A small body (the open and close prices are very close).

BTC/USD 4H Chart Setup – Bullish Breakout Targeting $104K1. Trend Direction
⬆️ Uptrend Detected
* Price is forming higher highs and higher lows
* Trading inside a bullish channel
* Breakout potential above the top trendline.
2. Key Zones
🟦 Support Zone: $95,252.31
* Labeled as RBS + RBR ZONE
* Strong buy area → previous resistance turned support
* Perfect area to catch a bounce
📏 Support Line & Trendline
* Trendline keeps price supported along the climb
* Acts as a launch pad for the next move.
3. EMA 70 (📉 Red Line)
* Current value: $93,636.88
* Price is above EMA, showing strong bullish pressure
* EMA acts as dynamic support.
4. Trade Setup
🎯 Target Point: $104,000
🟦 Target Zone: $103,918.60 – $104,747.91
🔥 Entry Zone: $95,252.31 (marked blue box)
⚠️ Stop Loss: $94,091.28
* Positioned safely below support
* Good Risk/Reward Ratio.
5. Extra Cues
📅 Economic event icons near May 3–6 → Potential volatility ahead
⚡ Pullback in progress → May offer a buying opportunity.
Conclusion
🚀 Bullish Setup!
* Watch for a bounce from the blue demand zone
* Targeting $104K breakout
* Strong support + momentum = solid long opportunity.

Bitcoin Bybit chart analysis April 30Hello
It's a Bitcoinguide.
If you have a "follower"
You can receive comment notifications on real-time travel routes and major sections.
If my analysis is helpful,
Please would like one booster button at the bottom.
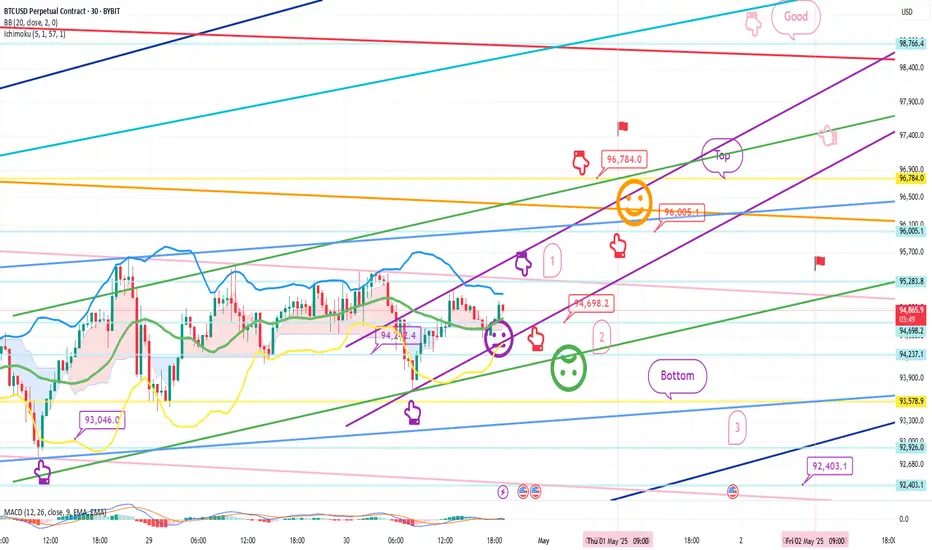
Here is the Bitcoin 30-minute chart.
There will be two Nasdaq indicator announcements at 9:30 and 11:00.
On the lower left, I marked the long position entry section that I entered on the 25th and 29th,
and created today's strategy based on the Nasdaq movement.
*Red finger movement path
Long position strategy
1. 94,698.2 dollar long position entry section / cut-off price when the green support line is broken
2. 95,784 dollar long position 1st target -> Good 2nd target
The 1st and 2nd sections at the top are sideways.
After the 1st touch, in the rising wave, if you enter a 94.6K long position,
the probability of the strategy succeeding increases.
If it comes down right away without touching the 1st section,
The final long position is waiting in the 2nd section, and the stop loss price is the same when the green support line is broken.
When the top section is touched, the long position re-entry utilization section and
I left a simulation with a pink finger on the upper right.
The bottom touch is a downward sideways movement
The 3rd section is the 6+12 support line where the mid-term pattern is restored.
Also, tomorrow is Labor Day,
So all countries around the world, including the US, are closed.
I also have work to do, so I will take a day off tomorrow.
I intentionally left the analysis article on the right until May 2nd.
Up to this point, please just refer to and use my analysis article,
And I hope you operate safely with the principle trading and stop loss price.
Thank you.
Bitcoin many times buy recommended near 82500 ,101k -105k TargetHow to take trades using Harmonic pattern projection Trade setup is explained below :-
Entry : 1st SL point : 0% is recent top or bottom.
Trailing D: 15.1% is work as trailing SL of buy or sell trade if hit then we have to book profit
.If price goes below 2nd D 22.5% to 24.5% range then early traders can make fresh reversals trade after breaking 1st D 15.1% safe traders can reversal trade after breaking Point D 22.5.4% to 24.5% range
Targets :
Target T1 : 36.1% to 38.3%
Target T3 : 49.1% to 52.5%
T3: 60.9% to 64.8% is our 3rd Target since this is reversal zone so must book profit if break then take fresh trade again
Target T4 : 76.4% to 79.7%
Next Targets are 100% , 127.2% ,141.4% and final Target 161.8%.
How to take reversal trade :
If price going upside/ downside then then buy or sell levels appear on Chart ( Automatically show when price reach any reversal zone of harmonic projection ).
Trailing SL:
After reach 1st Target trail SL to just above or below cost ( for example we are holding sell trade from 100 1st Target 110 hit then move trailing sl to 104-105 and move SL as price move upside or Downside)
Re- Entry :
For Re-entry in any pull back Point D ( 15.1% ) is used for re-entry then SL recent high or low Point SL ( 0% ) .
Blue Line is 1st support/ Resistance
Green line is 2nd support/ resistance
Red line is 3rd Support/ resistance

BTC Break or Broke Zone. Watch out How Price Reacts on the ZoneBYBIT:BTCUSD.P BINANCE:BTCUSDT
LONG Entry: 96950-96700 >> Look For
STOP LOSS: 96450:
Retracement toward this area and observe how the candle reacts at this zone.
If price shows pullback and wait for the candle to close in 15M TF.
If price didnt Bounce from the Entry Price area,Then its a confirmed Fake OUT .
If Confirmed,
SHORT : 96600
TP1:95800
TP2:95300
TP3:94700
Disclaimer: DYOR; This Technical Analysis should be used only for educational Purpose only.
Donot Take this as an Investment Advice.
"The Universe is Under No Obligation to Make Sense to You"
Market / forex Trading pair / Money / funding account Time fMarket / forex
Trading pair /
Money / funding account
Time frem / 30 minute
Logic /break out and session
Time
Day trade / only one trade
Lot size / 0.01
Stop loss (pips ) / $30
Target 🎯 (pips) $90
Risk & reward / 1 : 3
SL Trail / 1:2 $(60 pips )
Trade exit / no exit any other condition
Emotion / no emotion
Discipline / believe in your trade plan
Bitcoin Bybit chart analysis April 29Hello
It's a Bitcoinguide.
If you have a "follower"
You can receive comment notifications on real-time travel routes and major sections.
If my analysis is helpful,
Please would like one booster button at the bottom.
This is the Nasdaq 30-minute chart.
There will be an indicator announcement at 11 o'clock in a little while.
After the 4-hour chart MACD dead cross was imprinted yesterday
Today, two things are clear
*Red finger strong rise or purple finger major rebound.
The main issue was whether the 6-hour chart MACD dead cross occurred
After writing the analysis, looking at the overall movement
The purple finger seems strong today.
Let's apply it to Bitcoin as it is.
This is a 30-minute Bitcoin chart.
At the bottom left, I connected the long position entry point of $93,046 that I entered in the analysis article on the 25th.
Bitcoin and Tether dominance are moving sideways.
Bitcoin is slightly more advantageous in terms of MACD signals or Ichimoku Kinko Hyo,
but it is not strange if one side skyrockets or plummets.
While moving sideways, I was watching Nasdaq,
and I paid attention to the Nasdaq movement.
*Red finger movement path
One-way long position strategy
1. 94242.4 dollar long position entry section / green support line breakaway stop loss price
2. 96005.1 dollar long position 1st target -> Top 2nd target -> Final Good
The 1st section at the top is the rising wave position
If you touch it first, the possibility of success of the strategy increases.
If the strategy is successful, it would be good to use it as the final long position re-entry.
Depending on the adjustment coming out of Nasdaq, it can be pushed up to section 2
Roughly, it is the support line of the Bollinger Band 6-hour chart.
If the rebound fails in Nasdaq
Bottom -> Please note that it can be pushed to section 3.
Up to this point, please use my analysis as a simple reference and use.
Thank you.

BTC/USD) Short Setup: Triple Top Formation Targeting 86,023 USD You’re seeing a potential Head and Shoulders structure (or at least a triple top) — with the orange circles marking failure to break higher around $95K.
The neckline (support) is slightly diagonal down toward the $94K region.
A breakdown is anticipated once the neckline fails.
2. EMAs Interaction:
30 EMA (red) is currently flattening, showing weakening momentum.
200 EMA (blue) is far below, around 88,181 USD, acting as a major support zone — and it aligns with the projected EA TARGET POINT.
EMA compression usually precedes a strong move.
3. Zones and Key Price Levels:
Entry Point: ~95,145.60 USD → high-probability short sell.
Stop Loss: ~96,000–96,957 USD → protects against unexpected breakout.
Target: ~86,023 USD → aligns with past accumulation zone and EMA200.
4. Risk/Reward Ratio:
Potential reward is about 9–10%.
Risk (from entry to stop) is about 1–2%.
Excellent Risk/Reward (>4:1).
5. Momentum and Volume (implied, not shown):
Given the topping pattern and lack of higher highs, buying momentum is weakening.
If volume increases on a breakdown, confirmation will be strong.
📊 Strategic Points:
Aspect Analysis
Trend Still bullish, but topping signs visible
EMA Behavior Short-term EMA flattening, long-term EMA rising slowly
Pattern Formed Triple Top / Head and Shoulders
Risk/Reward Very good (>4:1)
Recommendation Short bias around entry level, with strict stop-loss
⚡ Quick Trading Plan:
Entry: Short at ~$95,145
Stop Loss: ~$96,000–96,957
Target: ~$86,023
