Bitcoin analysis 28-5-2025Bitcoin has broken below its consolidation range, indicating bearish momentum for the day. The price failed to hold above $86,500, turning the range into resistance, with the next major support at $84,970. If BTC hold below this breakdown level, further downside towards $85,000 or lower is possible. However, a retest of $86,500 before continuing downward remains a possibility. Day traders should watch for rejection near this level for short opportunities, while a reclaim above $86,500 could signal a false breakdown and potential recovery.
Trade ideas

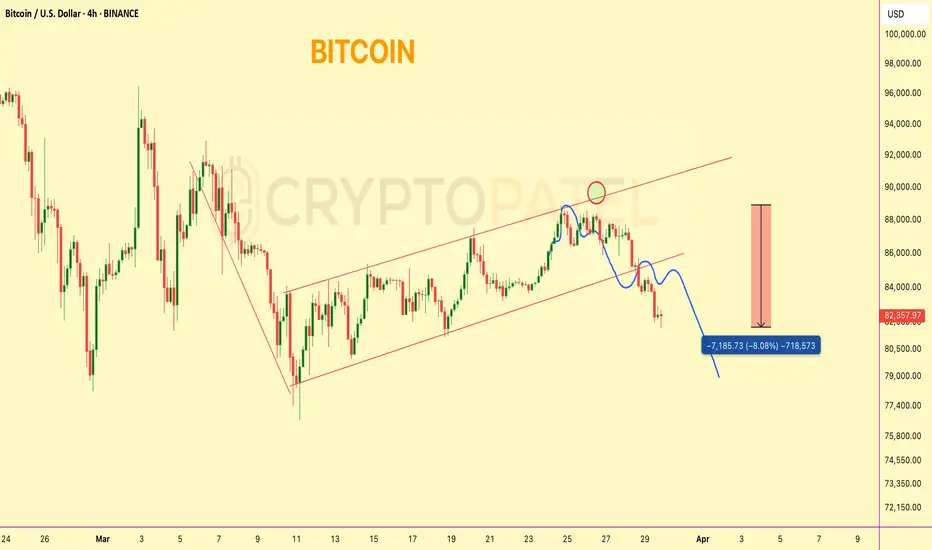
Bitcoin Dumped from our Entry levels and now 8% down#Bitcoin Bearish Flag Update
Price rejected perfectly from $89,000 resistance — our short setup played out with a solid -8% move.
Currently trading around key support at $82,000.
Trend Bias: Bearish below $85,700
Next major support: $75,000–$70,000 zone
Structure still favors further downside unless $85.7K is reclaimed.
Bitcoin sell recommended at 85900 booked at 82300 buy near 78500How to take trades using Harmonic pattern projection Trade setup is explained below :-
Entry : 1st SL point : 0% is recent top or bottom.
Trailing D: 11.4% is work as trailing SL of buy or sell trade if hit then we have to book profit
.If price goes below 2nd D 21.4% to 23.6% range then early traders can make fresh reversals trade after breaking 1st D 11.4% safe traders can reversal trade after breaking Point D 21.4% to 23.6% range
Targets :
Target T1 : 35.1% to 38.3%
Target T3 : 49.1% to 53.2%
T3: 60.9% to 64.8% is our 3rd Target since this is reversal zone so must book profit if break then take fresh trade again
Target T4 : 76.4% to 79.7%
Next Targets are 100% , 127.2% ,141.4% and final Target 161.8%.
How to take reversal trade :
If price going upside/ downside then then buy or sell levels appear on Chart ( Automatically show when price reach any reversal zone of harmonic projection pattern based .
After showing reversal levels wait for confirmation until 21.4% or 28.3 % level not break if break then exit from current buy / sell trade and take fresh reverse trade buy/ sell .
Trailing SL:
After reach 1st Target trail SL to just above or below cost ( for example we are holding sell trade from 100 1st Target 110 hit then move trailing sl to 104-105 and move SL as price move upside or Downside)
Re- Entry :
For Re-entry in any pull back Point D ( 11.4% ) is used for re-entry then SL recent high or low Point SL ( 0% ) .
Blue Line is 1st support/ Resistance
Green line is 2nd support/ resistance
Red line is 3rd Support/ resistance

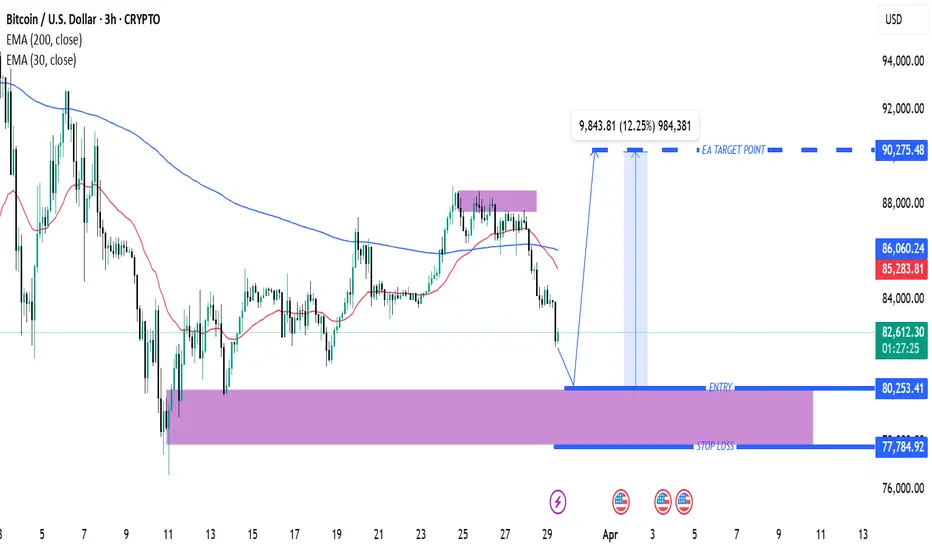
Bitcoin (BTC/USD) 3H Analysis: Key Support & Potential 12% UpsidSupport and Entry Zone (Purple Area at ~$80,253.41)
A significant support zone is marked in purple, indicating a potential area for entry.
This is an area where buying interest is expected.
Stop Loss (~$77,784.92)
A stop loss level is defined below the support zone, which is a risk management strategy.
Target Price (~$90,275.48)
The chart suggests a bullish move if the price bounces from the support.
The expected price increase is around 12.25% from the entry level.
Exponential Moving Averages (EMA)
30 EMA (Red Line, $85,290.12): Short-term trend indicator.
200 EMA (Blue Line, $86,061.21): Long-term trend indicator.
The price is currently below both EMAs, suggesting a bearish trend in the short term.
Market Outlook
The price has recently rejected resistance (purple zone above).
If it holds support at ~$80,253.41, a reversal to the upside is expected.
If the support breaks, further downside could follow.
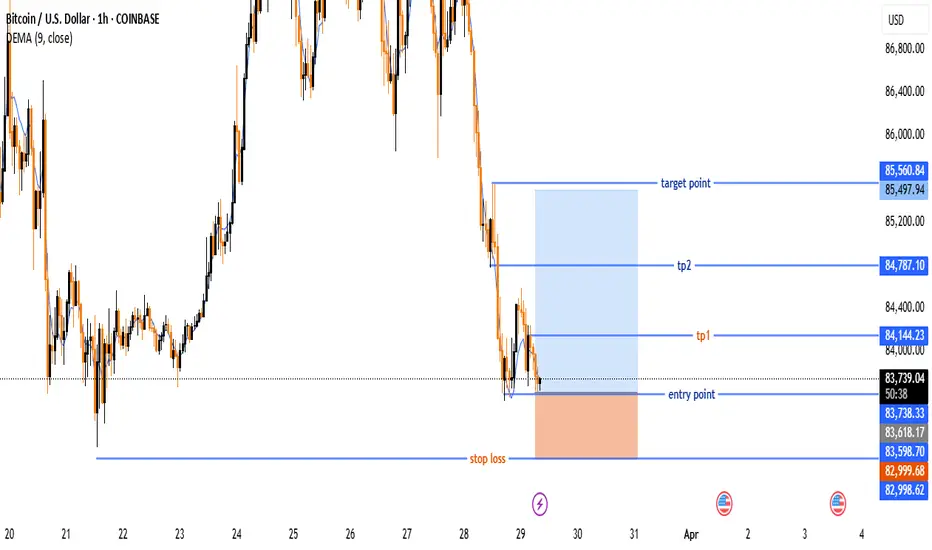
Bitcoin (BTC/USD) Trade Setup – Potential Reversal &Target Leves🔵 Entry Point:
🔹 Around $83,678.04 – The suggested buying zone.
🛑 Stop Loss:
🔻 $82,998.62 – The price level where the trade will be exited if it moves against the plan.
🎯 Target Points:
✅ TP1: $84,144.23 – First profit target.
✅ TP2: $84,787.10 – Second profit target.
🏆 Final Target: $85,560.84 – The ultimate goal for the trade.
📈 Technical Overview:
🔹 The price is at a support level, with a potential reversal to the upside.
🔹 Risk-Reward Ratio is favorable, with a clear uptrend target.
🔹 DEMA (9) at $83,776.52 indicates a possible trend shift.
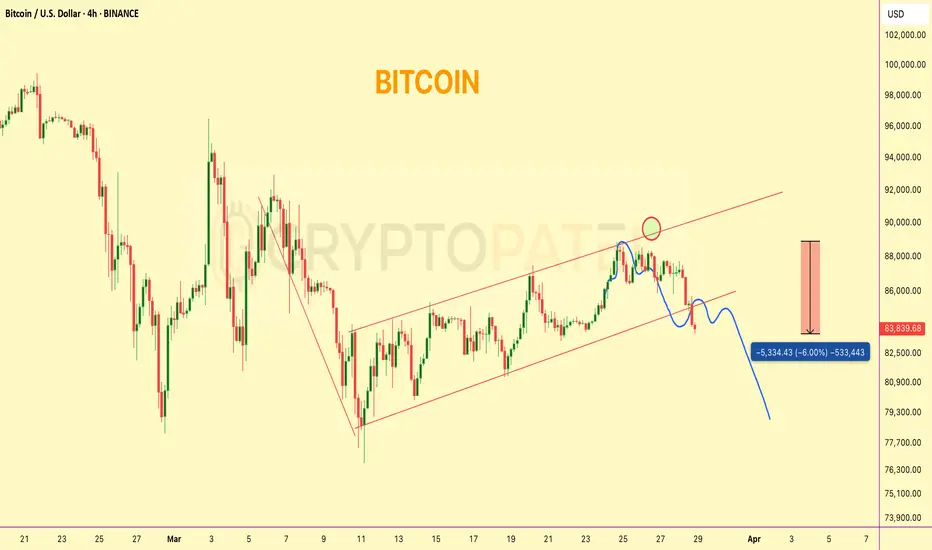
Bitcoin 6% dip form Rejection level✅ #Bitcoin respected our chart perfectly — rejected cleanly from our resistance zone.
🔻 Currently down ~6% from that level.
What’s next?
If CRYPTOCAP:BTC breaks and sustains above $85,650, we may see bullish continuation.
Else, expect further downside targets to unfold.
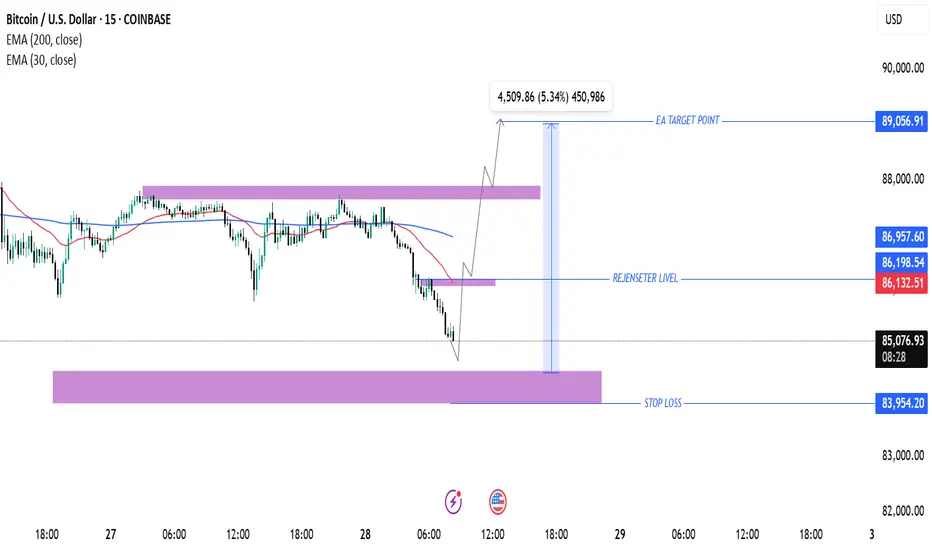
Bitcoin (BTC/USD) Trade Setup: Potential Reversal & Target Proje200 EMA (Blue): 86,960.21
30 EMA (Red): 86,149.39
The price is currently below both EMAs, indicating a short-term bearish trend.
Key Levels:
Stop Loss: 83,954.20 (marked in blue at the bottom)
Re-entry Level: 86,198.54 (near the 30 EMA)
Target Price: 89,056.91
Support & Resistance Zones:
Strong Support Zone: Around 83,954.20
Intermediate Resistance: Near 86,198.54
Major Resistance Zone: Close to 89,056.91
Trade Setup & Projection:
The chart suggests a potential reversal from the support zone.
The expected price movement shows a bounce from support, a breakthrough of the intermediate resistance, and a push toward the target price (89,056.91).
The expected gain is 4,509.86 points (5.34%).
Conclusion:
If BTC holds the support zone, an upside move is likely.
Breaking above 86,198.54 would confirm a bullish reversal.
Failing to hold support at 83,954.20 could lead to further downside.
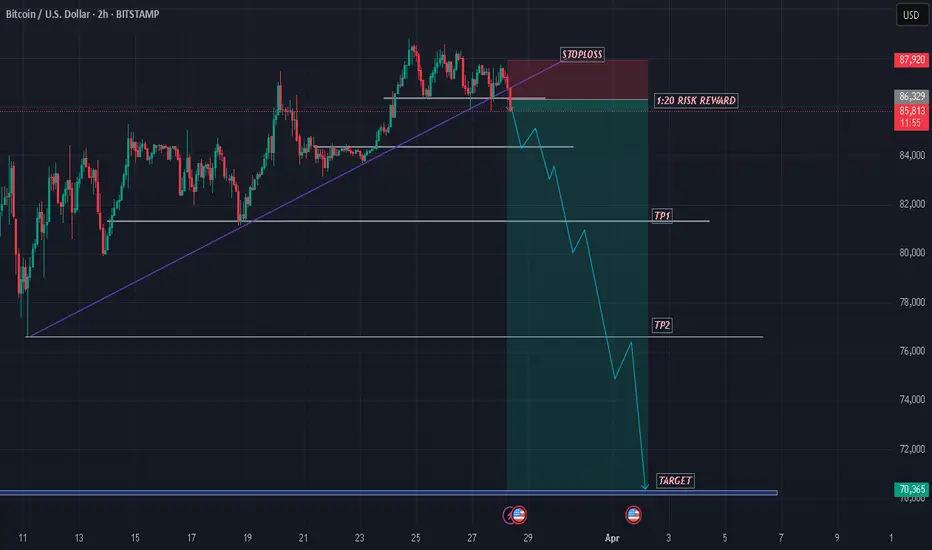
BTCUSD SHOWING A GOOD DOWN MOVE WITH 1:20 RISK REWARD BTCUSD SHOWING A GOOD DOWN MOVE WITH 1:20 RISK REWARD
DUE TO THESE REASON
A. its following a rectangle pattern that stocked the market
which preventing the market to move any one direction now it trying to break the strong resistant lable
B. after the break of this rectangle it will boost the market potential for break
C. also its resisting from a strong neckline the neckline also got weeker ald the price is ready to break in the outer region
all of these reason are indicating the same thing its ready for breakout BREAKOUT trading are follws good risk reward
please dont use more than one percentage of your capitalfollow risk reward and tradeing rules
that will help you to to become a bettertrader
thank you
BTCUSD: Bull OR Bear? 28-MAR-2025BTCUSD: Bull OR Bear? 28-MAR-2025
Primary: Bear
As long as 110,000 resists, we can see deep correction towards 43K-32K.
From where we can see strong bull move towards 240K USD.
Downside targets: 83600,76600, 73500, 68100, 42500, 32300, 23500.
Alt: Bull
If 76600 is the low, we can see bull move towards 119K and further 140K.
Upside targets: 92900, 96500, 105,000
Extensions: 119K, 139K, 155K, 200K, 220K
Alt 2:
Can make new high towards 119K and fall to 83K before next up move towards 200K.

Bitcoin buy near support sell near resistance both side move How to take trades using Harmonic pattern projection Trade setup is explained below :-
Entry : 1st SL point : 0% is recent top or bottom.
Trailing D: 11.4% is work as trailing SL of buy or sell trade if hit then we have to book profit
.If price goes below 2nd D 21.4% to 23.6% range then early traders can make fresh reversals trade after breaking 1st D 11.4% safe traders can reversal trade after breaking Point D 21.4% to 23.6% range
Targets :
Target T1 : 35.1% to 38.3%
Target T3 : 49.1% to 53.2%
T3: 60.9% to 64.8% is our 3rd Target since this is reversal zone so must book profit if break then take fresh trade again
Target T4 : 76.4% to 79.7%
Next Targets are 100% , 127.2% ,141.4% and final Target 161.8%.
How to take reversal trade :
If price going upside/ downside then then buy or sell levels appear on Chart ( Automatically show when price reach any reversal zone of harmonic projection pattern based .
After showing reversal levels wait for confirmation until 21.4% or 28.3 % level not break if break then exit from current buy / sell trade and take fresh reverse trade buy/ sell .
Trailing SL:
After reach 1st Target trail SL to just above or below cost ( for example we are holding sell trade from 100 1st Target 110 hit then move trailing sl to 104-105 and move SL as price move upside or Downside)
Re- Entry :
For Re-entry in any pull back Point D ( 11.4% ) is used for re-entry then SL recent high or low Point SL ( 0% ) .
Blue Line is 1st support/ Resistance
Green line is 2nd support/ resistance
Red line is 3rd Support/ resistance

Bitcoin Bybit chart analysis March 26Hello
It's a Bitcoinguide.
If you have a "follower"
You can receive comment notifications on real-time travel routes and major sections.
If my analysis is helpful,
Please would like one booster button at the bottom.
This is a 30-minute Bitcoin chart.
There is no Nasdaq indicator announcement today.
With the purple finger on the left,
I connected the long->short switching section in the existing strategy.
4-hour chart MACD dead cross imprint released.
The short-term pattern is broken and Nasdaq is moving sideways.
*Long position strategy when the red finger moves.
1. 87,141.5 dollars long position entry section / cut-off price when the green support line is broken
2. 89,177.2 dollars long position 1st target -> Top 2nd target
For those who are maintaining a short position,
Check if it breaks through the pink resistance line
The 1st section at the top and the 2nd section at the bottom are sideways sections. In particular, the first section at the top is the resistance line section of the Bollinger Band daily chart, and since it is pressed, adjustments can occur when touched.
Therefore, even if a rebound occurs at the red finger 87.1K,
if the daily candle is created tomorrow,
it should touch the first section 89.1K at the top to open the resistance line,
so that it can safely rise to the top section, right?
Since the mid-term pattern is broken from the green support line deviation,
it must unconditionally succeed in the rebound,
and it would be good to operate while watching the Nasdaq movement.
Up to this point, I ask that you simply refer to and use my analysis,
and I hope that you operate safely with principle trading and stop loss prices.
Thank you.

Bitcoin daily anaysis 27-3-2025BTC/USD already retraced to $85,000 before bouncing back to the current level of $87,667. This indicates that buyers stepped in at lower levels, defending the support zone. The price is now consolidating within a highlighted resistance zone, suggesting a potential breakout or rejection. If bulls push above this range with strong momentum, BTC could aim for $90,000+. However, failure to break out may result in another dip, possibly testing support levels again.We should watch for volume confirmation and price action near this zone for the next move.

Bitcoin (BTC/USD) 4H Chart Analysis: Bullish Breakout Ahead?📈 Ascending Channel:
🔹 The price is moving upward within a parallel trend channel.
🔹 Blue arrows (🔵) indicate resistance points where the price struggled.
🔹 Red circles (🔴) highlight support areas where the price bounced.
🟦 Fair Value Gap (FVG) Zone:
🔸 The blue-shaded area (FVG zone) suggests a possible retracement before a bullish move.
🔸 If the price dips into this zone, it may find liquidity and bounce back up.
📊 Projected Price Movement:
⚡ Expected pullback → into FVG zone (🔽), then a bullish push (🚀) towards $90,686.72 🎯.
🟡 Yellow arrow shows the anticipated price path.
📉 Support & Resistance Levels:
✅ Support: Around $86,000 - $86,500 (FVG zone).
🚀 Target: $90,686.72 (next major resistance).
📌 Exponential Moving Average (DEMA - 9):
🔹 The blue line (DEMA 9) at $87,414.57 is acting as dynamic resistance.
🔹 A break above this could confirm further upside movement.
💡 Conclusion:
🔸 Bullish bias remains strong 📈.
🔸 Watch for a dip into the FVG zone before a potential rally 🚀.
🔸 If Bitcoin holds support, it may reach $90K+ soon 🎯🔥.

Sell the rallyBTC CMP 87300
The confluence at 89200 is a strong resistance. The crypto has been unable to cross that zone for two days now. With a falling trendline at the same zone. In my view it is a sell now. Ur stops have to be above 89200.

Bitcoin analysis 26-3-2025 Consolidation phase ?Bitcoin (BTC/USD) is currently consolidating within a key demand zone between $87,100 and $87,350, with multiple wicks indicating strong buying interest at this level. The price action suggests a range-bound movement, with resistance near $87,500 and major support around $84,970. If buyers hold this zone, BTC could see an upward move toward $88,000 or higher, while a breakdown below $87,100 may trigger a decline toward $85,000. The consolidation phase suggests accumulation, and a breakout in either direction will determine the next significant move. we should watch for a decisive close above resistance or below support for confirmation.

Bitcoin upside Target 92500-94000 continuesly buying from 81500How to take trades using Harmonic pattern projection Trade setup is explained below :-
Entry : 1st SL point : 0% is recent top or bottom.
Trailing D: 11.4% is work as trailing SL of buy or sell trade if hit then we have to book profit
.If price goes below 2nd D 21.4% to 23.6% range then early traders can make fresh reversals trade after breaking 1st D 11.4% safe traders can reversal trade after breaking Point D 21.4% to 23.6% range
Targets :
Target T1 : 35.1% to 38.3%
Target T3 : 49.1% to 53.2%
T3: 60.9% to 64.8% is our 3rd Target since this is reversal zone so must book profit if break then take fresh trade again
Target T4 : 76.4% to 79.7%
Next Targets are 100% , 127.2% ,141.4% and final Target 161.8%.
How to take reversal trade :
If price going upside/ downside then then buy or sell levels appear on Chart ( Automatically show when price reach any reversal zone of harmonic projection pattern based .
After showing reversal levels wait for confirmation until 21.4% or 28.3 % level not break if break then exit from current buy / sell trade and take fresh reverse trade buy/ sell .
Trailing SL:
After reach 1st Target trail SL to just above or below cost ( for example we are holding sell trade from 100 1st Target 110 hit then move trailing sl to 104-105 and move SL as price move upside or Downside)
Re- Entry :
For Re-entry in any pull back Point D ( 11.4% ) is used for re-entry then SL recent high or low Point SL ( 0% ) .
Blue Line is 1st support/ Resistance
Green line is 2nd support/ resistance
Red line is 3rd Support/ resistance

Bitcoin Bybit chart analysis March 24Hello
It's a Bitcoinguide.
If you have a "follower"
You can receive comment notifications on real-time travel routes and major sections.
If my analysis is helpful,
Please would like one booster button at the bottom.
This is the Nasdaq 30-minute chart.
There is an indicator announcement at 10:35,
The Bollinger Band 12-hour chart is touching the resistance line,
But it has not reached the center line of the daily chart.
A gap section is created at the bottom.
The blue finger is a short->long switching strategy,
And I just applied it to Bitcoin.
Bitcoin 30-minute chart.
*Red finger movement path
Long position strategy
1. $86,837.7 long position entry section / stop loss price when purple support line is broken
2. $90,418 long position 1st target -> Good 2nd target
The 1st section at the top
is the rising wave section for today's strategy to succeed
(Section for utilizing autonomous short section)
From the 1st section touch
The probability of the strategy succeeding increases.
Refer to Nasdaq movement.
The 2nd section at the bottom seems to be around 1+4 sections
The mid-term pattern is broken from the bottom touch.
After that, the possibility of the bottom gap reversal increases, so please note
Today, since it's been a while, I'll leave it as public
and go in.
Up to this point, I ask that you use my analysis as a reference only
I hope that you operate safely with principle trading and stop loss prices.
Thank you.

Bitcoin (BTC/USD) 2H Analysis: Potential Bullish Continuation or30 EMA (Red, 86,440): Indicates short-term momentum.
200 EMA (Blue, 85,153): Represents long-term trend support.
Support and Resistance Zones
Support Zone (Purple Box - ~86,271 to 85,153): Price is likely to bounce from here.
Resistance Zone (~87,149 and above): Breakout above this could push price higher.
Trade Setup
Entry Consideration: The price is currently testing a demand zone (purple) after a pullback.
Target (Take Profit - 90,118): Expecting a bullish move.
Stop Loss (~86,658 or lower): To manage risk.
Potential Price Action
If Bitcoin holds above the purple demand zone and 30 EMA, it could rally to 90,118.
A breakdown below 86,271 could push it toward 84,366 or lower.
Conclusion
Bullish Bias: If price holds above the support level.
Bearish Risk: If it breaks below the purple zone.
Recommendation: Monitor support at 86,271 and 85,153, as a bounce from these areas could confirm an uptrend.

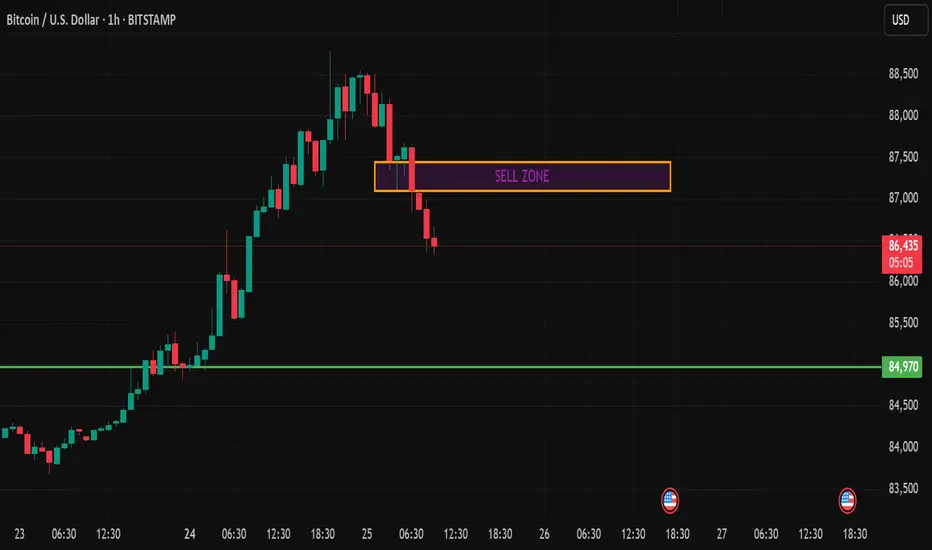
Bitcoin analysis 25-3-2025 Bearish bias !! Bitcoin faced rejection from the 86,500 - 86,700 sell zone, triggering a sharp intraday drop. For day trades, the immediate target is 84,970, with a potential extension to 84,500 if selling pressure continues. Any pullbacks into the sell zone could provide fresh shorting opportunities, while a breakout above 86,700 would invalidate the bearish bias for the day.
Bitcoin (BTC/USD) Bullish Momentum: Key Levels and Trade Setupuddy'S dear friend 👋 SMC Trading Signals Update 🗾 🗺️
Technical Analysis:
Timeframe: 4-hour chart
Current Price: $88,244
Trend: Uptrend within an ascending channel
Supply Resistance Zone: $92,721 (Potential reversal area)
Fair Value Gap (FVG) Support Zone: $87,200 - $87,600
200 MA Resistance: Price is approaching the 200 Moving Average, which could act as resistance.
Key Levels:
1. Support:
FVG Zone (~$87,200 - $87,600) – Potential buy zone
Major Support: $86,649
2. Resistance:
$92,721 (Supply Zone) – Key target level
$90,000 Psychological Resistance
3. RSI Indicator:
Currently at 76.37, indicating overbought conditions.
A potential pullback could occur before further upside.
Mr SMC Trading point
Risk Management Strategy:
Long Entry: Near FVG Zone (~$87,200 - $87,600) if price retraces.
Stop Loss: Below $86,649 to limit downside risk.
Take Profit: Around $92,721 for a risk-reward trade.
Market Outlook:
Bitcoin remains bullish, but the RSI suggests a possible pullback before continuation.
A retracement into the FVG Zone may provide a better buying opportunity before the next leg up.
If price breaks below the FVG zone, the uptrend could weaken.
Pales support boost 🚀 analysis follow)

Breaking: $BTC reclaims $87,000, What Next?🚨 Breaking: CRYPTOCAP:BTC reclaims $87,000 🚀
POI: $88,000–$90,000
This zone is crucial — it will decide Bitcoin's next major move.
Watch closely:
✅ Hold above $90K = bullish continuation
❌ Rejection from POI = possible pullback
#Bitcoin #BTC

Bitcoin again buy near support 85900 , 92600 to 94000 Target How to take trades using Harmonic pattern projection Trade setup is explained below :-
Entry : 1st SL point : 0% is recent top or bottom.
Trailing D: 11.4% is work as trailing SL of buy or sell trade if hit then we have to book profit
.If price goes below 2nd D 21.4% to 23.6% range then early traders can make fresh reversals trade after breaking 1st D 11.4% safe traders can reversal trade after breaking Point D 21.4% to 23.6% range
Targets :
Target T1 : 35.1% to 38.3%
Target T3 : 49.1% to 53.2%
T3: 60.9% to 64.8% is our 3rd Target since this is reversal zone so must book profit if break then take fresh trade again
Target T4 : 76.4% to 79.7%
Next Targets are 100% , 127.2% ,141.4% and final Target 161.8%.
How to take reversal trade :
If price going upside/ downside then then buy or sell levels appear on Chart ( Automatically show when price reach any reversal zone of harmonic projection pattern based .
After showing reversal levels wait for confirmation until 21.4% or 28.3 % level not break if break then exit from current buy / sell trade and take fresh reverse trade buy/ sell .
Trailing SL:
After reach 1st Target trail SL to just above or below cost ( for example we are holding sell trade from 100 1st Target 110 hit then move trailing sl to 104-105 and move SL as price move upside or Downside)
Re- Entry :
For Re-entry in any pull back Point D ( 11.4% ) is used for re-entry then SL recent high or low Point SL ( 0% ) .
Blue Line is 1st support/ Resistance
Green line is 2nd support/ resistance
Red line is 3rd Support/ resistance

BTC LongInstrument: Bitcoin Perpetual Futures (BTCUSD.P)
Timeframe: 15-Minute Chart
1. Breakout Analysis
The chart shows a clear breakout above a horizontal resistance zone (highlighted in yellow). The breakout candle is large and bullish with increased volume, confirming strength in the move. A potential bullish continuation is indicated by the breakout, suggesting higher targets.
2. Volume Analysis
Noticeable spike in volume during the breakout, which strengthens the validity of the move. High volume confirms that buyers are stepping in and supporting the price action. Sustained volume post-breakout would indicate a higher probability of continuation.
3. RSI (Relative Strength Index) Analysis
RSI is at 70.81, which places it near the overbought zone (>70). However, the RSI has crossed above 70 with strong momentum, which often signals strength rather than an immediate reversal. RSI can stay elevated in strong uptrends, so overbought alone isn’t necessarily a reversal signal.
4. EMA Analysis
The chart includes the 10 EMA (red) and 20 EMA (green):
10 EMA > 20 EMA ➔ Bullish signal.
Price is trading above both EMAs, confirming strong upward momentum.
The EMAs are sloping upward, showing a trending market.
✅ Entry and Exit Strategy
📌 Entry:
Ideal entry = Retest of the breakout zone (~$88,000) OR next bullish candle closing above the breakout level.
Confirmation = Price holding above the breakout zone with consistent volume.
🎯 Targets:
First target = $88,800 (near-term resistance).
Second target = $89,700 (next resistance based on historical price action).
🚨 Stop Loss:
Place stop loss below the breakout zone (~$87,500) OR below the 20 EMA if volatility increases.
🔁 Exit:
Partial exit at first target to secure profits.
Trail the stop-loss using the 10 EMA once the price moves in favor.
Exit completely if the price closes below the 20 EMA with high volume.
⚠️ Educational Disclaimer
This analysis is for educational purposes only and does not constitute financial advice. Trading involves substantial risk, and past performance is not indicative of future results. Please conduct your own research and consult with a financial advisor before making any trading decisions.
