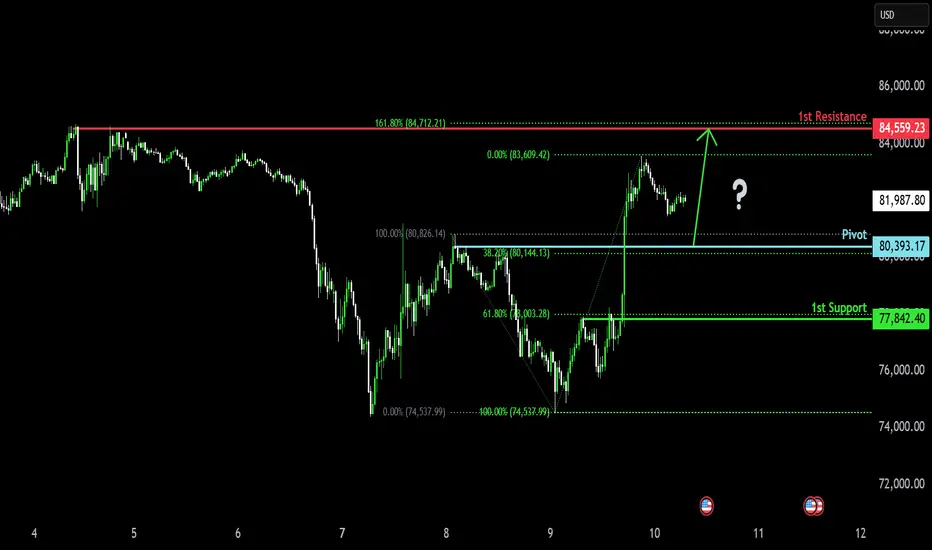
Could the Bitcoin bounce from here?The price is falling towards the pivot which acts as a pullback support that lines up with the 38.2% Fibonacci retracement and could bounce to the 1st resistance.
Pivot: 80,393.27
1st Support: 77,842,40
1st Resistance: 84,559.23
Trade ideas
BTCUSD SHORT ANALYSIS Hello traders I hope you have made good bucks from this volatility, this trade analysis is advance trade analysis(not active yet) as you can see BTCUSD shows some good upside after the news of tarrif pause from US, and reach at the previous resistance zone our trade will be active if it closes below 81200 in 15min tf with almost more than 1:3 RR with sl of 82300 and tp of 77000-78000 range. Don't forget to trail your sl once you get 1:1 profit and book part quantity and trail rest at buying price so our trade becomes risk free. If BTCUSD don't close below mentioned lvl our trade won't be active.and one more thing 82300 sl is for safe traders for risky traders SL will be 83553.
This is my personal view, I reserve the right to be wrong. Please do your own research before taking any trades.

Bitcoin (BTC/USD) Technical Analysis – Bullish Setup🔵 Key Levels:
🎯 Target Point: 87,050.22 (🔼 Expected upward move)
🔵 Support Zone: 79,833.82 (🛡️ Strong demand area)
🔴 Current Price: 82,254.27
📊 Analysis:
🔵 RBS + RBR Zone (🔄 Role Reversal Support & Rally Base Rally) - Possible entry point for a long position.
🟠 Stop Loss: Below 79,833.82 (🚨 Risk Management)
🟣 Resistance Zone: Near 83,000 (🔄 Possible short-term pullback)
📈 Strategy:
1️⃣ Price might retrace to the blue zone (support) before continuing upward.
2️⃣ If it holds, 🚀 potential rally towards 87,050.22 🎯
3️⃣ If it breaks below support, ⚠️ possible downside risk.
✅ Conclusion:
A bullish setup with a 7.45% profit target 📊
Risk managed with a stop loss below support ⚠️

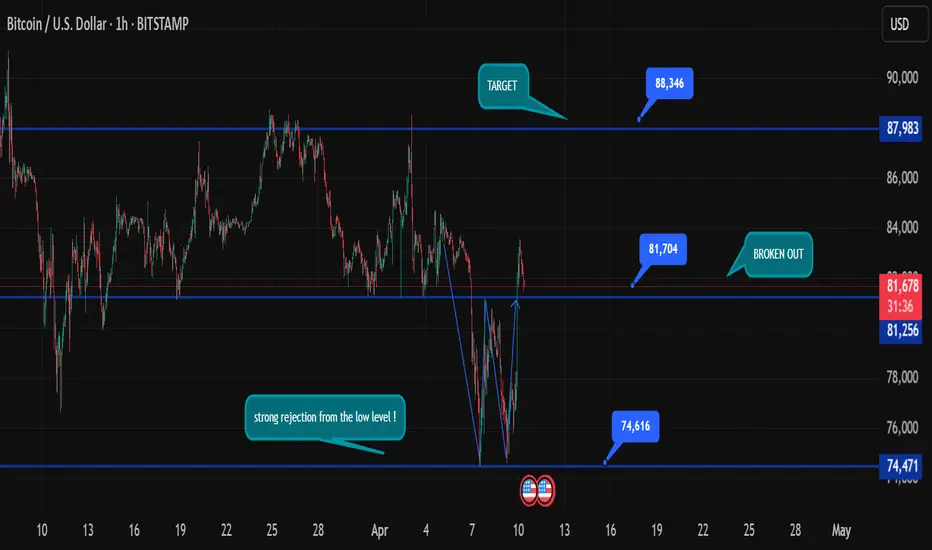
Bitcoin Daily Analysis – April 10, 2025Bitcoin (BTC/USD) has staged a powerful rebound from the crucial support zone near 74,471, signaling strong buyer interest at lower levels. The sharp rejection from 74,616 created a classic V-shaped recovery, suggesting aggressive demand stepped in after a steep correction. The price has now broken out above the key resistance of 81,256, turning it into a potential support level.
This breakout has been sustained with a clean candle close above the 81,704 zone, reinforcing the bullish momentum. The structure shows a potential inverse head and shoulders pattern on the hourly chart, which further strengthens the bullish case.
Key levels to watch:
Immediate support: 81,256 – Holding above this confirms bullish continuation.
Next resistance/target: 87,983 (minor), with a major upside target at 88,346.
Strong demand zone: 74,471 – 74,616
Volume has also picked up during the breakout, adding confirmation to the move. If bulls manage to maintain control above 81,700, we could see an extended rally in the coming sessions. However, a failure to hold above 81,256 could lead to a retest of the 78K–79K zone.
Bias remains bullish, with every dip above 81,000 viewed as a buying opportunity until structure is invalidated.
BTC/USD Bullish Breakout Setup – Targeting $85,477 with 5.62% UpThe price has recently surged above both the 30 EMA (red) and 200 EMA (blue), signaling a strong bullish move.
The EMAs are beginning to turn upward, particularly the 30 EMA, suggesting short-term bullish momentum.
Key Levels Identified
Entry Zone (Purple Support Zone):
Around $80,105 – a potential buy zone after a pullback.
Labeled with STOP LOSS, indicating the invalidation level if price drops below this zone.
Target Zone (Purple Resistance Zone):
Around $85,477 – this is the target level, marked as “EA TARGET POINT”.
Offers a potential move of +5.62% or 4,551.83 points.
Price Action
Price broke above a previous resistance (now support) and has pulled back slightly.
The projected move suggests a bullish continuation after a minor pullback and consolidation.
Risk-Reward
Good risk-reward ratio implied with the large gap between the stop loss and target.
Stop loss is tight, just below the purple support zone (~$80,105).
Projection
The blue lines and annotations suggest a bullish play, with an expected upward movement after retesting the support.
✅ Possible Trade Idea
Buy Zone: ~$80,105 (on a confirmed retest)
Stop Loss: Slightly below $80,105
Target: ~$85,477
Expected Move: +5.62%
🔍 Additional Notes
Keep an eye on price behavior around the support zone—confirmation (e.g., bullish candle pattern or rejection wick) strengthens the entry.
The strong move leading to the breakout suggests high momentum, which could mean limited pullback.
News or macro developments could invalidate technicals—be aware of external factors.

How to Trade Using Automatic Fibonacci Zones!What is AutoFibGauge? How to Trade Using Automatic Fibonacci Zones! 🎯
⸻
Manually drawing Fibonacci retracements can be confusing and time-consuming.
That’s why I use AutoFibGauge, a custom tool that automatically detects swing highs and lows and plots key Fibonacci levels for you.
It makes my trading faster, more accurate, and helps avoid emotional errors.
⸻
What is Fibonacci Retracement?
Fibonacci retracement is based on the idea that markets tend to retrace a predictable portion of a move before continuing in the original direction.
The most important Fibonacci levels are:
• 23.6% – Minor pullback
• 38.2% – Healthy correction
• 50.0% – Psychological midpoint
• 61.8% – Golden zone (high probability bounce/reversal area)
• 78.6% – Deep correction zone
Traders use these levels to spot potential support and resistance zones.
⸻
What AutoFibGauge Does:
• Automatically finds recent swing points
• Plots Fibonacci retracement levels instantly
• Highlights important reaction zones like 38.2%, 50%, 61.8%
• Updates dynamically as the market evolves
⸻
How I Use It:
1. Identify if price is reacting to key Fib levels (like 0.382 or 0.618)
2. Combine with trend confirmation (like QMA or Parabolic SAR)
3. Plan entries, exits, and stop-loss around these Fib zones
This saves time and removes the guesswork!
⸻
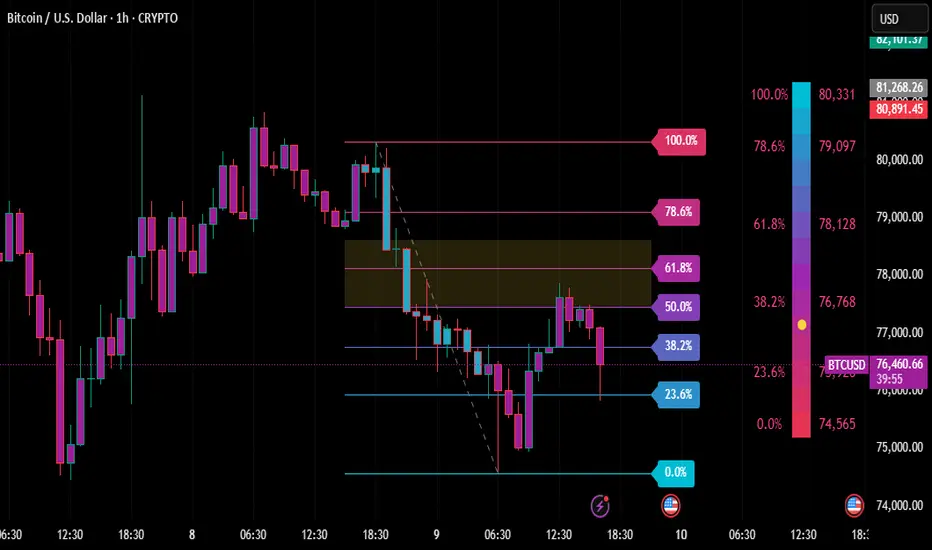
Real Example (BTC/USD 1H Chart):
• After a strong fall, AutoFibGauge plotted the Fibonacci zones automatically.
• Price reacted perfectly near the 61.8% and 78.6% retracement areas.
• These zones act as high-probability reversal or continuation areas.
⸻
I’m using the AutoFibGauge indicator (available free under TechnoBlooms on TradingView).
If you’d like the direct link or help setting it up, feel free to comment below or DM me!
⸻
Tap LIKE ❤ & FOLLOW ➕ if you found this helpful! More trading tools and strategy tips coming soon!
⸻
#BTCUSD #Bitcoin #AutoFibGauge #FibonacciTrading #TechnicalAnalysis #PriceAction #TradingTools #LearnTrading #CryptoTrading #ForexStrategy
Bitcoin is preparing for falling (08.04.2025)Please go through chart information carefully.
There are many reasons behind the bears who is gathering strength.
price breaks major trendline,
price rejecting from resistance zone many times,
Price breaks the support level.
Advice-
Our preference is as below:
BTCUSD sell NOW @78500
TP1-77000
TP2-75000
TP3-70000
SL- As suggest in the chart

Trade Idea: SELL BTCUSD at 78,200 – 78,500🧠 Technical Analysis (1H Chart):
Key Resistance Zone: 78,200 – 78,500 USD
Price has consistently failed to break above this area.
Multiple rejections from this zone suggest a strong supply zone.
This area aligns with historical resistance + EMA confluence.
Trend Structure:
Price formed a lower high and shows signs of a short-term bearish reversal.
Breakdown from minor support at 77,800 confirms weak momentum.
Current price action shows hesitation with reduced buying volume.
Volume Analysis:
Large red volume bars signal strong seller presence near resistance.
Weak green candles near resistance imply exhausted buying interest.
🎯 Trade Setup:
Entry Zone: SELL from 78,200 – 78,500 USD
Stop Loss: Above 79,600 USD (just beyond strong resistance zone)
Take Profit:
TP1: 70,000 USD – major support & volume node
TP2: 68,000 USD – high probability support zone from recent base
📊 Risk-to-Reward (R:R): Approximately 1:3 to 1:4 – ideal for swing or short-term positional trades.
🚀 Follow me for more high-probability trading opportunities! 🚀

BTC/USD 1H Chart Analysis – Bearish Setup with SBR Rejection🔵 Key Zones & Levels:
🔷 SBR Zone (Support ➡ Resistance):
Price Range: ~$81,000–$83,000
🛑 Stop Loss: $83,002.31 (Just above resistance)
Expecting sellers to step in here if price retests this level
🟠 Mid-Range Zone:
Current price is consolidating just below SBR zone
Could form a lower high before dropping
🟦 Target Zone (Support Area):
🎯 Target Price: ~$75,000
Previous demand area – price bounced hard from here before
🔁 Trade Plan:
📉 Bias: Bearish
📍 Entry: Near current price or after retest of SBR zone
🛑 Stop Loss: $83,002.31
🎯 Target: $75,000 (approx -8.33%)
✅ Summary:
Risk-Reward: Appears solid (R:R > 2:1)
🕵️♂️ Watch for: Fakeouts or rejections in the SBR zone
🔻 Potential Move: -6,804 points if plan plays out

#BTCUSD – Death Cross Loading.. stay alert !! Bitcoin is inching closer to a death cross on the daily chart, and the signs are crystal clear:
🔻 Price Action:
Consistent lower highs and lower lows since mid-Feb.
Recent breakdown from the EMA cluster confirms bearish dominance.
📉 Moving Averages Breakdown:
🔴 9 EMA: Way below price – momentum dead.
⚪ 50 EMA: Sloping down aggressively.
🟡 200 EMA: Flattening, ready to be taken out.
The 50 EMA is now converging toward the 200 EMA → death cross imminent.
🎯 Key Levels:
Support: $74,000 – break this, and we slide fast.
Resistance: $78K– GETTEX:82K – the EMA graveyard.
🧨 Once the death cross confirms, long-term sentiment flips fully bearish.
Bulls need to act NOW, or we’re staring at $70K or lower.
Just charts.
Stay sharp. 💀📉

Bitcoin waiting for 420000🔮 Bitcoin Waiting for ₹4,20,000: A Mystical Insight by Najoomi Ji 🔮
In the cosmic dance of the stars and planets, every rise and fall in our material world is mirrored in the heavens above. As an astrologer and spiritual guide, I, Najoomi Ji, have always maintained that cryptocurrencies, especially Bitcoin, follow not only market trends but also planetary vibrations.
As per my latest analysis using Lal Kitab principles, Vedic astrology, and true sidereal planetary positioning, Bitcoin is under the influence of Shani (Saturn) and Rahu, two karmic planets that test patience and bring wealth after delays. The movement of Mercury, the planet of finance and speculation, into a favorable trine with Venus—the significator of luxury and value—is a strong astrological signal for an upcoming bullish trend.
🔭 Astro-Indications Supporting the 420000 Target:
Jupiter’s expansion in a fiery sign indicates large-scale investor optimism.
Saturn’s retrograde will remove weak hands from the market and stabilize the climb.
Chandra (Moon) aligning with Mars gives Bitcoin aggressive emotional energy, ideal for sudden surges.
🧿 As per my divine calculation, the 4,20,000 INR milestone is not just a number, but a cosmic checkpoint, likely to be touched during a planetary window opening between mid-May to mid-June 2025. This phase aligns with Akshay Tritiya, an auspicious period where anything started is said to multiply manifold.
💫 My Guidance for Believers and Investors:
Invest not just money, but faith.
Keep your trades clean, avoid greed.
Consult your personal horoscope before making big investments.
In the divine language of astrology, Bitcoin is not just a currency—it's a karmic evolution of wealth. And yes, ₹4,20,000 is written in the stars.
Stay tuned. Stay blessed.
~ Najoomi Ji 🌟
Astrologer | Vastu Consultant | Lal Kitab Specialist

BTC/USD) Bullish reversal analysis Read The ChaptianSMC Trading point update
This is a bullish reversal analysis on BTC/USD (Bitcoin to USD) on the 4-hour chart, suggesting a potential long opportunity after a sharp corrective move.
---
Key Breakdown of the Chart:
1. Strong Downward Move with Potential Reversal:
Bitcoin experienced a sharp drop from the 88k region to ~74,387.50, now hitting a key demand zone (marked as "Orderblock").
2. Bullish Reaction Expected:
From the Orderblock support zone, a bullish reversal is anticipated.
The projected move aims to fill the imbalance and test the target zone between 87,152.94 and 88,557.14.
3. RSI Oversold:
RSI is around 32.27, indicating oversold conditions and adding confluence for a potential bounce.
4. EMA (200):
The 200 EMA lies around 85,153.85, which may act as dynamic resistance on the way up.
Mr SMC Trading point
5. Price Target:
The expected upside move is approximately +13,722.85 points (+18.75%), aiming for the supply zone above 87k.
---
Conclusion / Trade Idea:
Entry Zone: Near 74,387.50, the orderblock/demand area.
Target Zone: 87,152.94 – 88,557.14
Bias: Bullish short- to mid-term reversal.
Confluences: Oversold RSI, clean support zone, potential trendline bounce, and price inefficiency above.
---
Pales support boost 🚀 analysis follow)

The Market Looks Brutal Right Now... But Stay With MeThe Market Looks Brutal Right Now... But Stay With Me
It feels like a bloodbath out there… but here’s the truth:
A fast and brutal dump is honestly better than a slow, painful bleed. It shakes out the weak hands quickly—and sets the stage for stronger recoveries.
We've seen this movie before:
▪️ The Covid flash crash
▪️ War shocks like Russia vs Ukraine
▪️ Black swan events like FTX blowing up
▪️ The chaos of the LUNA death spiral
➡️ Each time, fear dominated the feed.
➡️ Each time, the "This time it's different!" crowd got louder.
➡️ And each time, those who stayed calm and DCA’d into real projects walked away with massive wins.
So why should this time—just because of tariffs or macro FUD—be any different?
It’s not.
Zoom out.
The long-term trend is built on strong fundamentals, not headlines.
Stick to the plan: accumulate multi-cycle, high-cap coins. Ride the wave.
The short-term noise fades, but smart strategy compounds.

BITCOIN analysis 08-04-2025 WAITING for a breakout ? Bitcoin (BTC/USD) has broken out of a falling wedge pattern, signaling bullish momentum after a period of correction. The price has reclaimed levels above $80,000 and is now eyeing the breakout zone near $85,000. A clear move above $85,000 can trigger the next rally towards $110,000. The breakout area from the previous consolidation range now acts as a strong support near $79,873. This price action sets a strong bullish tone for the coming sessions as long as Bitcoin holds above the key support zone. The chart structure points to a larger bullish continuation if current momentum carries forward.

Catch Trends Early with Parabolic SAR + QMA combo!Title:
Catch Trends Early with Parabolic SAR + QMA Combo! 🚀 (BTC/USD Example)
⸻
Here’s a simple but powerful trend-following strategy I personally use — combining Parabolic SAR with Quantum Moving Average (QMA).
Works great on Bitcoin, Gold, Nifty, and other trending assets.
⸻
How it Works:
1. Identify the Trend:
• When price is below QMA and Parabolic SAR dots are above price → strong downtrend
• When price is above QMA and Parabolic SAR dots are below price → strong uptrend
2. Confirm Entry After Reversal:
• Wait for price to close above QMA and SAR dots flip below price for a long setup
• Wait for price to close below QMA and SAR dots flip above price for a short setup
⸻
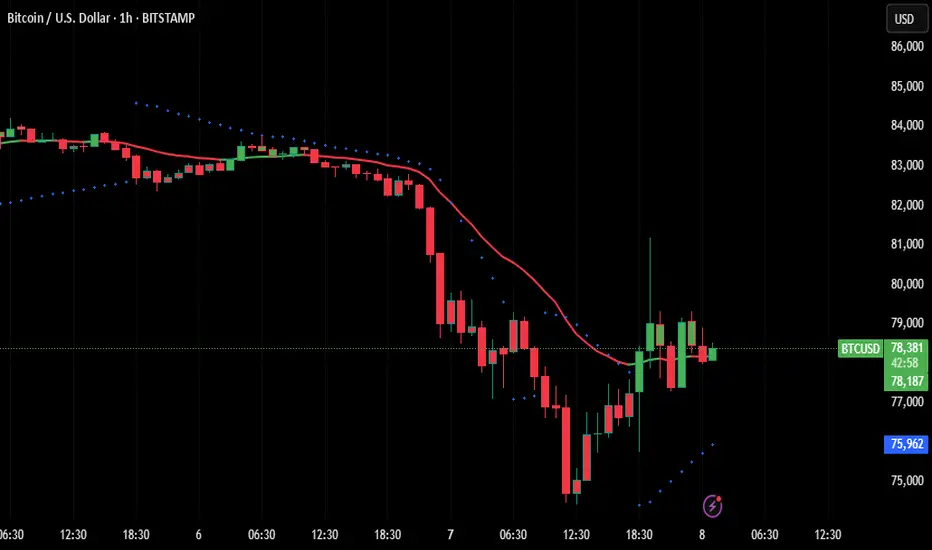
Real Example (BTC/USD 1H Chart):
• After a heavy downtrend, price broke above QMA and Parabolic SAR flipped below.
• This suggests a possible early trend reversal toward the upside.
If the setup holds, BTC could move back toward higher fib levels or supply zones.
⸻
Why I Love This Combo:
• Easy visual confirmation (SAR dots + moving average)
• Works well on 1H and 4H charts for swing trading
• Filters out false breakouts and sideways chop
⸻
Backtest this simple combo on your favorite assets and see the magic!
⸻
Found this helpful? Tap LIKE ❤ & FOLLOW ➕ for more strategies shared weekly!
⸻
#BTCUSD #Bitcoin #ParabolicSAR #TrendFollowing #TradingStrategy #QMA #TechnicalAnalysis #PriceAction #ForexStrategy #CryptoTrading
Death cross in BITCOIN on daily chart. 52-53k coming soonGet ready for a drastic fall and an opportunity to buy BTC at lower levels. Death cross has happened on BITCOIN on daily basis. This will result in a huge fall and the support looks like 53000.

Bitcoin Bybit chart analysis April 4 Hello
It's a Bitcoinguide.
If you have a "follower"
You can receive comment notifications on real-time travel routes and major sections.
If my analysis is helpful,
Please would like one booster button at the bottom.
Here is the Nasdaq 30-minute chart.
There are indicators released at 9:30 and 12:00.
First of all, Nasdaq reached a very important point on the chart
yesterday morning.
In a situation where there is no particular movement due to Trump's tariff policy,
it continues to flow downward.
As far as I remember, the US is a country with a lot of showmanship.
I've experienced it a lot while analyzing charts.
There are two indicators released today,
The Bollinger Band monthly central line touches on the chart + two indicators released,
so there is a very high possibility that Nasdaq will go up.
In the end, it's an action and a play on words to pick up and put down the ants,
and it won't be operated to the point where the US is destroyed.
Since there is a stop loss, we proceeded very aggressively.
As you can see, in the indicator announcement time zone,
the blue finger is short->long
or the red finger is long.
The rebound from the bottom is a condition for a sweep when looking at the chart upside down, so if successful, a surge can occur.
I just applied it to Bitcoin.
This is a 30-minute Bitcoin chart.
I marked the daily closing section for each flag,
and the purple flag on the far right is next Monday.
The purple finger on the lower left
is connected to the 81,404.4 dollar entry point yesterday, April 3.
Because it is touching the center line of the Bollinger Band 12-hour chart,
you need to hold on until 9 o'clock when additional candles are created to go up more.
*One-way long position strategy when the red finger moves
1. 83,568 dollar long position entry point / stop loss price when the green support line is broken
2. 86,871.5 dollar long position 1st target -> Top 2nd target
After that, target price in order.
If the strategy is successful, the 1st section that returns
You can use the long position re-entry section
The movement within the 1st section at the top and the 2nd section at the bottom is a sideways market.
If there is a crash in Nasdaq
It can drop below the bottom
And it can drop to 79.7K 3 times over the weekend, so please take note.
Up to this point, my analysis
Please just refer to and use it
I hope you operate safely with principle trading and stop loss prices.
You worked hard this week too.
Thank you.

Bitcoin Technical Analysis Bear/Bull Market- Bitcoin is currently trading at $74,452, down 32% from its ATH.
- Bitcoin is facing a significant sell-off along with major world indices due to the tariff war between the US and China and other powerhouses.
- This widespread selling will stabilize once it leads to the absorption of all bears, and eventually, we will see sideways action followed by an upward expansion.
- The important areas to monitor are the highlighted circles; the first one marks the origin of the move, while the second contains a fair value gap that has not yet been mitigated.
- From a Spot buyer perspective I would like to see either of the two paths playing out
- Manage risk until then
- Buying Zones: 60-63,000$ & 67,000-71,000$

BITCOIN - LIKELIHOOD OF A SHORT SQUEEZE BEFORE A DOWNWARD SLIDESymbol - BTCUSD
CMP - 84540
BTCUSD continues to exhibit a bearish trend after breaking the bullish structure on the weekly timeframe. There are no discernible bullish drivers at present, and from a technical standpoint, the price is poised to approach the imbalance zone between 75K and 73K.
Recent events, such as the crypto summit and discussions surrounding crypto asset support, have failed to provide substantial backing for the market. These events have historically been followed by further market declines.
From a technical perspective, the market remains in a downtrend, indicative of a global counter-trend. This suggests that the current price movement is contrary to broader market sentiment, which aligns with typical market behavior. On a general scale, key zones of interest include 75K, 73K, and the order block between 69K and 66K.
On a more specific level, attention should be given to the nearest liquidity zones at the higher levels, which may be tested prior to any further declines. These levels are located at 86,697 and 89,397
Key Resistance levels: 85135, 86678, 89397
Key Support levels: 79987, 78173, 73512
Following the false break of the 78K support level, there has been no significant market reaction. The market appears to be consolidating within the 84-85K range, which suggests a weakening of buying interest. Prior to any further downward movement, there may be a short squeeze within the identified liquidity zones, potentially leading to an additional decline.

Bullish Reversal Trade Setup for BTC/USD – 4H Chart AnalysisZone: Around 76,094 USD
This zone aligns with a demand/support area, highlighted by the purple rectangle.
Price has sharply dropped into this zone, suggesting a potential reversal or bounce opportunity.
⛔ Stop Loss
Level: Around 73,312 USD
Placed below the support zone to allow some volatility wiggle room.
A break below this could invalidate the bullish setup.
🎯 Target Point (Take Profit)
Level: 87,271 USD
Risk-to-reward ratio is approximately 1:3+, offering solid trade potential.
This level corresponds to a previously established resistance zone or supply area.
📊 Indicators
EMA 50 (red): ~82,106 USD
EMA 200 (blue): ~85,250 USD
Current price is below both EMAs, suggesting short-term bearish momentum, but this setup banks on a mean reversion or swing back up.
📈 Trade Idea Summary
Parameter Value
Entry 76,094 USD
Stop Loss 73,312 USD
Take Profit 87,271 USD
Risk/Reward ~1:3
Setup Type Bullish Reversal
🧠 Extra Notes
Wait for confirmation (candle reversal pattern) in the demand zone before entering.
Be cautious of fake-outs or breakdowns below support, especially with broader market weakness.

Bitcoin Bullish IdeaI'll be buying for that point of interest 78544.71 if I see confirmation for reversal.
Though H8 zone 79100.20 looks valid too as the price has triggered it and rejects it awesomely.
My projection is this new week is going to be Bullish not just for Bitcoin but some other. Crypto pairs too.

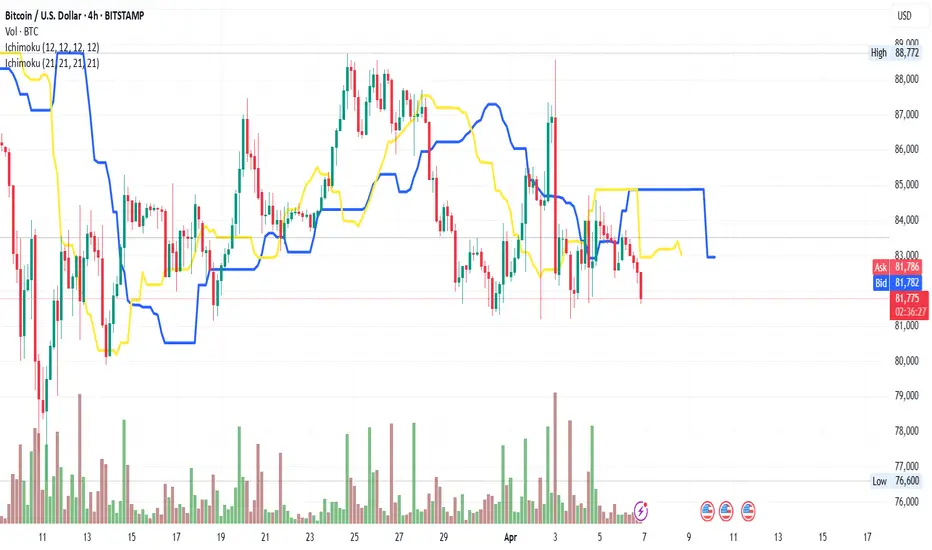
Using Ks Indicator of Two ichimokusUsing ichimoku to identify trend. works well for shorting as also going long. Cross over marks rise and fall, depending on time frame crossings.
BTCUSD SHOWING A GOOD DOWN MOVE WITH 1:10 RISK REWARD BTCUSD SHOWING A GOOD DOWN MOVE WITH 1:5 RISK REWARD
DUE TO THESE REASON
A. its following a rectangle pattern that stocked the market
which preventing the market to move any one direction now it trying to break the strong resistant lable
B. after the break of this rectangle it will boost the market potential for break
C. also its resisting from a strong neckline the neckline also got weeker ald the price is ready to break in the outer region
all of these reason are indicating the same thing its ready for breakout BREAKOUT trading are follws good risk reward
please dont use more than one percentage of your capitalfollow risk reward and tradeing rules
that will help you to to become a bettertrader
thank you
