BTC/USD: Sell Pressure Building AgainBTC/USD: Sell Pressure Building Again
Market Summary
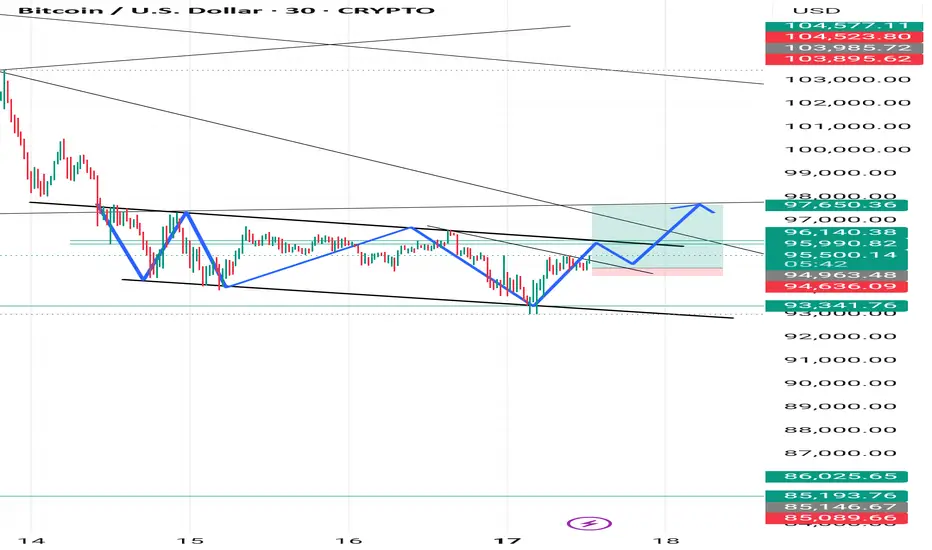
BTC/USD continues to operate within a declining market environment where sell-side pressure remains dominant. The recent recovery attempt has shown limited strength, forming only a temporary corrective phase within a broader downward cycle. Current conditions indicate that the market is preparing for another bearish continuation as liquidity builds on the upper side.
Market Behavior
The chart highlights a consistent pattern of declining impulses followed by shallow recoveries. Each upward phase has been met with swift rejection, reinforcing the dominance of bearish sentiment. The mid-range compression visible in the current structure reflects a controlled environment where market participants are redistributing positions rather than initiating larger upward transitions.
Momentum remains weak on the upside, and overall flow continues to align with the prevailing sell-side direction. Repeated structure shifts earlier in the sequence indicate that sellers are maintaining control of directional movement.
Current Setup
BTC/USD is now approaching a zone historically associated with short-term manipulation and liquidity grabs. Price appears to be forming a tight consolidation while climbing into this region. Such behavior often precedes a sell-side continuation, especially when rallies fail to show progressive expansion.
The chart projection suggests a likely formation of a distribution-style sequence before a renewed downward movement. This scenario aligns with the market’s broader behavior over recent sessions
Trade ideas


BTC USD LIVE TRADEbtc usd
live trade
trade tokk on basis of bigger time frame
and achived the target
good trade

BTC USD ANALYSISBTC USD going to test it's Od
From from it goes up
That would be the level for buy again if still not holding its OB and fail than again going down

BTCI found this good consolidation and chart pattern for a buy side opportunity please checkout and see if this worls for you guys
BTC LIVE TRADEBTC USD -live trade
took position as per setup
let us wait for it
for educational purpose only

BTCUSD If Btc breaks below red line then chances are high it could test below support level white line at 92000 and 88000
Disclaimer:
It's a personal view not a financial advice and I assume no responsibility and liability whatever outcome arises.


BTC live tradeBTC live trae
*Took buy side trade
*any one guess why?
lots of liquidity stands would be the level, where we trail sl.
and exit from buy side trade

BTCUSD 45m – Pennant Breakout Setup Toward 100k Target1. Pattern Formation: Bullish Pennant
The chart shows a pennant, formed after a sharp downward move followed by price compression.
The upper trendline is descending, the lower trendline ascending, converging into a tightening triangle.
This is typically a continuation pattern, but because the preceding move was downward, traders will often wait for confirmation from the breakout direction.
2. Breakout Attempt
The price is breaking slightly above the upper trendline, marked as ENTRY.
This suggests a potential bullish breakout, but:
The breakout candle is still small.
Ideally, you’d want volume confirmation (not shown in the image).
3. Stop-Loss Placement
The STOP LOSS is placed safely under:
The lower pennant trendline
Recent consolidation lows
This gives a logical invalidation level—if price drops below this, the breakout has failed.
4. Target Projection
The target of $100,006 is consistent with a measured move calculation:
Height of the initial impulse (the pole)
Added to the breakout point
On your chart, the projected move equals about +10%, also labeled on the right.
5. Risk–Reward
The setup shows good R:R, since:
Stop-loss is close
Target is distant
However, pennants can generate fakeouts, so caution is warranted.
6. Market Context (from the chart only)
Current price around $95,984.
The overall trend in the 45-minute view appears mixed:
Strong drop earlier
Stabilization
Compression
The breakout direction will determine the next phase.

Part 3 Learn Institutional Trading What Are Options?
Options are derivative contracts, meaning their value is derived from an underlying asset. The underlying asset may be stocks, indices, commodities, currencies, ETFs, or even cryptocurrencies.
There are two main types of options:
Call Option – Gives the buyer the right, but not the obligation, to buy the underlying asset at a specific price before a specific date.
Put Option – Gives the buyer the right, but not the obligation, to sell the underlying asset at a specific price before a specific date.
The specific price is called the strike price, and the last day the contract is valid is the expiry date.

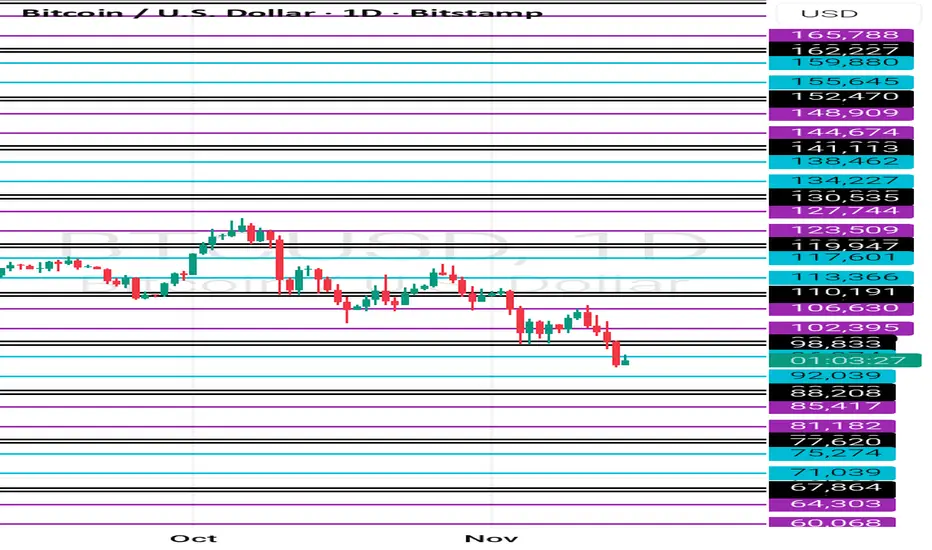
BTC Weekly analysis and sell/Buy scenarios....BTC moved as per our plan throughout last week more than 13K points so far, and still in down trend. Price is continuously creating BOSs and moving toward our target of 90K. Meanwhile during sniper delivery, it has created some pull back zones, which can be tested before reaching to our target. So we have few possible multi RnR trades scenarios before seeing possible reversal.
1. Sniper deliver is already done and price is pulling back slowly.
2. We may see possible pullback sell trade opportunity around 100K and 103.5k levels.
3. RSI is also showing sell side pressure, giving another confluence.
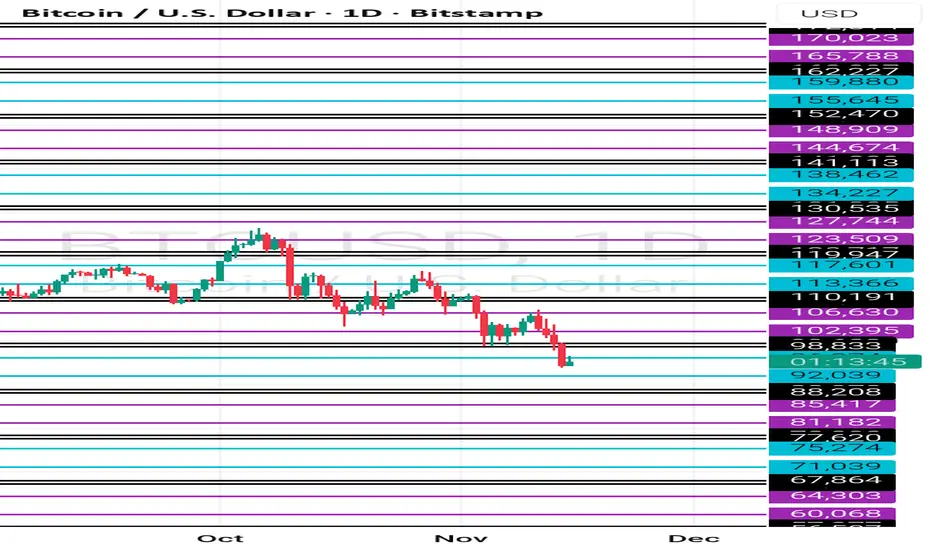
4. Most probably price will take liquidity of FVG/RDRB level and create MSS/CISD/TS/iFVG in LTF.
5. Price should show rejection/reversal in respective LTF (5m/15m) at FVG zone.
6. Take the trade only once clear entry model i.e. turtle soup. iFVG break, CDS or MSS happens on LTF
All these combinations are signalling a high probability and ~7R trade scenario.
Note – if you liked this analysis, please boost the idea so that other can also get benefit of it.
Also follow me for notification for incoming ideas.
Also Feel free to comment if you have any input to share.
Disclaimer: This analysis is for educational purposes only and does not constitute investment advice. Please do your own research (DYOR) and check with your financial advisor before making any trading decisions.

BTC NEARBY REVERSALIf you look at this chart i am showing two rectangle which is telling somthing that,BTC is at balancing of it's time and price both.But to get ballanced it's price there is space to come down,it may not come down if it respect the green trendline plotted here which is an important support as well.
And i marked here in green arrow whenever it tsken reversal,remember it that this is weekly chart.


Btc weekly cycle study How to study this range find starting point range pink line to pinnk line starting point blue line to beetwin range
BTC 3rd cycle weekly range complete Btc 3rd cycle weekly base complete
Possible bounce back to 104444
Avoid short today wait for bullish side for Long thanks 👍


BTC USD SELL TRADE - #LIVEMARKET #LIVEBTC USD
*took sell position.
*any one tell me why took sell position?

A bullish engulfing patternPrior Downtrend: The pattern must appear during an existing downtrend.
First Candle (Bearish): A small red (or black) bearish candlestick forms, indicating the continuation of selling pressure.
Second Candle (Bullish): A large green (or white) bullish candlestick forms immediately after.
Engulfing: The body of the second (green) candle must completely cover or "engulf" the entire body of the first (red) candle. The second candle's body opens lower and closes higher than the first candle's body.
Market Sentiment Shift: This shift from a small bearish candle to a large bullish one suggests that buyers have taken control of the market.

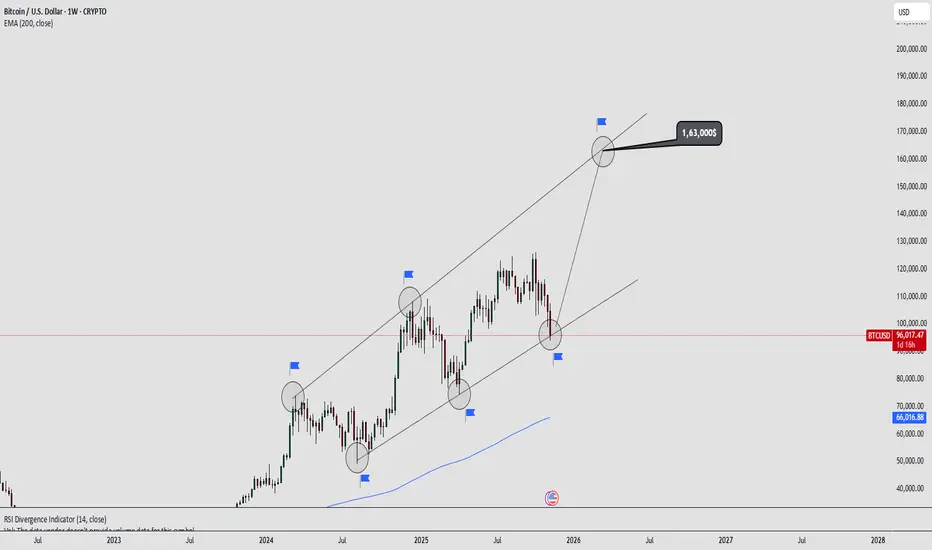
Bitcoin Long-Term Channel Analysis | BTCUSD to $163K Target |Bitcoin is currently respecting a multi-year ascending channel on the weekly chart. The price recently touched the lower trendline support, suggesting that the long-term structure is still intact.
This setup highlights a classic “higher highs and higher lows” pattern within the parallel channel, showing that BTC continues to follow its historical rhythm of expansion and correction phases.
Observations :
• Channel support: around $90,000 – $95,000 zone
• Channel resistance: projected near $160,000 – $165,000
• 200 EMA on the weekly chart near $66,000 providing long-term trend support
• RSI showing signs of recovery from the mid-zone
Technical Outlook:
If Bitcoin maintains the current channel support and forms a bullish reversal candle on the weekly close, the next leg of the rally could target $160K+ within the same channel structure.
Invalidation occurs on a confirmed weekly close below $90K, which would signal a potential trend shift.
Market Sentiment : Bullish (Long-Term)
Timeframe: Weekly
Style: Positional / Long-Term Analysis
Disclaimer: This is a personal technical view for educational purposes, not financial advice.
AI Trading Secrets and the Indian Psychology Trading Era1. The Rise of AI Trading: Invisible Machines Behind Every Move
AI trading refers to the use of machine learning models, predictive algorithms, neural networks, and automation to make trading decisions. These systems process data far beyond human capability — from price movements and volatility to sentiment and macro signals. The real secret of AI trading is that it doesn’t just “see data”; it learns from historical patterns and adapts to real-time conditions.
AI Trading Secret #1: Feature Engineering Is More Important Than Models
Most people think AI magic lies in fancy models. But in reality, the quality of input data (“features”) determines how good the prediction is. Smart AI traders know how to extract features like:
Volume clusters
Volatility squeeze signals
Order book buildup
High-frequency momentum micro-patterns
These allow AI systems to predict not the “future market”, but the probability of short-term moves.
AI Trading Secret #2: AI Does Not Predict — It Works on Probability Mapping
AI systems calculate probability zones. For example:
68% probability: NIFTY may stay within a certain band
55% probability: a breakout may occur
72% probability: volume expansion confirms momentum
This probabilistic thinking makes AI far more disciplined and emotion-free compared to human traders.
AI Trading Secret #3: Alternative Data Is the True Edge
Modern AI traders are not limited to charts. They read “unseen data,” including:
Social media sentiment
Google Trends
WhatsApp retail buzz
FII/DII trading micro-behaviour
Global ETF flow patterns
Options chain clustering
This alternative data gives AI a big advantage — early detection of shifts that humans take hours or days to notice.
AI Trading Secret #4: Automation Protects You From Human Weakness
AI never:
Overtrades
Gets greedy
Averages blindly
Seeks revenge trades
Breaks rules
This discipline alone gives AI traders a massive edge.
AI Trading Secret #5: AI’s Final Power — Backtesting + Optimization
AI systems test thousands of scenarios:
Different stop losses
Different entries/exits
Different indicators
Different position sizing rules
This creates strategies that are mathematically optimized rather than emotionally guessed.
2. Indian Psychology Trading Era: A New Mindset Born After 2020
India has seen a trading revolution after COVID. Nearly 10+ crore retail traders entered the market. But what makes Indian trading psychology unique?
2A. India’s Retail Trader Behaviour: Emotional Yet Evolving
Indian traders historically operated on:
Tips
WhatsApp calls
Penny stocks
Rumours
Overconfidence
But after 2020, a shift began — more awareness, YouTube learning, Algo tools, and community learning transformed the mindset.
Psychology Trend #1: Hope-Based Trading to Data-Based Trading
Earlier:
People traded based on “feeling Nifty will go up.”
Now:
People analyse:
OI data
PCR
Volume profile
Institutional flow
This marks the birth of the Indian Data-Driven Retail Era.
Psychology Trend #2: From Heroic Trading to Systematic Trading
Earlier:
“Bhai, full margin laga do, kal upper circuit jayega!”
Now:
Traders prefer:
Swing + risk-reward
Stop-loss
Algo automation
Hedged option strategies
The ego of “catching tops and bottoms” is slowly dying.
Psychology Trend #3: Options Mania Changed Behaviour
Indians love leverage. Options gave them:
Low capital
High ROI possibility
Fast trading cycles
This created both growth and chaos. But now traders are learning:
Sell-side edges
Premium decay
IV crush
Weekly expiry psychology
This learning curve is transforming the Indian retail community into a more sophisticated force.
3. Blending AI With Indian Psychology: The New Era of Smart Retail
This is where the magic happens. When AI meets Indian trading psychology, three powerful shifts occur:
Shift #1: AI Reduces Emotional Mistakes of Indian Traders
Indian traders struggle with:
Fear of missing out (FOMO)
Holding losers
Exiting winners early
Overtrading for “thrill”
AI solves these with:
Rule-based systems
Automatic execution
Pre-fixed risk management
Objective signals
Disciplined execution removes 80% emotional damage.
Shift #2: Indian Traders Bring Intuition AI Cannot See
AI understands data, but not “political sentiment,” budget buzz, or Indian-style retail behaviour. Indian traders understand:
Election season moves
Dubbed “operator activity”
Midcap burst cycles
Sectoral rotations
Market mood swings
This intuition plus AI’s objectivity creates the perfect trading duo.
Shift #3: The Rise of Hybrid Systems in India
This is the future:
A blend of human analysis + AI execution.
Example workflow:
Trader analyses volume profile + market structure
AI system generates probability zones
Human selects scenario
AI trades automatically
This hybrid edge will dominate the Indian markets in coming years.
4. Biggest Psychological Barriers Indian Traders Must Break
To fully enter the AI + psychology era, Indian traders must overcome:
Barrier 1: Overconfidence Bias
Thinking “I know the market” instead of “market can do anything.”
Barrier 2: Tip Addiction
Relying on outside voices instead of system-based confidence.
Barrier 3: Quick-Rich Fantasy
Expecting to make 50,000/day with 10,000 capital.
Barrier 4: Revenge Trading
Trying to “win back” lost money emotionally.
Barrier 5: Impulse Trading
Taking a trade because the candle “looked good.”
AI erases most of these — if traders let the system work.
5. What the Future Looks Like
India is entering a very powerful trading era:
AI will handle execution
Humans will handle market structure
Psychology will be increasingly coded into systems
More retail traders will use algos
Market will become more competitive
Only disciplined + data-driven traders will survive
The ones who stay in the game the longest will be those who embrace AI discipline + Indian intuition.
