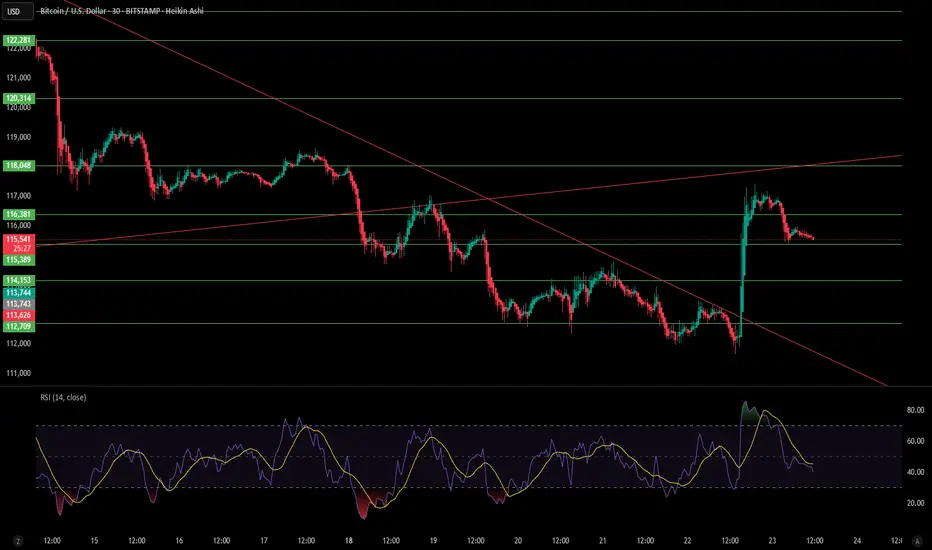
Bitcoin (BTC/USD) – 4H Chart AnalysisBTC is currently trading at $115,669 after a recovery bounce from the $112,700 support zone. Price recently broke above the descending trendline (red), signaling a potential shift in short-term momentum.
Key levels to watch:
🔴 Immediate Resistance: $116,000 – $116,380
🟢 Supports: $115,389 / $114,153 / $112,709
📈 Higher Resistance Zones: $118,048 / $120,314 / $123,273
The RSI (14) is currently at 55.96, slightly above neutral, suggesting BTC has room to move either direction without being overbought or oversold.
📌 Bullish Scenario: A break above $116,380 could open the way to retest $118,000 and possibly $120,000.
📌 Bearish Scenario: Rejection from current resistance may lead to a pullback toward $114,000 – $113,700, with deeper downside risk if $112,700 fails.
⚖️ Outlook: BTC is trying to regain bullish momentum after a recent downtrend. A decisive move above $116K will be crucial for further upside.
BTCETH.P trade ideas
BTCUSDIdea 1- Pullback to retest the H1 supply zone.
Idea 2- Rejection of the level and retracement to the H4 demand zone, coinciding with the fib kill zone. (Enter based on confirmation only).
Idea 3- Bullish continuation on the higher timeframe. (Enter based on confirmation only).
Sharing idea for educational purposes only.

High Probable down side trade in BTCwe see a good high probability downside trade in BTC at 30 minute.
MB, FVG and OTE all three are forming cluster at that zone which may lead to a good sell trade

Bitcoin Trend – Breakout from the Downward ChannelBitcoin Trend – Breakout from the Downward Channel
Hello traders,
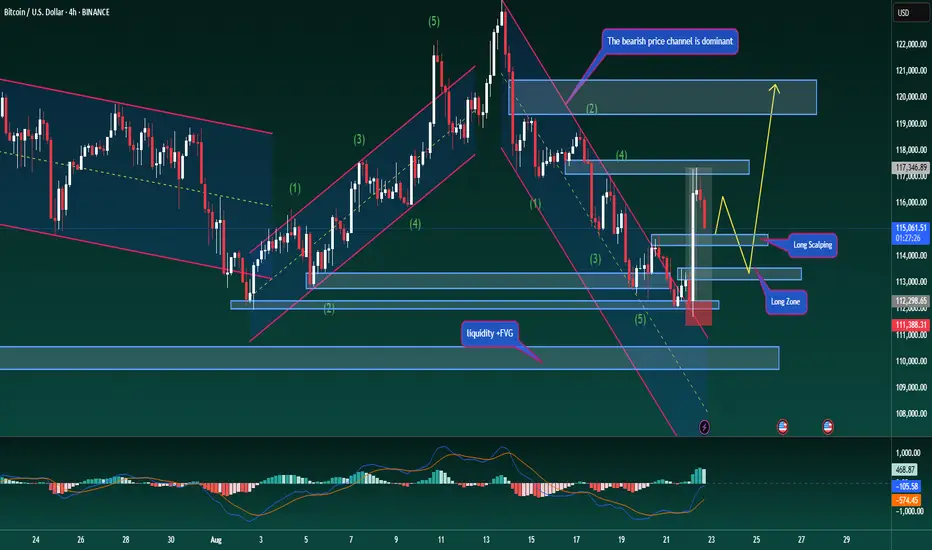
BTC has broken out of its descending channel with a very strong candle, moving exactly as expected in the corrective rally. At present, price is reacting around 117k, which confirms a shift in structure. For the medium term, the primary trend should now be considered bullish. Traders can look for pullbacks around 114.5k – 113k to add fresh long positions.
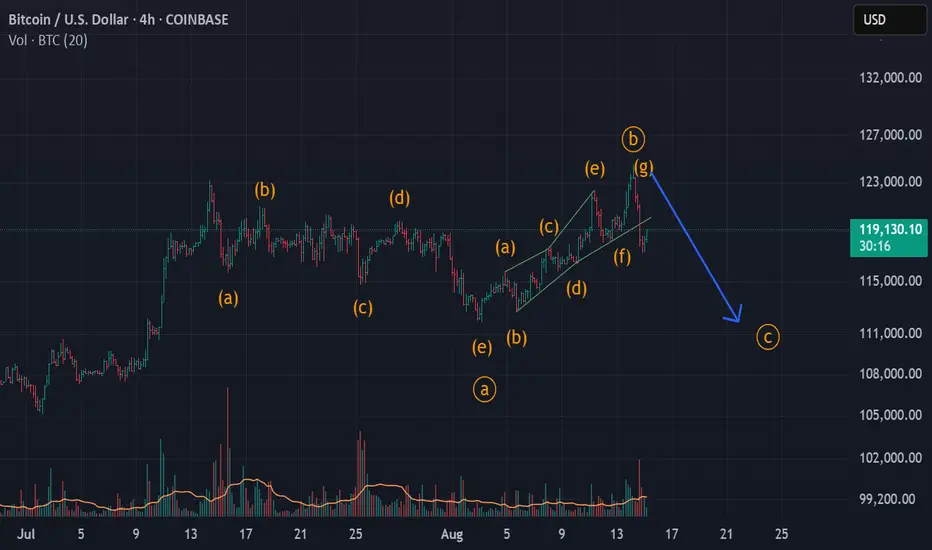
From an Elliott Wave perspective, BTC is moving within the final ABC structure. The current move is wave B, and we will be looking to position long once wave C completes.
Target for this long scenario: 120k – 121k, where a mild correction may occur as liquidity is taken.
This is my personal outlook on Bitcoin. Always follow price closely and manage your account carefully to stay safe.
What’s your view on BTC’s breakout? Share your thoughts in the comments so we can trade better together.
Bitcoin – Medium-Term Outlook for Long/Short TradersBitcoin – Medium-Term Outlook for Long/Short Traders
Hello traders,
BTC continues to move within the descending channel – something we can all clearly see. Recently, price bounced strongly after touching the solid support zone near 112k, and now it is only about 2k away from the target level for a potential swing long entry.
If BTC manages to break above the 114.8k resistance, it could signal a short-term reversal, pushing towards 117.5k before resuming the broader downtrend. This scenario could act as a potential trap for those holding long-term short positions.
We also see early signs of structure changing: the trendline has already shown signs of breaking, with price trading above the descending channel. At the same time, MACD is showing rising volume and its averages are starting to curve upward. Together, these factors support the case for a short-term corrective rally.
Strategy: Consider long entries near the current zone, with the option to DCA if price breaks above 114.8k.
Please note this is my personal view — always manage risk and follow your own plan.
What’s your take on this setup? Share your thoughts in the comments so we can discuss further.
BTC entering Wave DBitcoin has likely ended Wave C in a diametric formation.
It could now entered Wave D, which itself would be a corrective rise.

BTC update....“BTC has taken strong support at the 112,000 level and has now formed a bullish Cup and Handle pattern. The current structure looks bullish; however, if BTC attempts to form a new low, it is likely to test the external kill zone, which will also serve as our downside target.”

BTCUSD IS NOW AT REVERSALWhat i am saying will depend on YELLOW HORRIZONTAL line which is previous resistance and support as well.
you can see blue trend lines which is on work .
One more thing is here that one out side reversal is visible which is forming a pattern drawn in white thick & thin line togather.
If you see closely there is a ratio 1:1
wher pattern is drawn if i say more clearly then see recent swing high and low then you find that both swings are almost same not exactly but probably it is same so what i am saying that there may be possiblity of reversal .One can look for that.
this is not my buy/sell call.

Bitcoin 1 Day view Support Levels:
$112,000 — a critical short-timeframe level; a sweep below this could trigger opportunities according to @CryptoMichNL.
$113,000–$114,000 — active support zone where traders are positioning, as noted by Greeks.Live.
$111,200–$112,700 — a daily + 4-hour Fair Value Gap (FVG) support area. Holding this region may prevent further downside.
Resistance Levels:
$115,000 — identified as a pressure zone by crypto observers; its breach could lead to renewed momentum.
$115,700–$116,100 — Fibonacci-style resistance tiers from Barchart’s pivot-point analysis.
What to Watch Next
If BTC holds above $112,700–$113,000: Could attract buyers looking for a bounce, possibly aiming toward $115K+.
If BTC breaks below $112K: Risk of deeper correction; next meaningful stop near $111K.
If BTC clears $115K: Likely opens the path toward the $115.7–$116.1 zone and beyond.

Bitcoin – Continuing to Follow the Bearish StructureBitcoin – Continuing to Follow the Bearish Structure
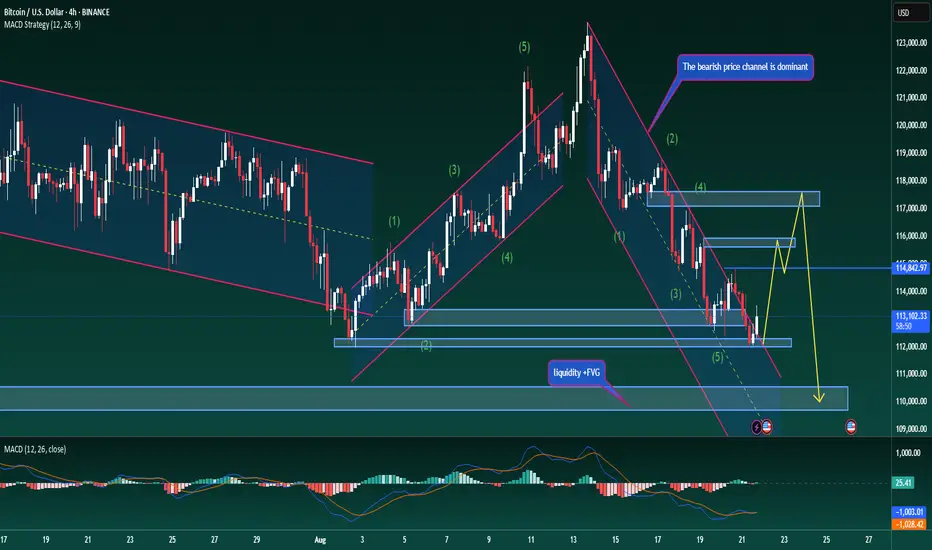
BTC has continued to follow the earlier analysis, with price moving back towards the 115,000 zone and resuming its downward waves. The descending channel remains intact and is guiding price action, with the next target area expected near 110,000.
To reach this level, BTC may form another Dow-style downward leg, closely tracking the trendline within the channel. That said, traders should be cautious — MACD is showing rising volume and the moving average is beginning to turn upward, which could be an early warning sign against aggressive short positions.
In trading, following the main trend is always the priority. Going against the market should only be considered when there is clear evidence of large liquidity zones or strong trader sentiment at key levels. Otherwise, trading in line with the prevailing trend remains the safer approach.
For BTC, the strategy is to keep following the descending channel and look for entries at trendline touches. Short-term scalping opportunities may arise around 112,600 and 111,800. The medium-term short entered near 115,000 remains active, with targets set towards 110,000. This zone will also be watched closely as a potential buying area, and decisions can then be made on whether to hold positions for the longer term.
This is my trading outlook for BTC. I hope the scenarios are useful, and I’d love to hear your views in the comments.
#BTCUSD #Bitcoin #CryptoAnalysis #TechnicalAnalysis #PriceAction #Trendline #DowTheory #MACD #CryptoTrading #SwingTrading
btc trade --paper tradingBitcoin is currently trading in a sell zone, indicating potential downward pressure. Technical indicators suggest overbought conditions or resistance near key levels. Traders may consider tightening stop-losses or booking partial profits. Stay sharp and monitor price action closely—volatility could spike.

Bitcoin Update – Price Action Still on TrackBitcoin Update – Price Action Still on Track
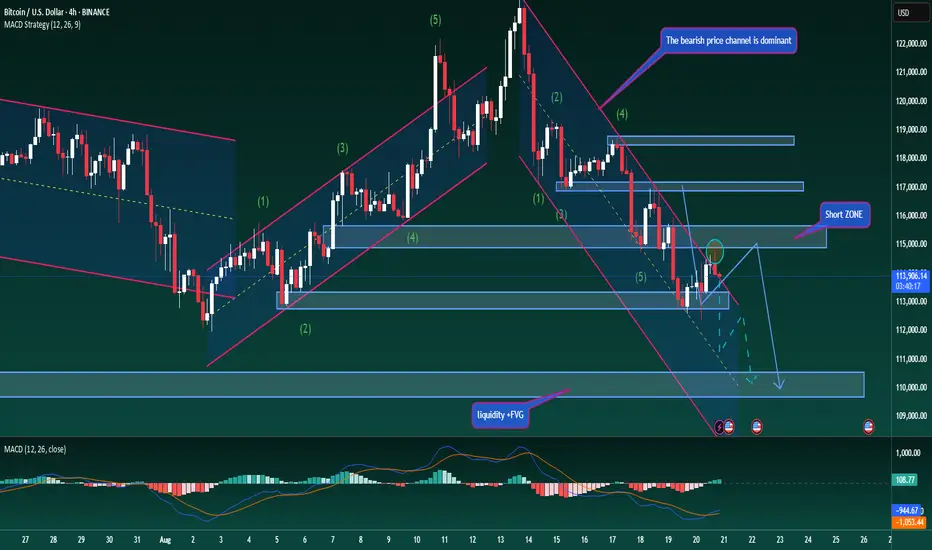
Yesterday’s scenario has played out accurately, with BTC continuing to respect the descending channel. Each time price touched the upper trendline, it quickly turned lower, and now it is reacting around the midline of the channel, near the 113,000 zone — exactly the level highlighted earlier as an area to watch.
With this corrective move, I expect BTC could retest the 115,000 area before resuming its broader downtrend. The next downside target remains around 110,000, as larger timeframe structures usually require a corrective pullback before continuing the main trend — something Dow Theory traders will clearly recognise.
Today also coincides with discussions on interest rate policy, which could bring higher volatility as investors take a more cautious stance across global financial markets. However, FOMC outcomes often have limited impact on Bitcoin, given its relative independence from traditional macroeconomic drivers compared to gold or forex markets.
In the short term, traders may consider long opportunities near the 113,000 area with a tight stop just below the recent support, aiming for a corrective move towards 115,000 before the main downtrend resumes.
Strong trading comes from patience and discipline. Stick with the defined scenario rather than reacting emotionally to intraday swings.
Wishing you successful trades. What’s your view on Bitcoin’s price action here? Share your thoughts below.
#BTCUSD #Bitcoin #CryptoAnalysis #TechnicalAnalysis #PriceAction #Trendline #CryptoTrading #SwingTrading

Part 2 Trading Master Class Advantages of Option Trading
Leverage – Small capital controls large positions.
Flexibility – Strategies for any market condition.
Defined Risk (for buyers) – Maximum loss = premium.
Hedging Tool – Protects portfolios from crashes.
Income Generation – Through selling options (covered calls, spreads).
Risks in Option Trading
Time Decay – Value erodes quickly near expiry.
Unlimited Loss for Sellers – Naked option selling is very risky.
Volatility Crush – After events like results, volatility falls and option premiums collapse.
Liquidity Risk – Some contracts are illiquid, making exit difficult.
Psychological Stress – Options move very fast; requires discipline.

btc new trade placed---only paper tradeBitcoin (BTC) is showing signs of bullish momentum..
only paper trade

EDUCATIONAL | Wave C in progressBitcoin completed Waves A and B
Wave A formed a Triangle while Wave B was a Diametric
Wave B formed in less time than Wave A, which is not possible in Flats
And Wave A was a triangle which is possible in a Diametric/Symmetrical
So, Wave C which is currently in progress could itself be a corrective fall and part of a larger Diametric formation on a daily timeframe
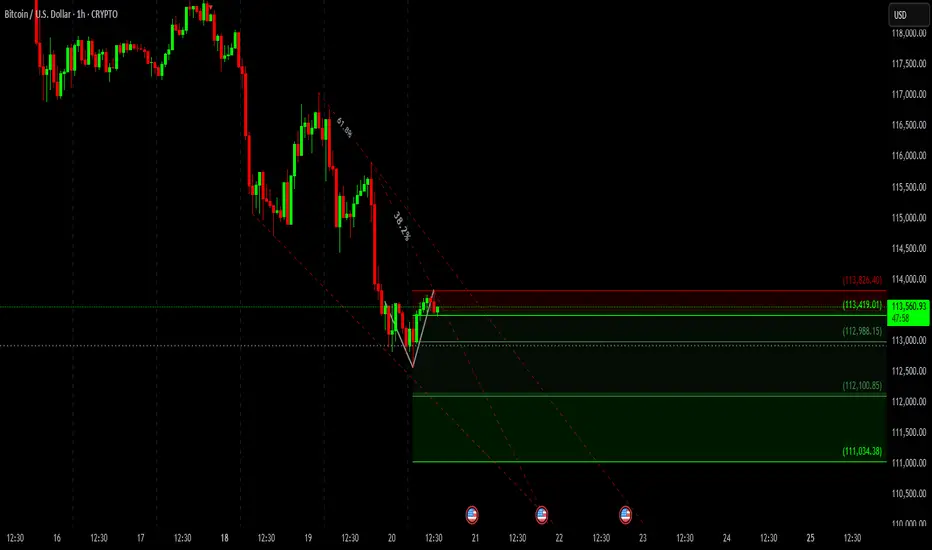
Bitcoin (BTC/USD) Technical Analysis – 1H Chart🚨 Bitcoin (BTC/USD) Technical Analysis – 1H Chart 🚨
Bitcoin is currently trading around $113,440, showing signs of rejection near the 38.2% Fibonacci retracement after a recent bounce from the channel’s lower boundary.
📉 Trend Outlook:
The pair remains inside a descending channel, indicating the bearish momentum is still dominant.
Price attempted to recover but got rejected below the 61.8% retracement zone, showing strong selling pressure.
📌 Key Levels to Watch:
Resistance: $113,826 (major supply zone)
Immediate Support: $113,419 (short-term structure)
Target Supports:
$112,988
$112,100
$111,034
⚡ Trading View:
As long as BTC stays under $113,800 resistance, the downside targets remain open. Breaking below $113,419 could accelerate selling pressure towards $112k levels. Bulls need a decisive break above $113,800 to reverse momentum.
✅ Summary:
Trend → Bearish (within a falling channel)
Bias → Sell rallies below $113,800
Potential Targets → $112,988 – $111,034
#Bitcoin #BTC #CryptoTrading #CryptoAnalysis #BTCUSD #CryptoCharts #Fibonacci #PriceAction #CryptoBearish #BTCAnalysis
Option Chain Analysis1. Introduction
In modern trading, derivatives like options have become one of the most powerful instruments. Among the many tools available to option traders, Option Chain Analysis stands out as the backbone of decision-making. If stock market trading is like a battlefield, then an option chain is the detailed map of that battlefield – showing where buyers and sellers are positioned, where the pressure lies, and where opportunities may emerge.
An option chain (also called an options matrix) is simply a table that displays all available option contracts for a particular underlying asset (stock, index, commodity, etc.) along with their respective prices, volumes, and open interest. But, when we say option chain analysis, we mean much more than just reading a table – it’s about interpreting the data to understand market sentiment, possible support & resistance levels, and probable future price movements.
This guide will walk you through everything: from the basics of an option chain, the meaning of each data point, to advanced strategies for trading with option chain insights.
2. What is an Option Chain?
An Option Chain is a list of all the option contracts (both calls and puts) for a specific security across different strike prices and expiration dates.
For example, if you look at the Nifty 50 Option Chain for the current expiry, you’ll find:
All Call Options (CE) on one side.
All Put Options (PE) on the other side.
Strike prices in the middle column.
Alongside each strike, you’ll see key data like Last Traded Price (LTP), Volume, Open Interest (OI), Change in OI, Implied Volatility (IV), etc.
An option chain is essentially a snapshot of trader positioning. By reading it carefully, one can figure out where big institutions, retailers, and market makers are betting.
3. Structure of an Option Chain
A typical option chain table contains:
Strike Price: The agreed price at which the option holder can buy (Call) or sell (Put) the underlying.
Call Options (CE):
OI (Open Interest)
Change in OI
Volume
LTP (Last Traded Price)
Bid/Ask prices
Implied Volatility (IV)
Put Options (PE):
Same set of data points but for Puts.
Let’s break each down:
3.1 Strike Price
The reference price levels at which options can be exercised. Traders often focus on strike prices close to the current underlying price (ATM – At The Money).
3.2 Open Interest (OI)
Definition: Number of outstanding contracts not yet squared off.
Importance: High OI indicates strong trader participation.
Example: If the Nifty 20000CE has very high OI, it means many traders expect resistance around 20,000.
3.3 Change in OI
Tells you whether positions are being built (fresh contracts added) or unwound (closed).
Rising OI with rising price → Long build-up.
Rising OI with falling price → Short build-up.
3.4 Volume
Shows trading activity in a contract for the day. High volume indicates short-term interest.
3.5 Implied Volatility (IV)
Market’s expectation of future volatility.
High IV = Expensive options (market expects big moves).
Low IV = Cheaper options (market expects stability).
3.6 Bid/Ask Prices
The demand and supply levels at which traders are willing to buy/sell options.
4. Key Concepts in Option Chain Analysis
Before diving into strategies, you must understand how traders interpret option chain data.
4.1 Support and Resistance via OI
Support: Identified at Put strikes with highest OI (traders selling puts expect the market to stay above).
Resistance: Found at Call strikes with highest OI (call sellers expect the market to stay below).
Example:
If Nifty is at 19,800:
Highest PE OI at 19,500 → Support at 19,500.
Highest CE OI at 20,000 → Resistance at 20,000.
4.2 Put-Call Ratio (PCR)
Formula: PCR = Total Put OI ÷ Total Call OI
Interpretation:
PCR > 1 → Bullish (more puts sold, traders expect market to rise).
PCR < 1 → Bearish (more calls sold, traders expect market to fall).
4.3 Long/Short Build-ups
Long Build-up = Price ↑ + OI ↑
Short Build-up = Price ↓ + OI ↑
Long Unwinding = Price ↓ + OI ↓
Short Covering = Price ↑ + OI ↓
These patterns show real-time trader behavior.
4.4 Max Pain Theory
The strike price where option sellers (who are usually big players) would face the least loss at expiry.
This level often acts like a magnet as expiry approaches.
5. Step-by-Step Approach to Option Chain Analysis
Let’s build a systematic approach:
Step 1: Check Underlying Price
Find the current price of the stock/index.
Step 2: Identify ATM Strike
Pick the strike closest to the current price. That’s the most active zone.
Step 3: Check OI Levels
Look at which strikes have highest Call OI (resistance) and Put OI (support).
Step 4: Study OI Change
Fresh build-up of OI tells you the immediate sentiment.
Step 5: Watch PCR
Get a sense of whether market is leaning bullish or bearish.
Step 6: Note Implied Volatility
Rising IV before events (like results, Fed meeting, Budget) means traders expect big moves.
Step 7: Confirm with Price Action
Always validate OI data with charts. If price is near resistance and call OI is rising, chances of breakout are less.
6. Practical Example (Nifty Option Chain)
Imagine Nifty is trading at 19,800.
Option Chain shows:
CE 20,000 OI = 3 lakh contracts (highest) → Major Resistance at 20,000.
PE 19,500 OI = 2.8 lakh contracts (highest) → Major Support at 19,500.
PCR = 1.2 → Market slightly bullish.
IV rising → Expect big move soon.
Interpretation:
Market likely to trade between 19,500 – 20,000 until a breakout occurs.
7. Advanced Insights from Option Chain
7.1 Shift in OI
If highest Put OI shifts upward (e.g., from 19,500 to 19,700), it means support is moving higher – bullish sign.
7.2 Unwinding
If traders start exiting positions (OI ↓), it signals they no longer trust that level.
7.3 Short Squeeze
If market breaks resistance, call writers may panic and cover, leading to a sharp rally.
7.4 Volatility Skew
Sometimes, IV is higher for certain strikes – indicates market expects asymmetric movement.
8. Option Chain Analysis for Traders
8.1 For Intraday Traders
Use OI changes on a 5-15 min basis.
Spot short-term resistance & support zones.
Quick scalping opportunities.
8.2 For Swing Traders
Focus on weekly/monthly option chains.
Watch how supports/resistances are shifting.
Combine with price action to ride bigger moves.
8.3 For Investors
Use chain data to hedge portfolios.
Writing options around high OI levels generates premium income.
9. Common Mistakes in Option Chain Analysis
Relying only on OI without price confirmation.
Ignoring global events (Fed policy, crude oil prices, earnings, etc.).
Misinterpreting PCR extremes (too high PCR can signal overbought).
Forgetting expiry dynamics – option data changes rapidly.
10. Real-Life Scenarios
Scenario 1: Budget Day
IV shoots up before budget.
Once budget is announced, IV crashes (IV Crush).
Traders who only looked at option prices without IV understanding lose heavily.
Scenario 2: Expiry Day
Market tends to move toward Max Pain strike.
Options near ATM decay the fastest.
Sellers dominate expiry trades.
Conclusion
Option Chain Analysis is like reading the pulse of the market. It tells you what the majority of traders believe, where the market might face obstacles, and where it could find strength. For intraday traders, swing traders, or even long-term investors, option chain is an essential skill to master.
By carefully analyzing OI, IV, PCR, and Max Pain, and aligning them with price action, traders can significantly improve accuracy. But remember – option chain doesn’t predict the future with certainty; it only provides probabilities and market sentiment. The real edge comes when you combine it with risk management and discipline.
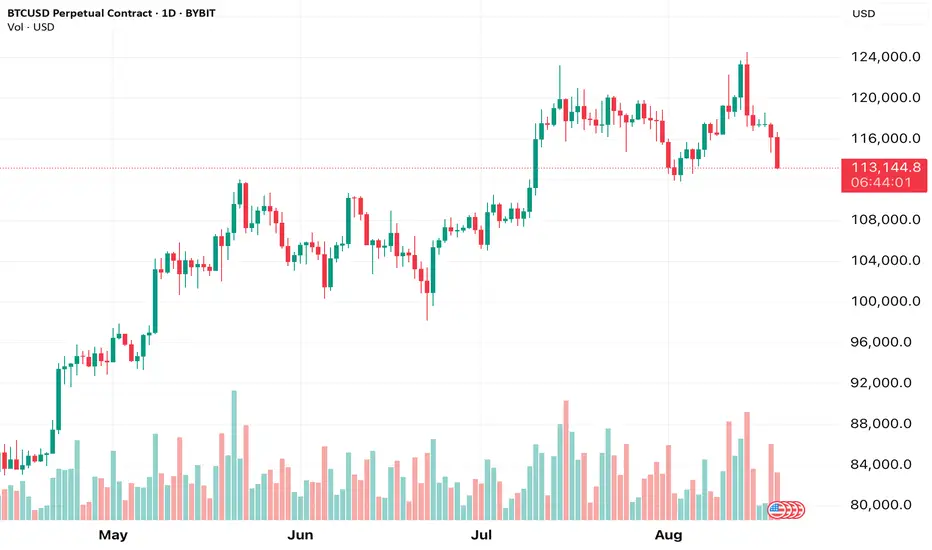
BTC chart for my own analysisFor technical analysis matching tech with AI. Lookign at various aspects to see what makes sense for short and long.
Big Day for BTCUSDSurpassing my target of 116K, BTC has crossed 118K today after closing above the long term resistance line.
Is it a phase shift or a temporary push?
Watch for 115K as support.

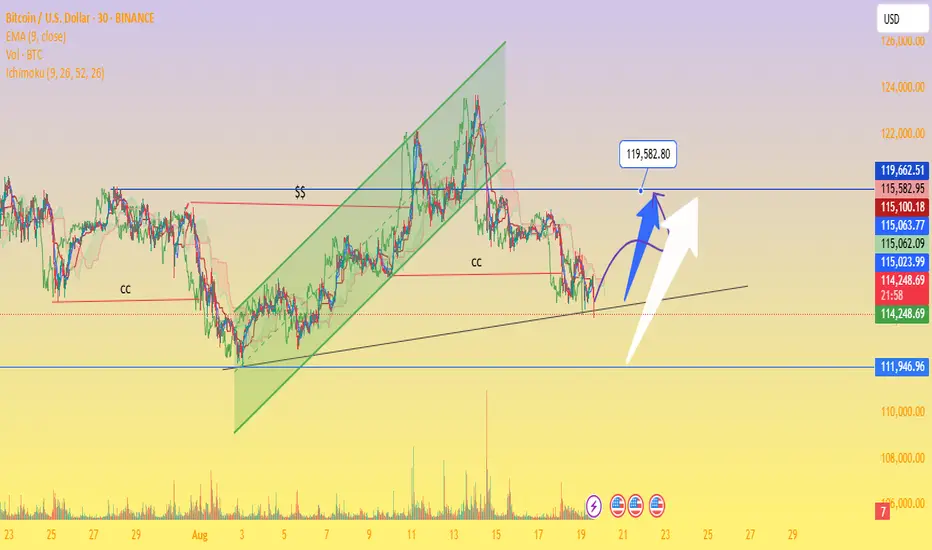
Bitcoin at a Critical Support – Breakout Toward $119K or ?Ascending Channel Breakdown – Price previously respected a rising green channel but broke below, showing weakness.
Critical Support Zone: Around $111,946 – $114,000 (black trendline + yellow support area).
Resistance Levels:
Near-term: $115,100 – $115,582
Strong: $119,582 (highlighted as major upside target)
Volume Profile: Declining volume with recent dip → signals possible accumulation before the next move.
Ichimoku Cloud: Price is slightly below cloud, indicating short-term bearish bias but with potential rebound if reclaimed.
Scenarios:
Bullish Case (Blue/White Arrows): If BTC holds above $114,000 support and breaks $115,500, a rally toward $119,500+ is possible.
Bearish Case: Failure to hold $114,000 may trigger a drop toward $111,946 (major demand zone).
Part 1 Master Candle Sticks PatternRisk Management in Options
Position Sizing: Don’t risk more than 1–2% of capital in one trade.
Stop Loss: Exit before premium erodes completely.
Avoid Over-leverage: Options look cheap but risk is real.
Hedge Positions: Combine with futures or other options.
Psychology of Option Traders
Greed: Chasing high-return trades without risk control.
Fear of Missing Out (FOMO): Jumping in near expiry due to excitement.
Patience: Waiting for correct setup is key.
Discipline: Stick to rules, avoid revenge trading.
Modern Trends in Option Trading
Weekly Expiry Craze: Thursday = biggest trading day.
0DTE (Zero Day to Expiry) Options: Popular for scalping.
Algo & AI Trading: Automated strategies now dominate.
Retail Participation Explosion: India has seen retail option traders grow 5x in 3 years.

Bitcoin fresh buy signal appear now start buying again Bitcoin fresh buy signal appear on harmonic patterns start buying again near support we are holding buy trade from 114900 ,
Support area: 114800-114400 , 113350, 112800
Resistance area: 115600-116020 , 116750-116990 , 118220-118530, 119370-119570
How My Harmonic pattern projection Indicator work is explained below :
Recent High or Low :
D-0% is our recent low or high
Profit booking zone ( Early / Risky entry) : D 11.8% -D 16.1 % is
range if break them profit booking start on uptrend or downtrend but only profit booking, trend not changed
SL reversal zone (Safe entry ) : SL 23% and SL 25% is reversal zone if break then trend reverse and we can take reverse trade
Target : T1, T2, T3, T4 and .
Are our Target zone
Any Upside or downside level will activate only if break 1st level then 2nd will be active if break 2nd then 3rd will be active.
Total we have 7 important level which are support and resistance area
Until , 16% not break uptrend will continue if break then profit booking will start.
If break 25% then fresh downtrend will start then T1, T2,T3 will activate
1,3,5,10,15,20 minutes are short term levels.
30 minutes 60 minutes , 2 hours,3 hours, ... 1 day and 1 week chart positional and long term levels

BTC TRYING TO FORM HEAD & SHOULDERHere in this chart i mentiond ..
1. A trendline in day time frame in blue colour and BTC is about to touch lower trend line.
NOTE:- If i follow the time there is 2 - 5 days remained to take reversal that will depends on lower trend line working as support/resistance.
2. I plotted a pattern HEAD & SHOULDER if it follow pattern it is sure that trend line may be broken by .
But But if BTC follow time it will not break the trend line and will get reversed.
Now this is not my buy/sell call.
